Fibo Candle Previous
- Göstergeler
- Sürüm: 4.0
- Güncellendi: 14 Ekim 2025
- Etkinleştirmeler: 10

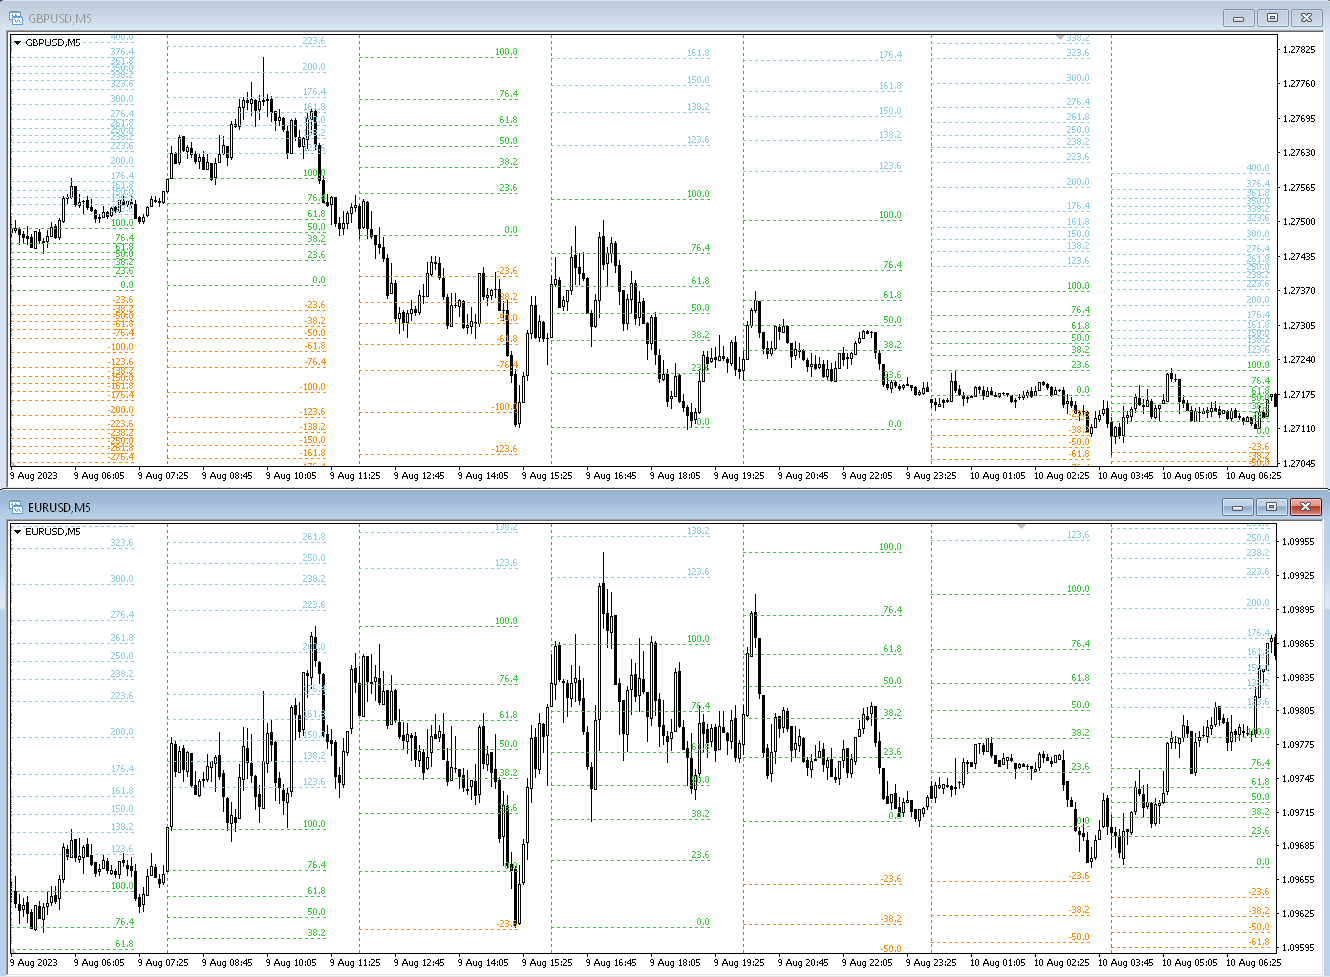
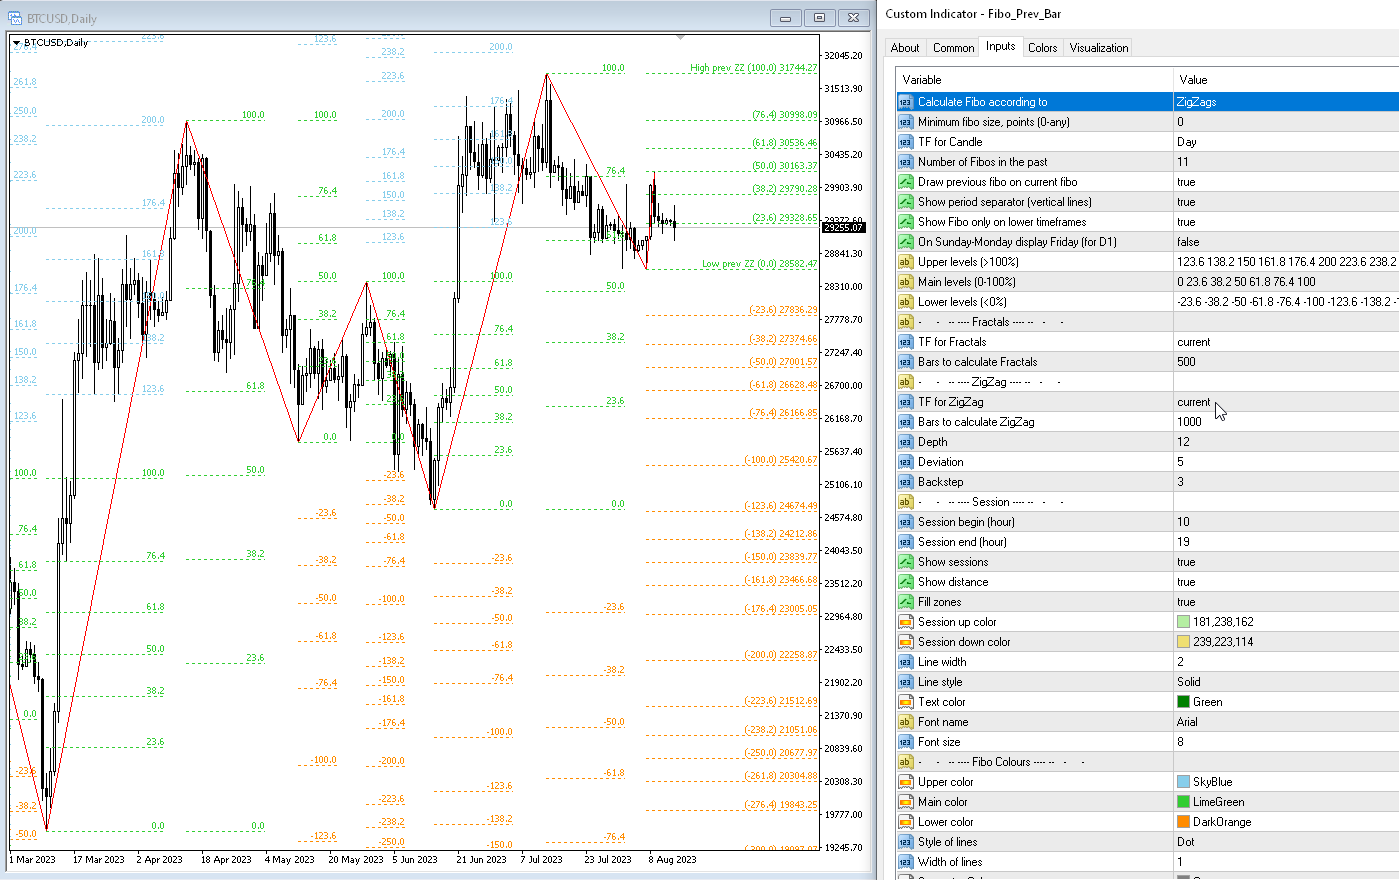
Gösterge, ZigZag göstergesine, İşlem Seanslarına, Fraktallara veya Mumlara (standart olmayan zaman dilimleri dahil: Yıl, 6 Ay, 4 Ay, 3 Ay, 2 Ay) (Otomatik Fibo Geri Çekme) dayalı olarak Fibonacci seviyelerini otomatik olarak çizer. Fibonachi hesaplaması için daha yüksek bir zaman dilimini seçebilirsiniz.
Mevcut çubuk her kapandığında seviyeler yeniden çizilir. Belirtilen seviyeleri geçerken uyarıları etkinleştirmek mümkündür.
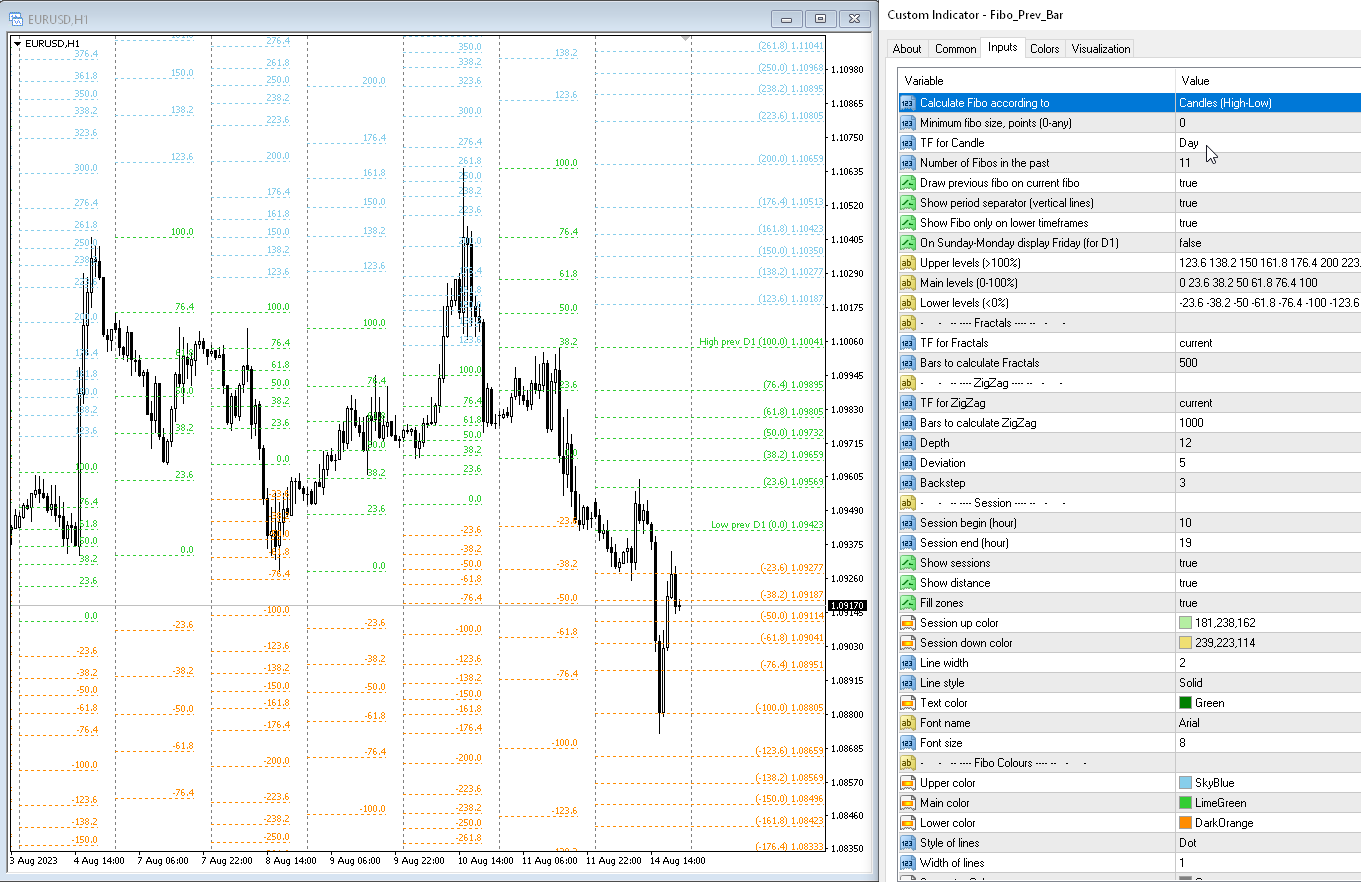
Ayrıca tarihteki seviyeleri de analiz edebilirsiniz. Bunun için "Geçmişteki Fibo Sayısı" parametresinde Fibo seviye sayısını belirtmeniz gerekmektedir
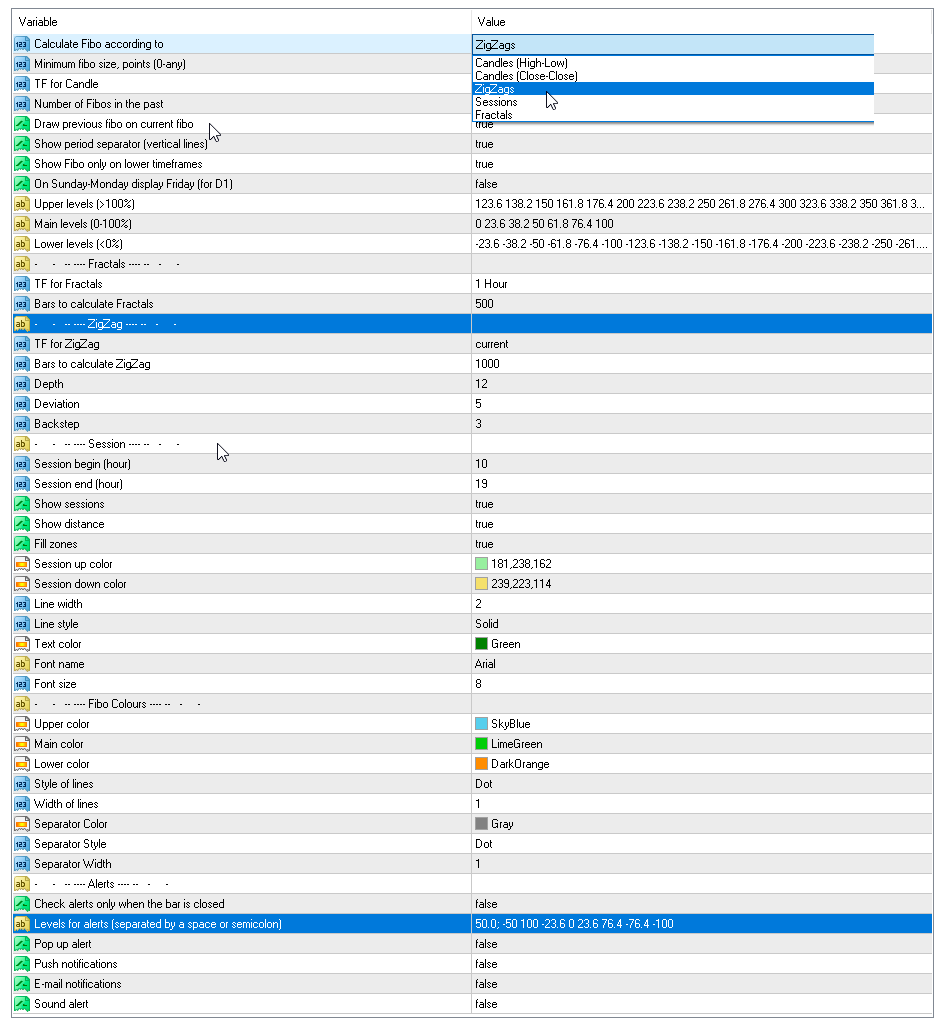
Parametreler
Calculate Fibo according to — Fibo hesaplama modları:
- Candles (High-Low) — yüksek-düşük seviyeye dayalı bir fibo oluşturun;
- Candles (Close-Close) — yakın kapanışa dayalı bir fibo oluşturun;
- ZigZags — ZigZag noktalarına göre fibo oluşturun;
- Sessions — Ticaret Oturumları ile fibo oluşturun;
- Fractals — Fraktal noktalarına göre fibo oluşturun.
Minimum fibo size, points (0-any) — puan cinsinden minimum Fibo boyutu. Fibo bu boyuttan küçükse göz ardı edilir.
TF for Candle — Fibo seviyelerini oluşturmak için mumların zaman çerçevesi;
Number of Fibo in the past — tarihte çizilecek Fibo seviyelerinin sayısı;
Upper levels (>100%) — üst seviyeler, değerler 100'den büyük olmalıdır (boşluk veya noktalı virgülle ayrılmış olarak);
Main levels (0-100%) — orta düzeyler, değerler 0 ile 100 arasında olmalıdır (boşluk veya noktalı virgülle ayrılmış);
Lower levels (<0%) — daha düşük seviyeler, değerler 100'den az olmalıdır (boşluk veya noktalı virgülle ayrılmış olarak);
Draw previous fibo on current fibo — mevcut Fibo'nun yerine önceki Fibo'yu çizin. Bu parametreyi devre dışı bırakırsanız Fibo'lar hesaplandıkları seviyelerde çekilecektir.
On Sunday-Monday display Friday (for D1) — Cumartesi-Pazar günleri kotalar varsa, Cuma fibo'sunu çizin. Yalnızca D1 dönemi için;
Show period separator (vertical lines) — nokta ayırıcıyı gösterir. Grafikte dikey çizgiler olarak gösterilecektir;
Show Fibo only on lower timeframes — Fibo'yu yalnızca daha küçük dönemlerde çizin;
Upper color — üst çizgilerin rengi;
Main color — orta çizgilerin rengi;
Lower color — alt çizgilerin rengi;
Style of lines — çizgi stili;
Width of lines — çizgi genişliği;
Min pause between signals (sec) — uyarılar arasında saniyeler içinde duraklama;
Levels for alerts (separated by a space or semicolon) — uyarı düzeyleri, boşluk veya noktalı virgülle ayrılmış;
Alerts — açılır uyarıları etkinleştirin;
Push notification — anlık bildirimleri etkinleştirin;
Send e-mail —e-posta gönderin.
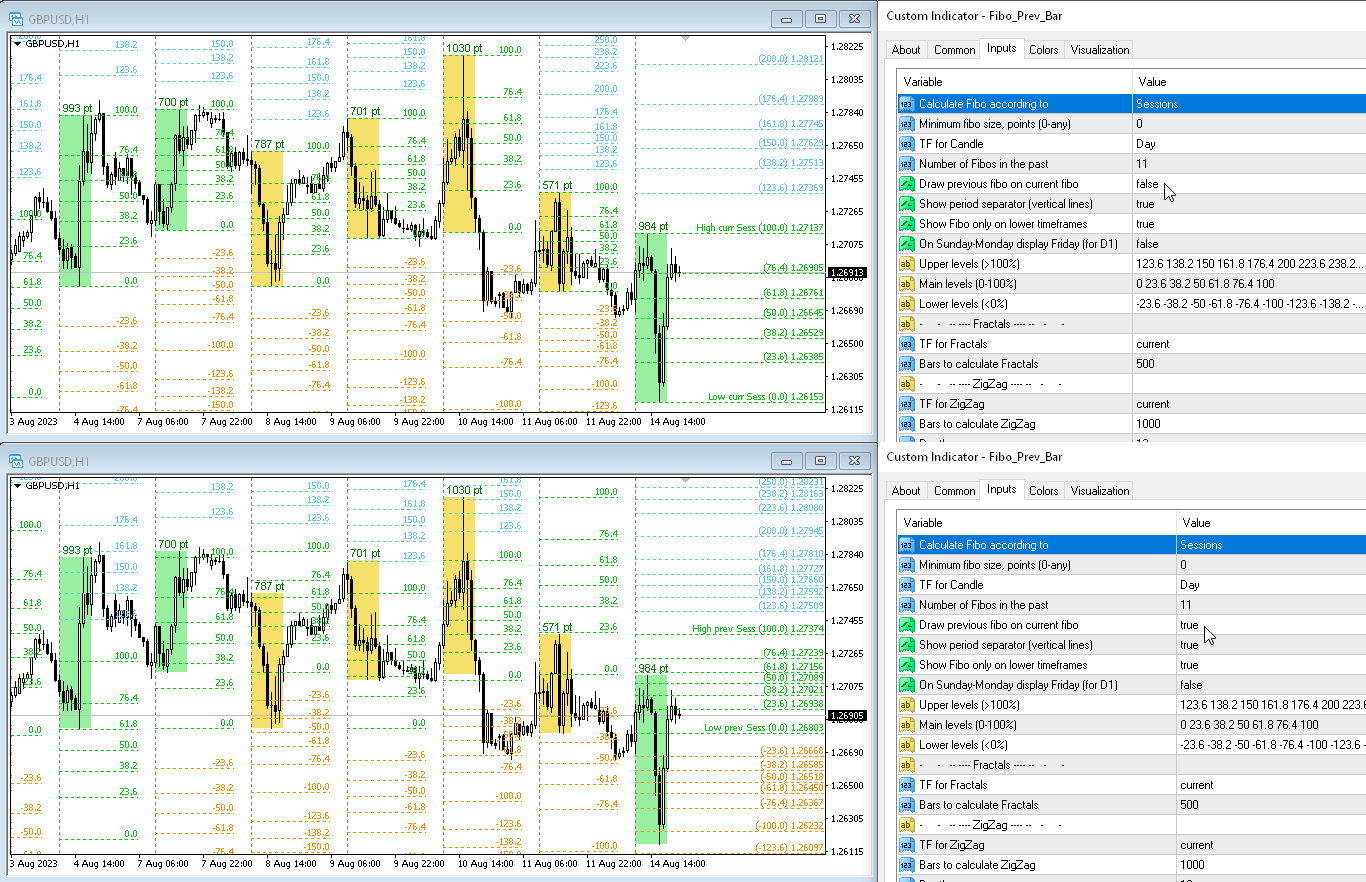

A comprehensive indicator for those who use Fibonacci in intraday trading. It notifies you about the previous day while simultaneously providing real-time retracements for the current session with absolute accuracy. A talented programmer and highly cooperative. Congratulations!!!