UPD1 Volume BOX
- Göstergeler
-
Vitaliy Kuznetsov
 UPD1 MT4 Indicators - https://www.mql5.com/en/market/mt4/indicator?filter=UPD1
Levels
Patterns
Volume
Money Management - Sürüm: 3.71
- Güncellendi: 1 Ocak 2025
- Etkinleştirmeler: 20
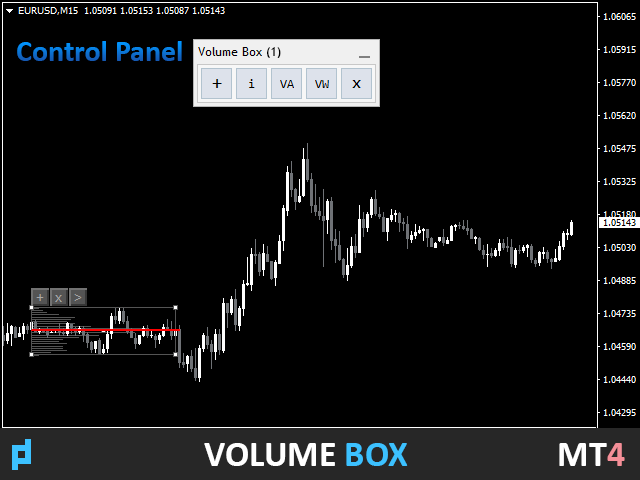
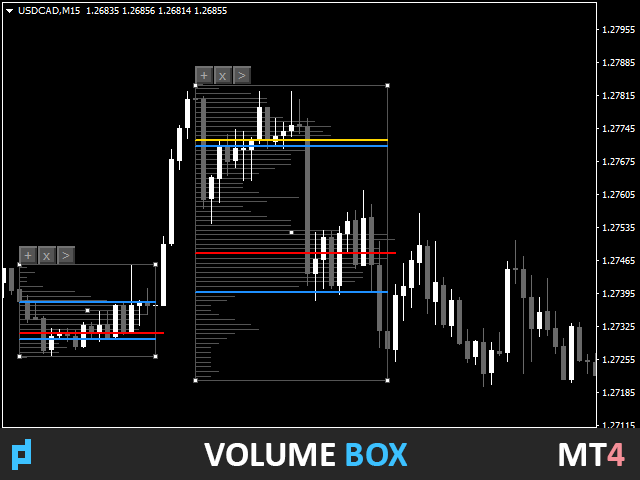
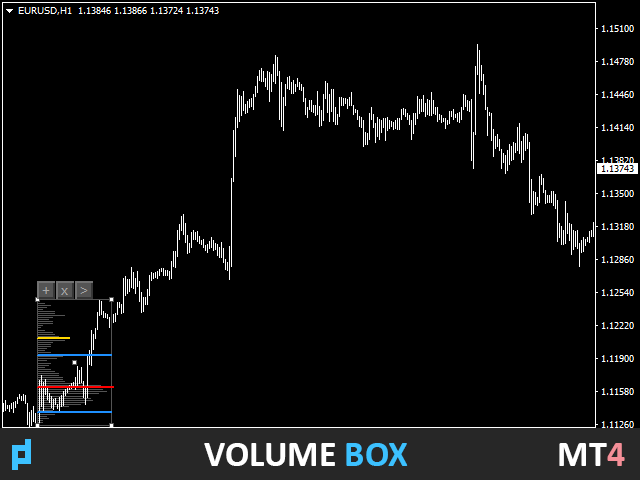
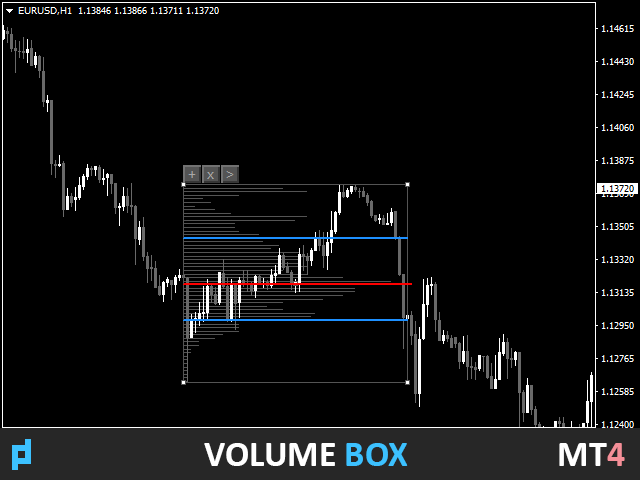
Gösterge, belirtilen alandaki (BOX) yatay hacim profilini ve maksimum hacmi (POC) görüntüler.
Ürün Özellikleri.
1. Keneleri veya sadece fiyatı kullanabilirsiniz.
2. Uyarlanabilir ızgara aralığı (M1-MN).
3. Kutu boyutuna bağlı olarak uyarlanabilir yüksek hacimli (medyan) arama adımı.
4. Kutu çizgileri ve düğmeler için otomatik bukalemun rengi.
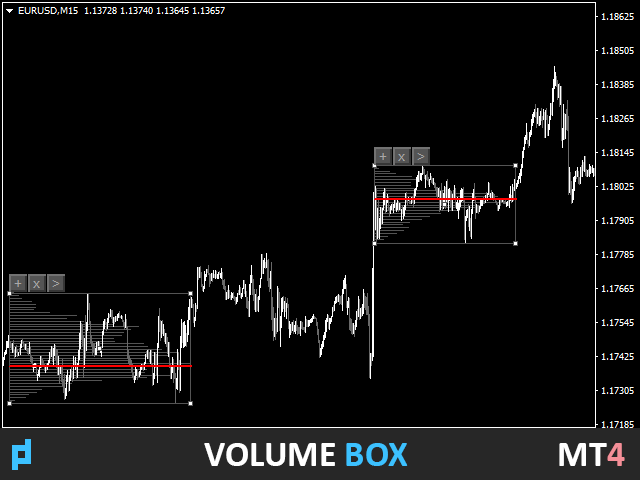
5. Çoklu kutular, oluşturulması ve silinmesi kolay.
6. %70 hacim alanı (ayarlardan etkinleştirilir).
7. Maksimum yatay hacim çizgisine (POC) dokunmak için bir uyarı var.
8. VWAP.
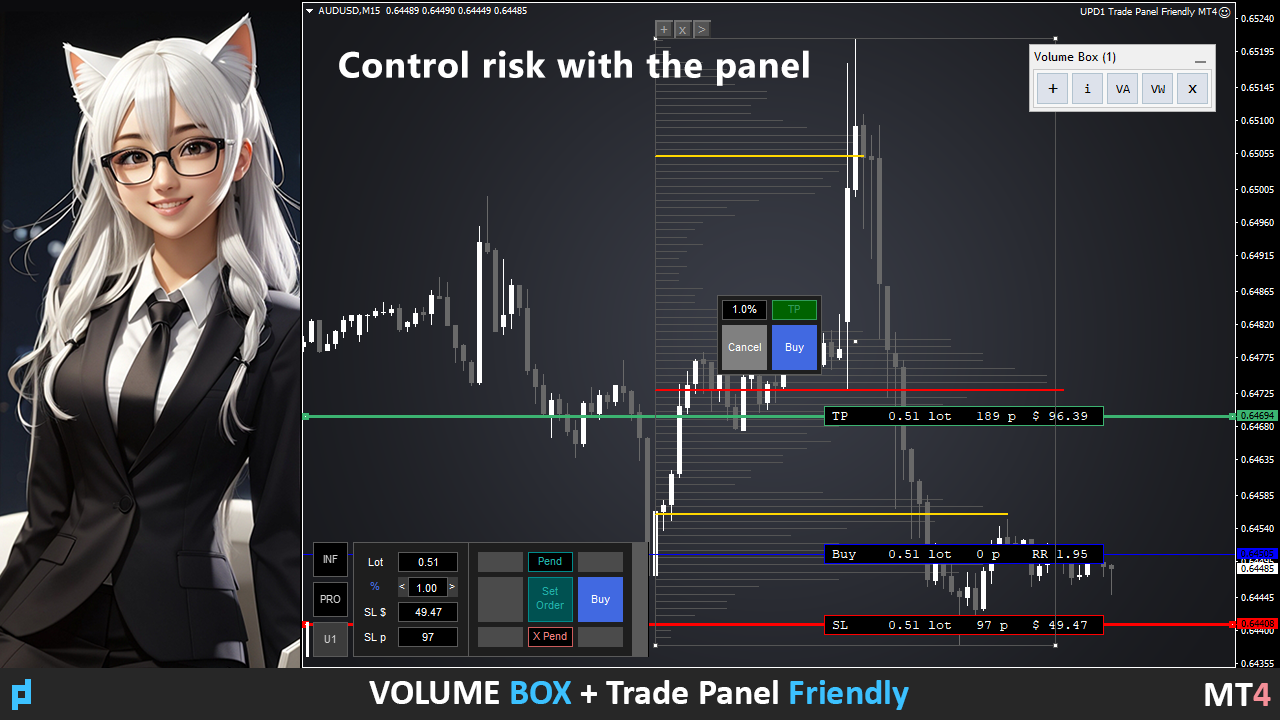
9. Kontrol Paneli.
Hacim profili göstergesiyle pazarı keşfedin. Bunu kendim için yaptım, ama şimdi sizin için de mevcut.
Ana ayarlar.
Calc Histo Mode – histogram hesaplama yöntemi (Market Profile – fiyata göre hesaplama, Tick Volume Profile – kene ile hesaplama).
Mode Step In Pips – pip ile medyan çizgilerin hesaplanması.
Vertical Step – histogramın dikey adımı (pip cinsinden çizgiler arasındaki mesafe).
Data Source – tırnak zaman diliminin otomatik seçimi (H1'e kadar M1'den keneler alır).
Touch First Bar - POC hattı uzantısının ilk dokunuşta durmasını sağlamak için açın.
Hide Button - düğme ayarını gizleme (dikdörtgen etkin olmadığında).
Denetim Masası Ayarları.
Control Panel – bu ayar, grafikteki kontrol panelini etkinleştirmenizi sağlar.
Control Panel Zoom (0 - auto) - panel boyutunu yüzde olarak seçin (50, 100, 200 ve diğerleri).
Color Theme - panel renk temasının otomatik veya manuel seçimi (açık ve koyu).
Show Histo - bu ayar ana profil histogramının görüntülenmesini sağlar.
Show Info - bu ayar toplam tik hacmi sayısının görüntülenmesini sağlar.
Görsel ayarlar.
Button Color - bukalemun veya gri.
BOX Color (None - Chameleon) – kutu çerçeve rengi. Renk Yok ise, bukalemun modu kullanılacaktır.
BOX Line Style – çerçeve çizgi stili (düz, noktalı vb.).
BOX Line Width – kutu çizgisinin kalınlığı.
Histo Color (None - Chameleon) – yatay histogram çizgilerinin rengi. Renk Yok ise, bukalemun modu kullanılacaktır.
Chameleon Color % - parlaklığın orijinal arka plan renginden değiştirileceği yüzdeyi belirtin.
Histo Width – yatay histogram çizgilerinin kalınlığı.
POC Color – maksimum yatay hacim rengi (POC).
Median Line Color – medyan renk (yüksek yatay hacim).
POC And Median Line Width – medyan çizgi kalınlığı ve maksimum yatay hacim (POC).
Extend Median Line Style – kutunun kenarına medyanın çizgi stili. Varsayılan olarak devre dışı.
Extend POC Line Style – POC devam çizgisi stili kutudan çıktı. Çerçevedeki > düğmesine basılarak etkinleştirilir.
Extend POC Line Width (If Style Solid) – düz bir stil seçilirse kutunun dışındaki POC devam çizgisinin kalınlığı.
Hacim Alanı Ayarları.
Show Volume Area – hacimsel fiyat aralığını göster.
VA TPO In % – hacimsel fiyat aralığı. Yüzde olarak ayarla.
VA Line Style – fiyat aralığı çizgi stili (VAH ve VAL) (Hacim Alanı Yüksek, Hacim Alanı Düşük).
VA Line Width – fiyat aralığı çizgi kalınlığı.
VA Line Color – fiyat aralığı çizgi rengi.
VWAP Ayarları.
VWAP - bu ayar, kutudaki grafikte VWAP satırlarını etkinleştirmenizi sağlar.
VWAP Line Style - çizgi stilini ayarlama.
VWAP Line Width - çizgi genişliğini ayarlama.
VWAP R3-S3 Color - çizgi rengini ayarlama.
Uyarı Ayarları.
Alert - bildirim ayarlarını etkinleştir / devre dışı bırak.
Alert Work Time - uyarının aktif olacağı süreyi belirtin.
Alert Pop Up - uyarı açılır penceresini etkinleştir / devre dışı bırak.
Alert Push - telefona bildirimi etkinleştir / devre dışı bırak.
Alert E-mail - e-posta bildirimini etkinleştir / devre dışı bırak.
Alert Sound - sesli bildirimi etkinleştir / devre dışı bırak.
Alert Sound Name - sesli uyarı dosyasını seçin.


Wonderful Indicator. It has totally transformed my trading. Makes all other indicators I have used previously look very ordinary.