MACD Dashboard

5
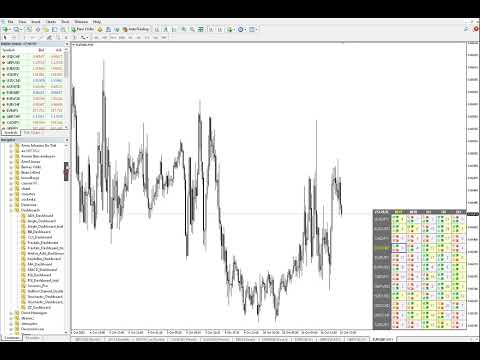
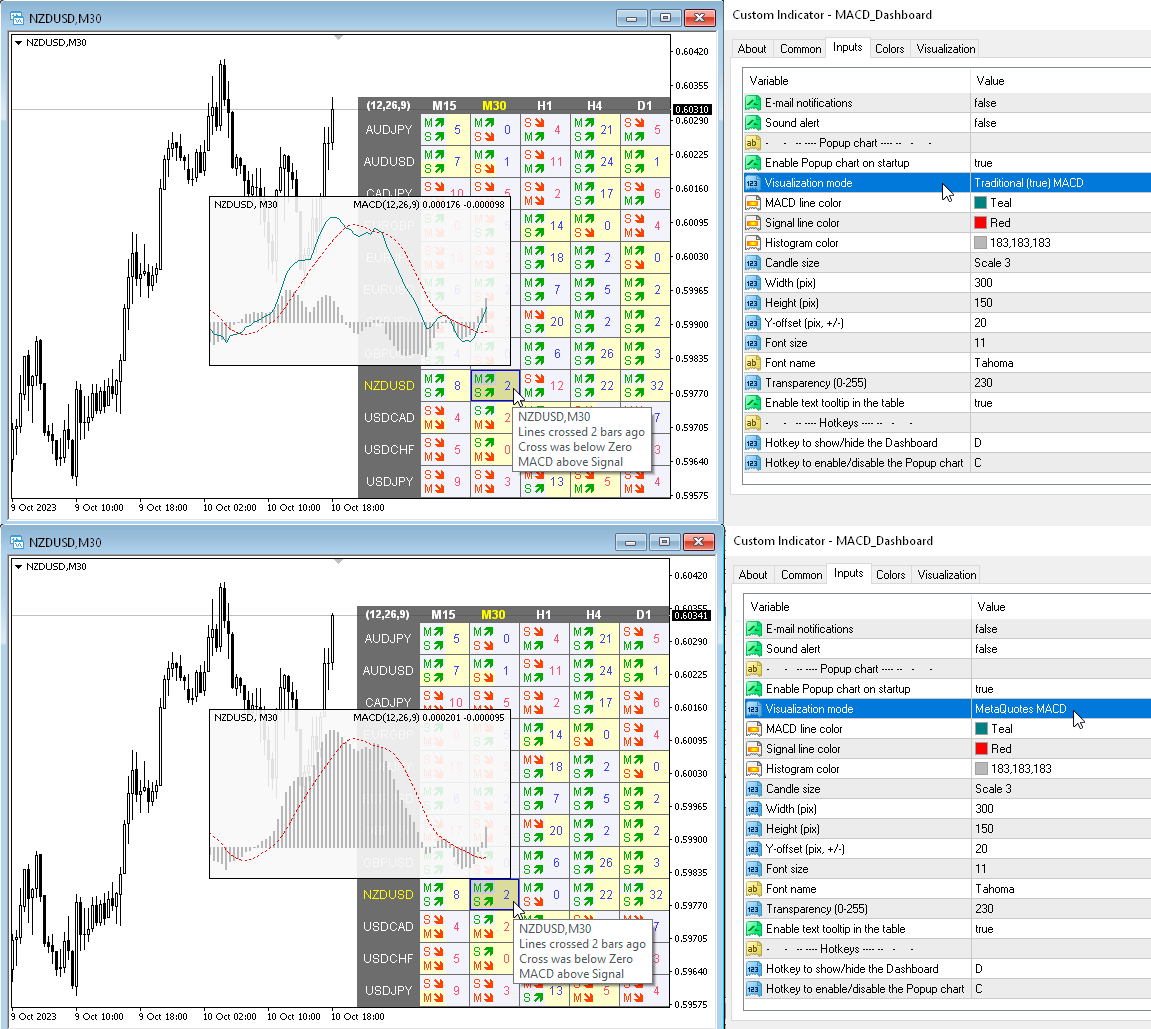
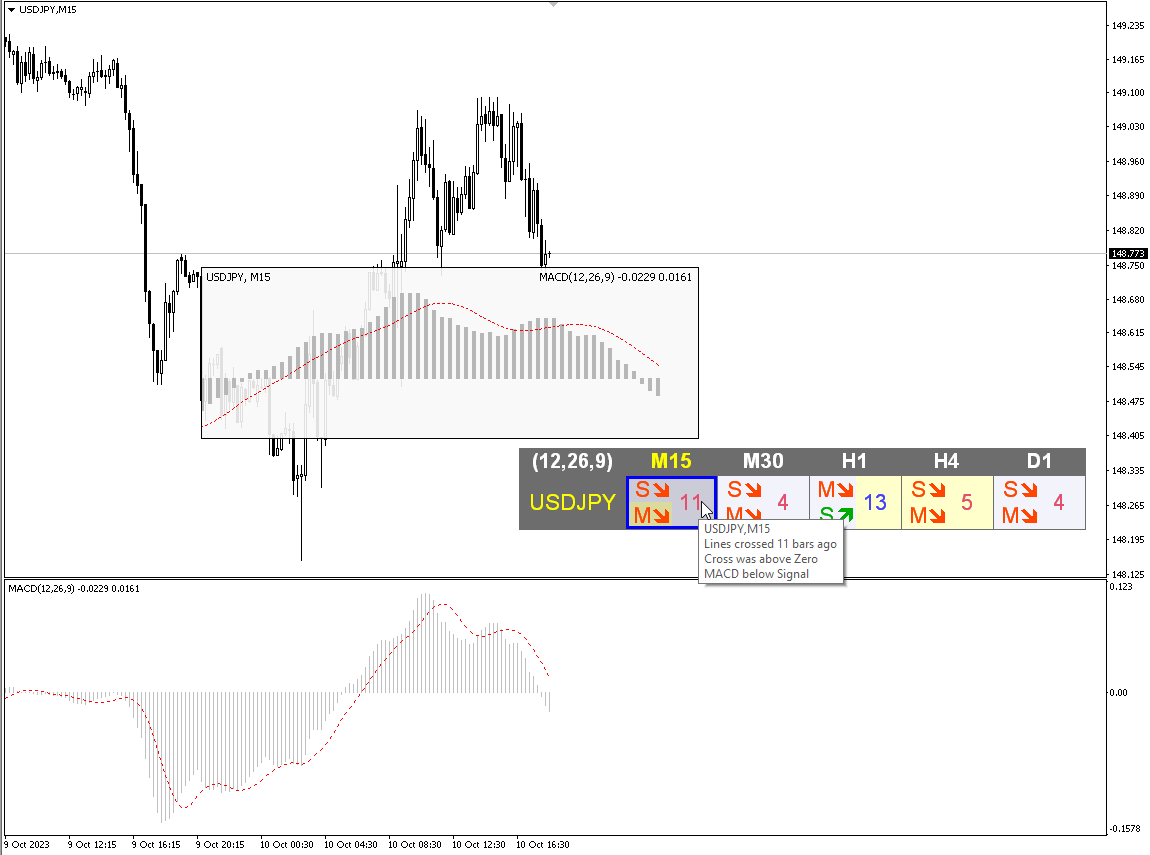
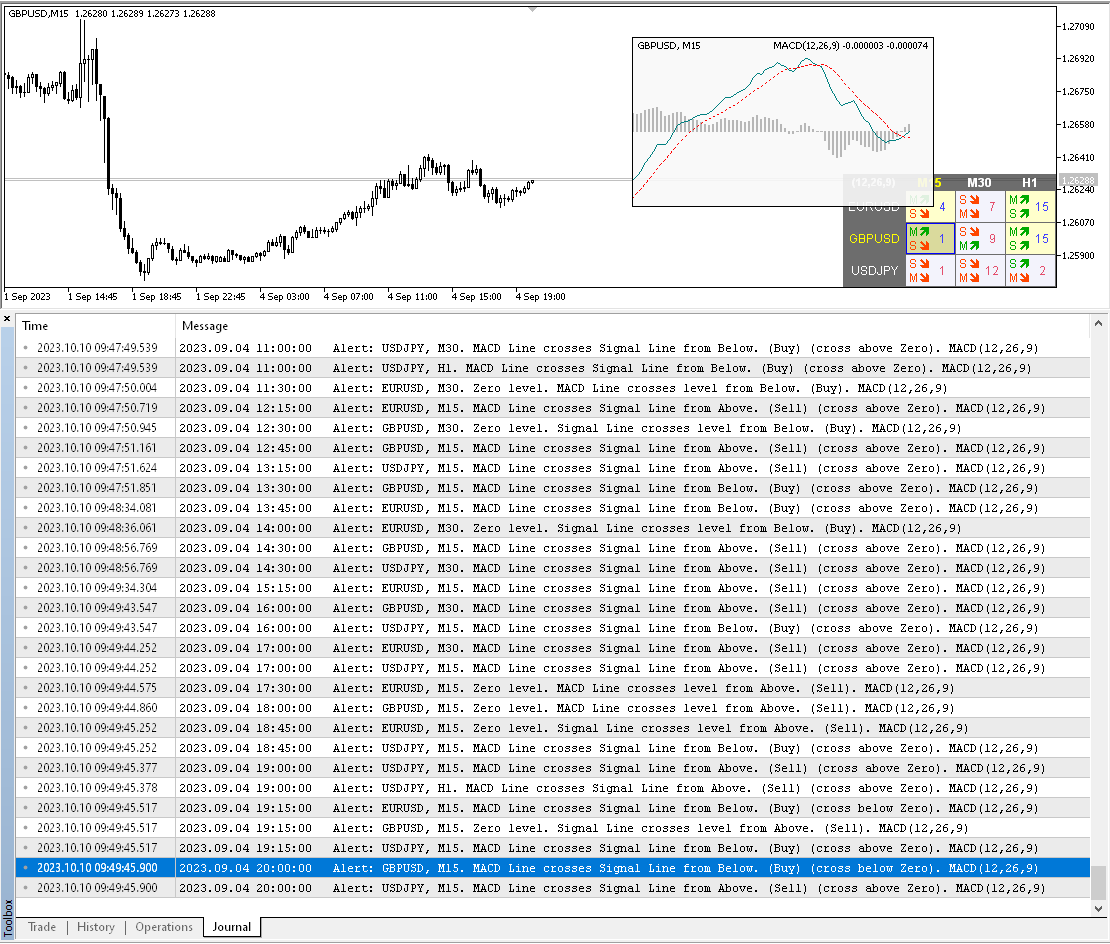
Çoklu para birimi ve çoklu zaman dilimi göstergesi MACD. Kontrol paneli hem Geleneksel (gerçek) MACD'yi hem de MetaTrader'da yerleşik olan MACD'yi görüntüleyebilir.

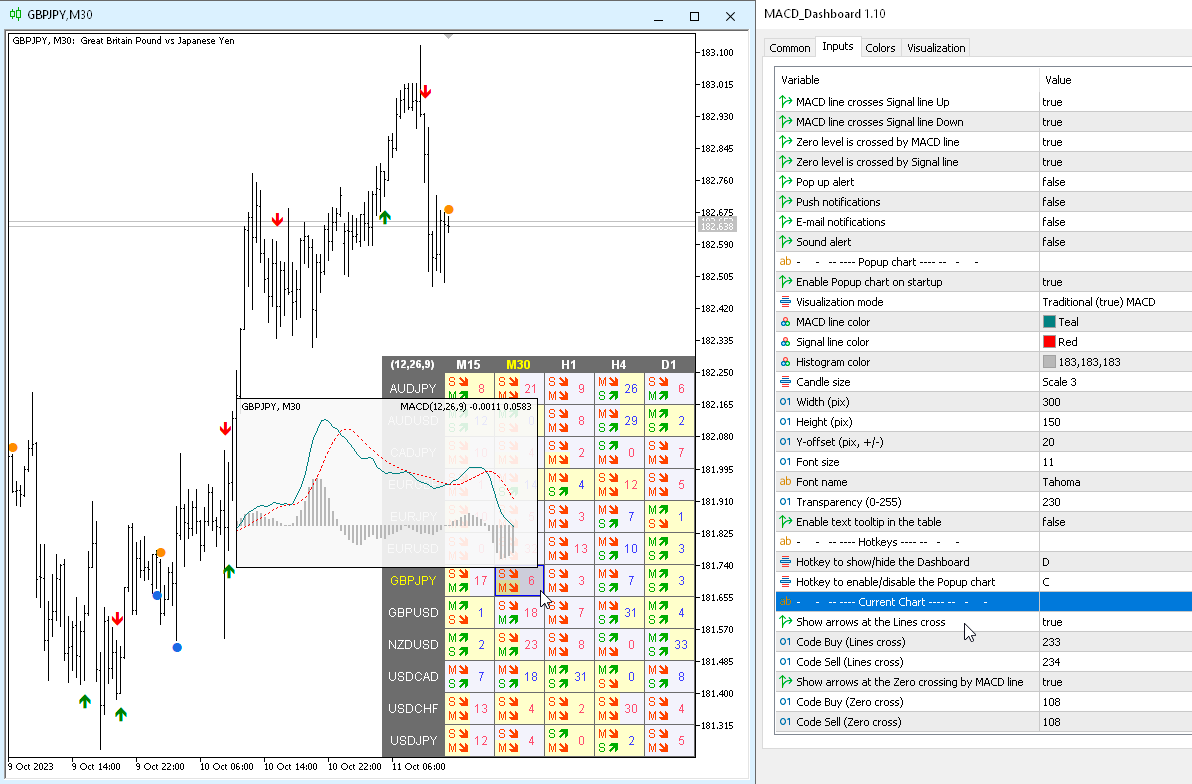
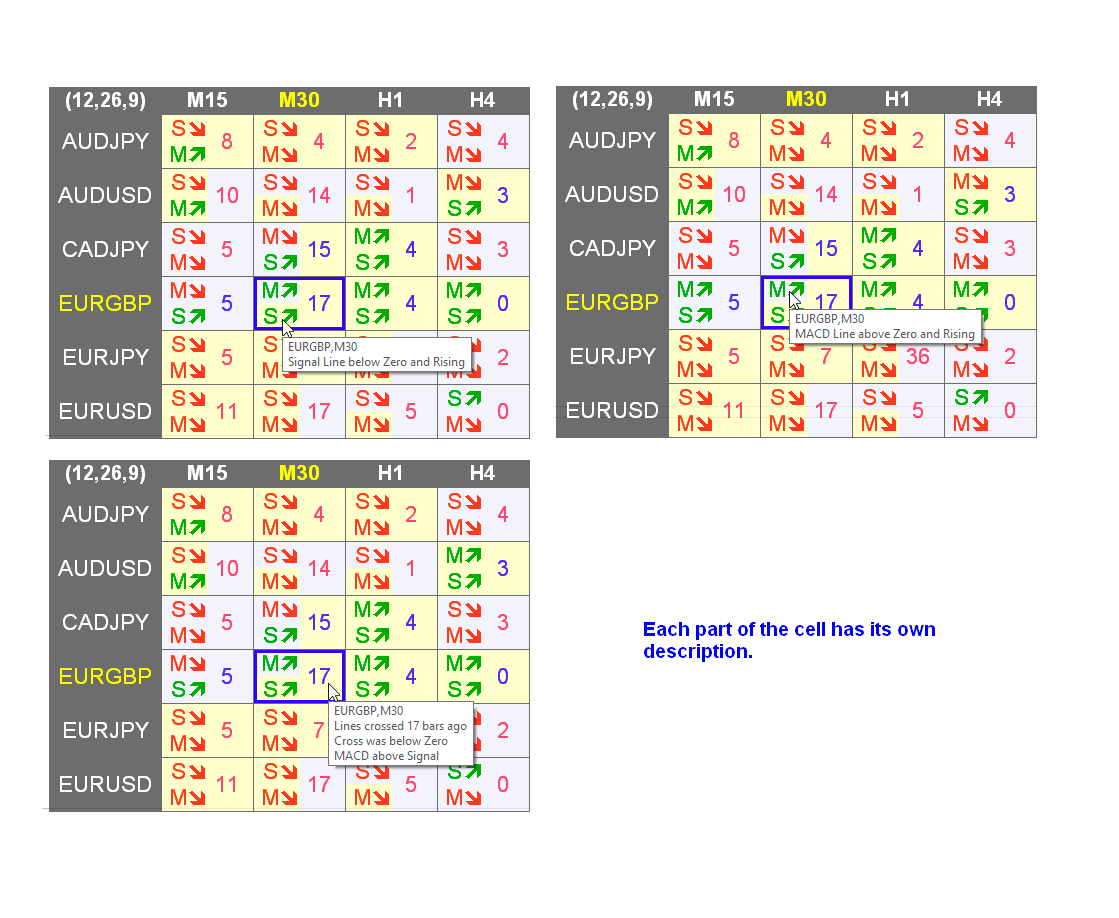
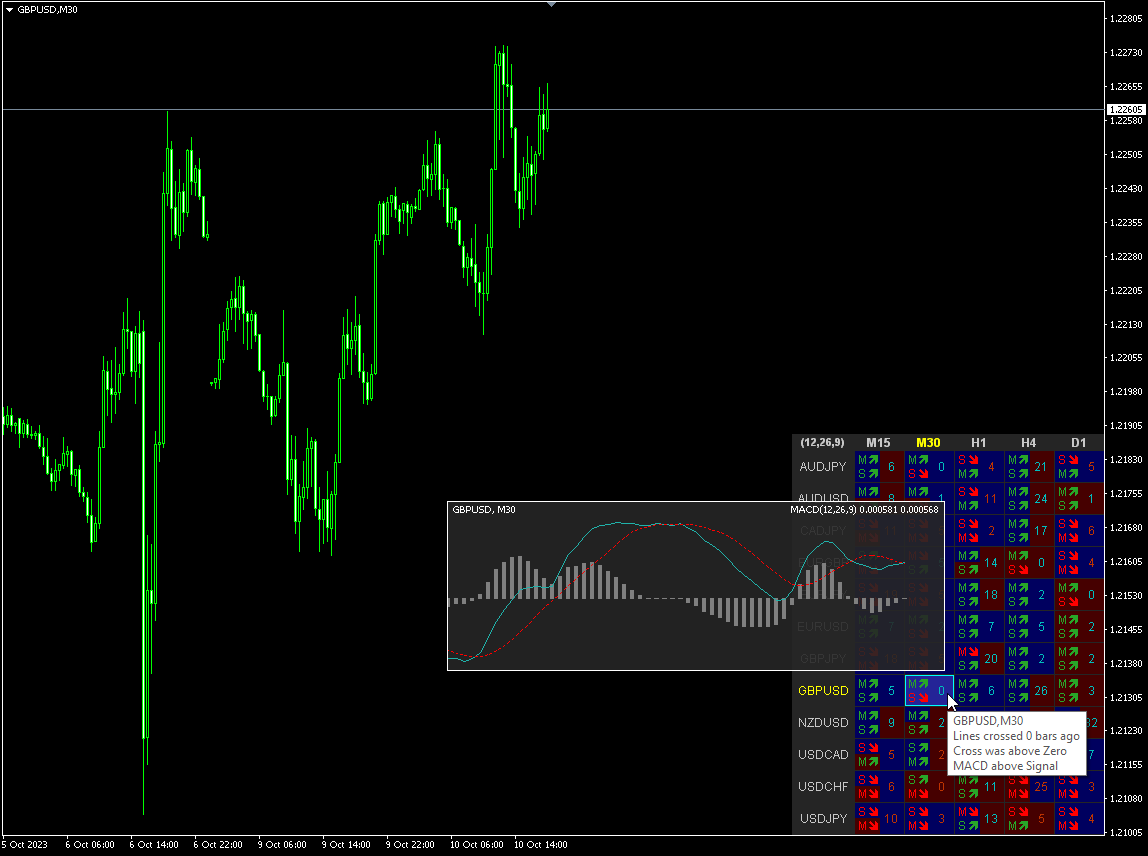
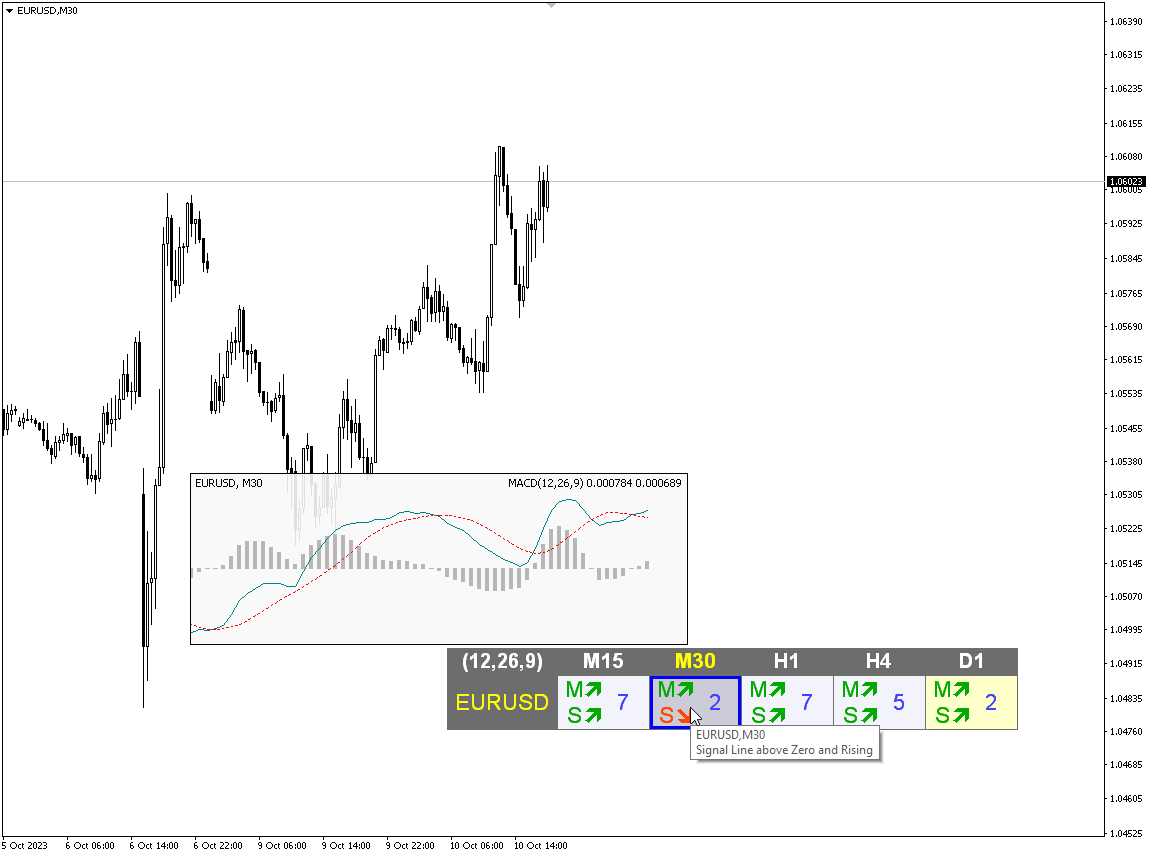
Panelde göstergenin mevcut durumunu, MACD çizgilerinin hareket yönünü, kesişimlerini ve gösterge grafiğini içeren bir açılır pencereyi görebilirsiniz. Parametrelerde istediğiniz herhangi bir çift sembolü ve zaman dilimini belirleyebilirsiniz. Tarayıcı aynı zamanda birbirini kesen çizgiler ve Sıfır seviyesini geçen çizgiler hakkında da bildirim gönderebilir. Bir hücreye tıklandığında verilen sembol ve nokta açılır.

Ayrıca Fiyat ile MACD Çizgisi arasındaki ayrışmayı (Normal ve Gizli) ve Fiyat ile Histogram arasındaki ayrışmayı da görebilirsiniz.

Böylece, MACD ana çizgisi ile Sinyal çizgisinin veya Sıfır seviyesinin kesişimini bulmak için tüm zaman dilimlerindeki tüm çiftleri ve sembolleri kolayca tarayabilirsiniz.


Kontrol Panelini göstermek/gizlemek için kullanılan kısayol tuşu varsayılan olarak "D"dir.
Açılır pencere grafiğini etkinleştirmek/devre dışı bırakmak için kullanılan kısayol tuşu varsayılan olarak "C"dir.
'1' ve '2' grafiğindeki Oklar arasında geçiş yapmak için kısayol tuşları
MACD (Hareketli Ortalama Yakınsama/Uzaklaşma) göstergesi (veya "osilatör"), çoğunlukla kapanış fiyatı olmak üzere geçmiş fiyat verilerinden hesaplanan üç zaman serisinin bir koleksiyonudur. Bu üç seri şunlardır: MACD serisi, "sinyal" veya "ortalama" seri ve ikisi arasındaki fark olan "ıraksama" serisi. MACD serisi, fiyat serisinin "hızlı" (kısa dönemli) üstel hareketli ortalaması (EMA) ile "yavaş" (uzun dönemli) EMA'sı arasındaki farktır. Ortalama seri, MACD serisinin kendisinin bir EMA'sıdır.
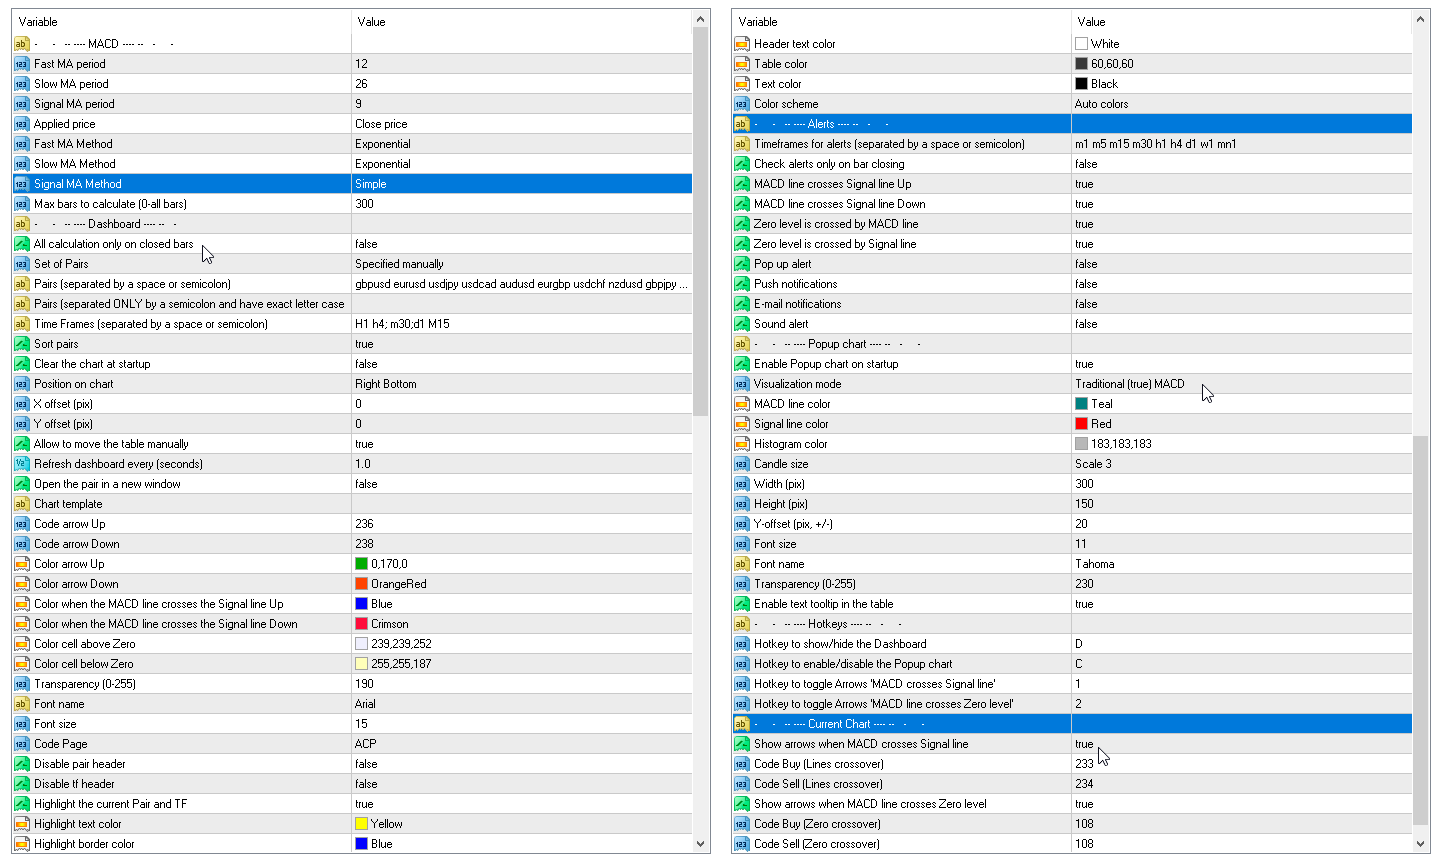
Parametreler

MACD
  • Fast MA period — Hızlı ortalama hesaplama dönemi
  • Slow MA period — Yavaş ortalama hesaplama dönemi
  • Signal MA period — fark ortalamalarının alınması için dönem
  • Applied price — kullanılan fiyat türü
  • Fast MA Method — Hızlı ortalama için yumuşatma türü
  • Slow MA Method — Yavaş ortalama için yumuşatma türü
  • Signal MA Method — Sinyal ortalaması için yumuşatma türü. Yöntemler aşağıdaki değerlerden birine sahip olabilir:
    • Simple averaging - SMA;
    • Exponential averaging - EMA;
    • Smoothed averaging - SMMA;
    • Linear-weighted averaging - LWMA;
  • Max bars to calculate (0-all bars) — Hesaplanacak maksimum çubuklar (0-tüm çubuklar).

Gösterge Paneli
All calculation only on closed bars — Tüm hesaplamalar yalnızca kapalı çubuklarda
Set of Pairs (multi-symbol) — Çiftler Kümesi (çoklu sembol):
— Market Watch — MT'nin "Piyasa Gözlemi"nden çiftler;
— Specified manually — "Çiftler" parametrelerinde manüel olarak belirtilen çiftler.
— Current pair — yalnızca geçerli çifti gösterir.
Pairs (separated by a space or semicolon) — Çiftler (boşluk veya noktalı virgülle ayrılmış)
Pairs (separated ONLY by a semicolon and have exact letter case) — Çiftler (YALNIZCA noktalı virgülle ayrılmış ve büyük/küçük harflerle ayrılmış)
Time Frames (separated by a space or semicolon) (multi time frame - MTF) — Zaman Çerçeveleri (boşluk veya noktalı virgülle ayrılmış) (çoklu zaman çerçevesi - MTF)
Sort pairs — Çiftleri sırala
Clear the chart at startup — Başlangıçta grafiği temizle
Position on chart — Grafikteki konum
X offset (pix) — X ofseti (piksel)
Y offset (pix) — Y ofseti (piks)
Allow to move the table manually — Tablonun manuel olarak taşınmasına izin ver
Refresh dashboard every (seconds) — Kontrol panelini her (saniyede bir) yenile
Open the pair in a new window — Çifti yeni bir pencerede aç
Chart template — Grafik şablonu
Code arrow Up — Kod yukarı oku
Code arrow Down — Kod oku Aşağı
Code Stop — Kod Durdurma
Color arrow Up — Renkli ok Yukarı
Color arrow Down — Renkli ok Aşağı
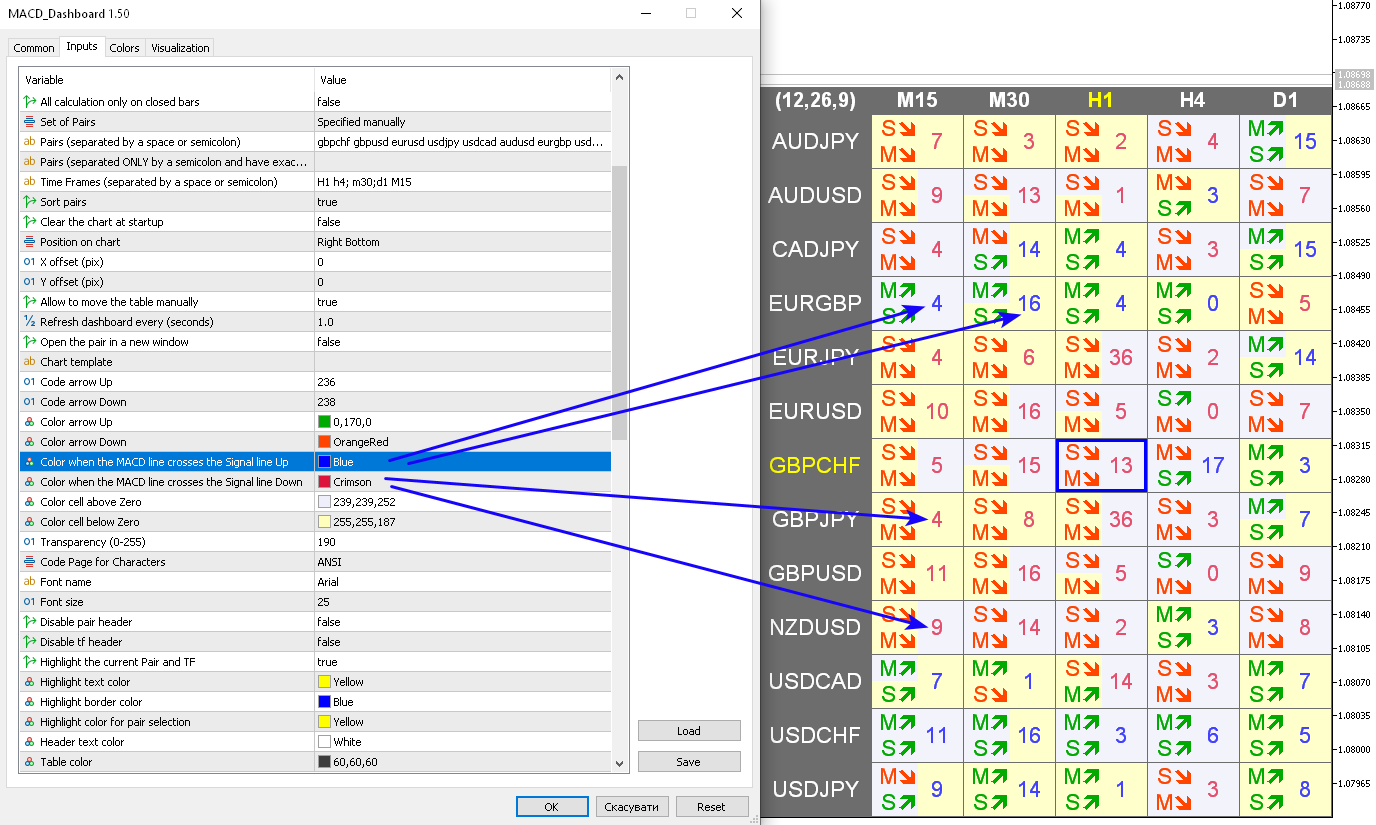
Color when the MACD line crosses the Signal line Up — MACD çizgisi Sinyal çizgisini geçtiğinde renk Yukarı
Color when the MACD line crosses the Signal line Down — MACD çizgisi Aşağı Sinyal çizgisini geçtiğinde renk
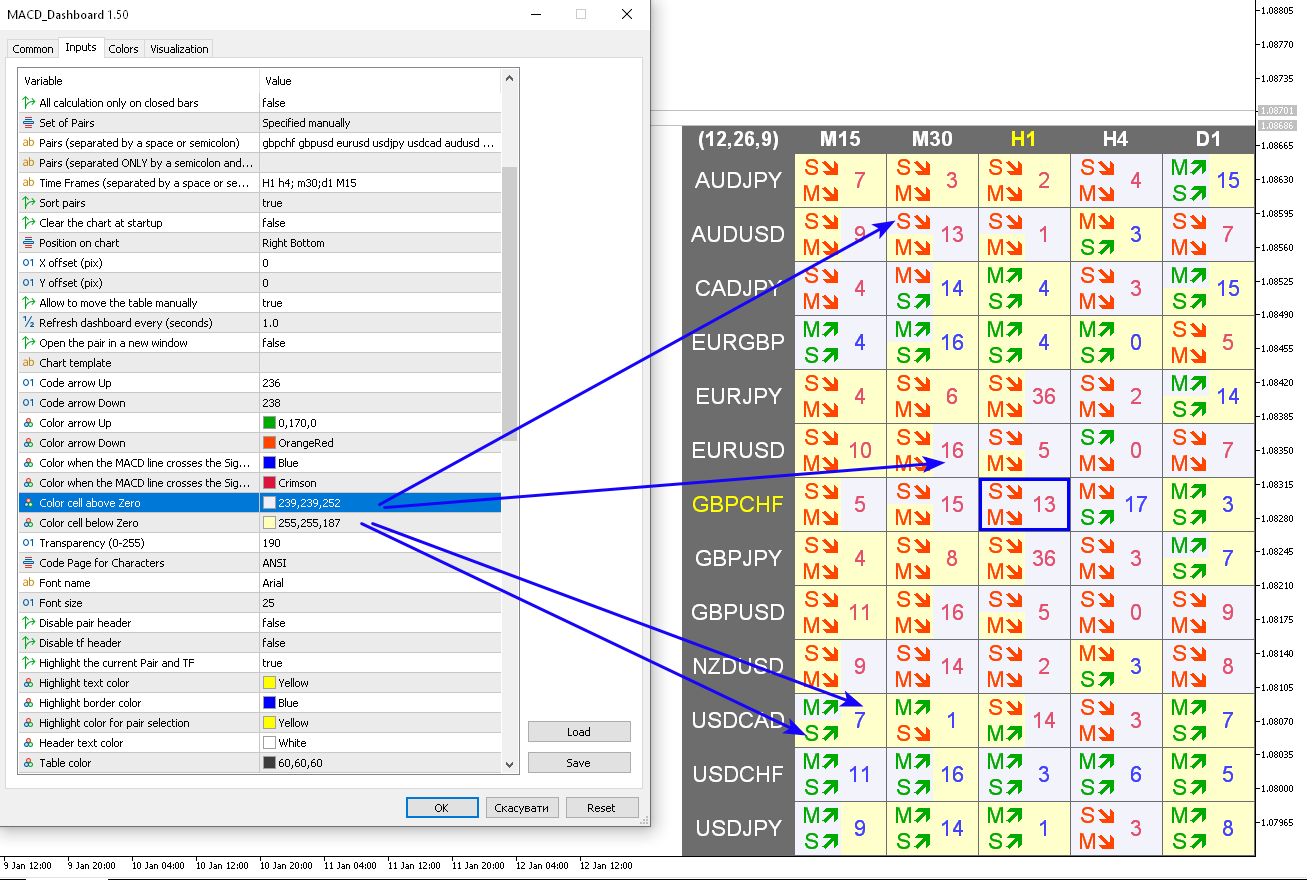
Color cell above Zero — Sıfırın üzerindeki renk hücresi
Color cell below Zero — Sıfırın altındaki renk hücresi
Transparency (0-255) — Şeffaflık (0-255)
Font name — Yazı tipi adı
Font size — Yazı Boyutu
Disable pair header — Çift başlığını devre dışı bırak
Disable tf header — TF başlığını devre dışı bırak
Highlight the current Pair and TF — Mevcut Çifti ve TF'yi vurgulayın
Highlight text color — Metin rengini vurgula
Highlight border color — Kenarlık rengini vurgula
Highlight color for pair selection — Çift seçimi için rengi vurgulayın
Header text color — Başlık metni rengi
Table color — Masa rengi
Text color — Metin rengi
Color scheme — Renk uyumu

Uyarılar
Timeframes for alerts (separated by a space or semicolon) — Uyarılara ilişkin zaman dilimleri (boşluk veya noktalı virgülle ayrılmış)
Check alerts only on bar closing — Uyarıları yalnızca çubuk kapatıldığında kontrol edin
MACD line crosses Signal line Up — MACD çizgisi Yukarı Sinyal çizgisini geçiyor
MACD line crosses Signal line Down — MACD çizgisi Sinyal çizgisini geçiyor Aşağı
Zero level is crossed by MACD line — Sıfır seviyesi MACD çizgisi tarafından geçiliyor
Zero level is crossed by Signal line — Sıfır seviyesi Sinyal hattı tarafından geçiliyor
Pop up alert — Açılan uyarı
Push notifications — Push bildirimleri
E-mail notifications — E-posta Bildirimleri
Sound alert — Ses Alarmi

Açılan grafik
Enable Popup chart on startup — Başlangıçta Pop-up grafiğini etkinleştir
Visualization mode — Görselleştirme modu:
  • Traditional (true) MACD
  • MetaQuotes MACD
MACD line color — MACD çizgi rengi
Signal line color — Sinyal hattı rengi
Histogram color — Histogram rengi
Candle size — Mum boyutu
Width (pix) — Genişlik (piks)
Height (pix) — Yükseklik (piksel)
Y-offset (pix, +/-) — Y ofseti (piks, +/-)
Font size — Yazı Boyutu
Font name — Yazı tipi adı
Transparency (0-255) — Şeffaflık (0-255)
Enable text tooltip in the table — Tabloda metin ipucunu etkinleştir

Kısayol tuşları
Hotkey to show/hide the Dashboard — Kontrol Panelini göstermek/gizlemek için kısayol tuşu
Hotkey to enable/disable the Popup chart — Açılır pencere grafiğini etkinleştirmek/devre dışı bırakmak için kısayol tuşu
Hotkey to toggle Arrows 'MACD crosses Signal line' — Okları değiştirmek için kısayol tuşu 'MACD Sinyal hattını geçiyor'
Hotkey to toggle Arrows 'MACD line crosses Zero level' — Okları değiştirmek için kısayol tuşu 'MACD çizgisi Sıfır seviyesini geçiyor'

Current Chart — Güncel Grafik
Show arrows when MACD crosses Signal line — MACD Sinyal çizgisini geçtiğinde okları göster
Code Buy (Lines crossover) — Kod Satın Alma (Satır geçişi)
Code Sell (Lines crossover) — Kod Satışı (Satır geçişi)
Show arrows when MACD line crosses Zero level — MACD çizgisi Sıfır seviyesini geçtiğinde okları göster
Code Buy (Zero crossover) — Kod Satın Alma (Sıfır geçiş)
Code Sell (Zero crossover) — Kod Satışı (Sıfır geçiş).
Değerlendirmeler 2
MP_mpap
633
MP_mpap 2025.03.05 20:09 
 

3/5/2025:

It covers all MACD indicator signals with a very well-designed dashboard that is easy to use. The settings are extremely detailed. Excellent work! Bravo!

6/27/2025 :

I've been a trader for 15 years... The developer is simply incredible! There aren’t many words—just amazing results. I've purchased many of his products—each one better than the last. The support is fantastic.

If someone wants a serious “view” of the market, these are the ultimate tools!

A thousand thanks, Taras! Keep up the great work!

P.S. I run Taras’s products 24/7 on a VPS. Every tool he has created provides professional-grade insights.

Brinol1
22
Brinol1 2024.12.13 01:11 
 

Extremely well designed and coded indi, if you use the MACD for finding pullbacks and other trades you wont need anything else to keep an eye on all your instruments. Fantastic Indicator.

Önerilen ürünler
The indicator detects and displays Shark harmonic pattern (see the screenshot). The pattern is plotted by the extreme values of the ZigZag indicator (included in the resources, no need to install). After detecting the pattern, the indicator notifies of that by a pop-up window, a mobile notification and an email. The indicator highlights the process of the pattern formation and not just the complete pattern. In the former case, it is displayed in the contour triangles. After the pattern is comple
Infinity Trend Pro
Yaroslav Varankin
1 (1)
This is a trend indicator without redrawing Developed instead of the binary options strategy (by the color of the Martingale candlestick) Also works well in forex trading When to open trades (binary options) A signal will appear in the place with a candle signaling the current candle It is recommended to open a deal for one candle of the current timeframe M1 and M5 When a blue dot appears, open a deal up When a red dot appears, open a trade down. How to open trades on Forex. When a signal is rec
Wave Wolf MT4
Andrei Salanevich
Forex Dalga Kurt MT4 göstergesi, Wolf dalgalarını aramak ve mevcut ticaret terminali penceresinde görüntülemek için tasarlanmıştır. Ticarette Wolfe dalgalarını kullanan tüccarlar için mükemmel bir gösterge. Ticaret stratejilerinde kullanımı, verimliliğini ve karlılığını önemli ölçüde artıracaktır. GÖSTERGE BİLGİSİ Diğer Wolf dalga göstergelerinin aksine, forex Wave Wold MT4 göstergesinin etkinliğini önemli ölçüde artıran birçok özelliği vardır: Birincisi, Açık Windows 5Point (true) ayarı bilg
Noize Absorption Index MT4
Ekaterina Saltykova
5 (1)
Noize Absorption Index - is the manual trading system that measures the difference of pressure between bears forces and bulls forces. Green line - is a noize free index that showing curent situation. Zero value of index shows totally choppy/flat market.Values above zero level shows how powerfull bullish wave is and values below zero measures bearish forces.Up arrow appears on bearish market when it's ready to reverse, dn arrow appears on weak bullish market, as a result of reverse expectation. S
We present you the indicator "Candle closing counter", which will become your indispensable assistant in the world of trading. That’s why knowing when the candle will close can help: If you like to trade using candle patterns, you will know when the candle will be closed. This indicator will allow you to check if a known pattern has formed and if there is a possibility of trading. The indicator will help you to prepare for market opening and market closure. You can set a timer to create a pre
You can avoid constant monitoring of computer screen waiting for the DeMarker signal while receiving push notifications to a mobile terminal or a sound alert on the screen about all required events, by using this indicator - DeMarker Alerts. In fact, it is the replacement of the standard indicator with which you will never miss the oscillator signals. If you don't know the benefits of DeMarker or how to use it, please read here . If you need signals of a more popular RSI indicator, use RSI Alert
This indicator is based on the MACD on one or more timeframes and on any Currency Cross Pair. The indicator generates an alert message when it detects a buy or sell signal. It also draws a vertical bar on the price chart: green for buy or red for sell, yellow if flat. Alert messages and Vertical bars for BUY or SELL, are generated when the MACD is consistent for all chosen timeframes else a FLAT signal is generated. Features Easy flexible settings: Detection of the MACD signal for one or more t
Color Stochastic Enhanced Stochastic Oscillator with Cross Detection and Visual Signal Support Overview Color Stochastic is a customized version of the classic Stochastic Oscillator designed for momentum analysis and crossover visualization. The indicator provides color-based signal marking and configurable crossover detection at user-defined overbought and oversold levels. It can be used as part of: Momentum analysis Mean reversion workflows DCA-based strategies Multi-indicator confirmation sys
Wolfe Wave Scanner MT4
Reza Aghajanpour
4.64 (11)
**  All Symbols  x  All Timeframes  scan just by pressing scanner button ** *** Contact me  to send you instruction and add you in "Wolfe Wave Scanner group" for sharing or seeing experiences with other users. Introduction: A Wolfe Wave is created with five-wave patterns in price. It shows supply and demand and a fight towards a balance price. T hese waves of price actions can help traders identify the boundaries of   the trend . Also  It helps forecast how the price will move in the near future
Forex Gump
Andrey Kozak
2.4 (5)
Forex Gump is a fully finished semi-automatic trading system. In the form of arrows, signals are displayed on the screen for opening and closing deals. All you need is to follow the instructions of the indicator. When the indicator shows a blue arrow, you need to open a buy order. When the indicator shows a red arrow, you need to open a sell order. Close orders when the indicator draws a yellow cross. In order to get the most effective result, we recommend using the timeframes H1, H4, D1. There
The indicator displays the data of the Stochastic oscillator from a higher timeframe on the chart. The main and signal lines are displayed in a separate window. The stepped response is not smoothed. The indicator is useful for practicing "manual" forex trading strategies, which use the data from several screens with different timeframes of a single symbol. The indicator uses the settings that are identical to the standard ones, and a drop-down list for selecting the timeframe. Indicator Paramet
MACDivergence MTF
Pavel Zamoshnikov
4.29 (7)
Advanced ideas of the popular MACD indicator: It detects and displays classic and reverse divergences (three methods of detecting divergences). It uses different color to highlight an uptrend and a downtrend. Two methods of determining a trend: а) MACD crosses the 0 level (classic signal); б) MACD crosses its own average (early signal). This is a multi-timeframe indicator: it can display MACD data from other timeframes. Two methods of drawing: classic histogram and line. It generates sound and v
Bu, bir mumun kapanış fiyatını tahmin eden bir göstergedir. Gösterge öncelikle D1 çizelgelerinde kullanılmak üzere tasarlanmıştır. Bu gösterge hem geleneksel forex ticareti hem de ikili opsiyon ticareti için uygundur. Gösterge, bağımsız bir ticaret sistemi olarak kullanılabilir veya mevcut ticaret sisteminize ek olarak hareket edebilir. Bu gösterge, mevcut mumu analiz ederek mumun gövdesi içindeki belirli güç faktörlerini ve önceki mumun parametrelerini hesaplar. Böylece gösterge, piyasa hareket
Wise Men Indicator demo
Bohdan Kasyanenko
3 (2)
The indicator displays signals according to the strategy of Bill Williams on the chart. Demo version of the indicator has the same features as the paid, except that it can work only on a demo account . Signal "First Wise Man" is formed when there is a divergent bar with angulation.  Bullish divergent bar - with lower minimum and closing price in the upper half. Bearish divergent bar - higher maximum and the closing price at the bottom half. Angulation is formed when all three lines of Alligator
FREE
EZZ Elite Zig Zag is an indicator for the MetaTrader 4 terminal. This indicator traces the peak of the trend based on the market reversal, thus showing various opportunities in the financial market. EZZ Elite Zig Zag is a visual tool, intuitive, and easy to understand and use.  Test it Yourself by Downloading it for Free. Author Paulo Rocha all rights reserved
Chart Patterns Detect 15 patterns (Ascending Triangle, Descending Triangle, Rising Wedge, Falling Wedge, Bullish Flag, Bearish Flag, Bullish Rectangle, Bearish Rectangle Symmetrical triangle, Head and Shoulders, Inverted Head and Shoulders, Triple top, Triple Bottom, Double Top, Double Bottom) Use historical data to calculate the probability of each pattern to succeed (possibility to filter notification according to the chance of success) gives graphic indication about the invalidation level and
Trend Osilatörü - gelişmiş bir özel Crypto_Forex göstergesi, etkili bir ticaret aracıdır! - Gelişmiş yeni hesaplama yöntemi kullanılır - "Hesaplama için fiyat" parametresi için 20 seçenek. - Şimdiye kadar geliştirilen en akıcı osilatör. - Yükselen trendler için yeşil renk, düşen trendler için kırmızı renk. - Aşırı satım değerleri: 5'in altında, Aşırı alım değerleri: 95'in üzerinde. - Bu göstergeyle standart stratejileri bile yükseltmek için birçok fırsat vardır. - PC ve Mobil uyarılarla. Yüksek
PABT Pattern Indicator - it's classical system one of the signal patterns. Indicator logic - the Hi & Lo of the bar is fully within the range of the preceding bar, look to trade them as pullback in trend. In the way if indicator found PABT pattern it's drawing two lines and arrow what showing trend way.  - First line - it's entry point and drawing at: 1. On the high of signal bar or on middle of the signal bar (depending from indicator mode) for buy; 2. On the low of signal bar or on middle of t
"Auto FIBO Pro" Crypto_Forex göstergesi - ticarette harika bir yardımcı araçtır! - Gösterge, Fibo seviyelerini ve yerel trend çizgilerini (kırmızı renk) otomatik olarak hesaplar ve grafikte yerleştirir. - Fibonacci seviyeleri, fiyatın tersine dönebileceği önemli alanları gösterir. - En önemli seviyeler %23,6, %38,2, %50 ve %61,8'dir. - Ters scalping veya bölge ızgara ticareti için kullanabilirsiniz. - Auto FIBO Pro göstergesini kullanarak mevcut sisteminizi geliştirmek için birçok fırsat vardır
[ZhiBiCCI] indicators are suitable for all cycle use, and are also suitable for all market varieties. [ZhiBiCCI] Green solid line is a reversal of bullish divergence. The green dotted line is a classic bullish divergence. [ZhiBiCCI] The solid line to the red is a reverse bearish divergence. The red dotted line is a classical bearish divergence. [ZhiBiCCI] can be set in the parameters (Alert, Send mail, Send notification), set to (true) to send instant signals to the alarm window, email, insta
This indicator is the undisputed leader among the indicators. And for this statement there is a good reason. The indicator builds a very high quality channel in which it generates signals to enter! What is the ideal strategy for the trader, since the trader always hesitates when choosing a strategy for the job. That is, this indicator will allow you to solve the dilemma of choosing a job by trend or to the channel, since it combines these two basic concepts. Working with the indicator is very
SuperTrend V
Muhammad Hassaan
*This is TradingView indicator converted to mql4* The SuperTrend V indicator is a popular technical analysis tool used to identify trends and potential trend reversals in financial markets. It is based on the concept of the SuperTrend indicator but incorporates additional features and variations. The SuperTrend V indicator uses a combination of price action and volatility to determine the trend direction and generate trading signals. Here are the key components and features of the indicator: Ca
Market Structure Zig Zag
Lesedi Oliver Seilane
4.66 (29)
Free Market structure zig zag to assist in price action trading the screenshots describe how to use and how to spot patterns new version comes with alerts, email alert and  push notification alert can be used on all pairs  can be used on all timeframes  you can add additional confirmation indicators the indicator shows you your higher high and low highs as well as your lower lows and lower highs  the indication makes price action analysis easier to spot.
FREE
The Th3Eng PipFinite indicator is based on a very excellent analysis of the right trend direction with perfect custom algorithms. It show the true direction and the best point to start trading. With StopLoss point and Three Take Profit points. Also it show the right pivot of the price and small points to order to replace the dynamic support and resistance channel, Which surrounds the price. And Finally it draws a very helpful Box on the left side on the chart includes (take profits and Stop loss
Crypto_Forex Göstergesi MT4 için "Sabah Yıldızı deseni". - "Sabah Yıldızı deseni" göstergesi Fiyat Hareketi ticareti için çok güçlü bir göstergedir: Yeniden boyama yok, gecikme yok. - Gösterge grafikte boğa Sabah Yıldızı desenlerini algılar: Grafikte mavi ok sinyali (resimlere bakın). - PC, Mobil ve E-posta uyarılarıyla. - Ayrıca kardeşi - ayı "Akşam Yıldızı deseni" göstergesi mevcuttur (aşağıdaki bağlantıyı takip edin). - "Sabah Yıldızı deseni" göstergesi Destek/Direnç Seviyeleriyle birleştir
FXC iMACD-DivergencE MT4 Indicator This is an advanced MACD indicator that finds trend-turn divergences on the current symbol. The indicator detects divergence between the MACD and the price movements as a strong trend-turn pattern. Main features: Advanced divergence settings Price based on Close, Open or High/Low prices Give Buy/Sell open signals PUSH notifications E-mail sending Pop-up alert Customizeable Information panel Input parameters: MACD Fast-EMA: The Fast-EMA variable of the MACD indi
Introduction It is common practice for professional trades to hide their stop loss / take profit from their brokers. Either from keeping their strategy to the themselves or from the fear that their broker works against them. Using this indicator, the stop loss / take profit points will be drawn on the product chart using the bid price. So, you can see exactly when the price is hit and close it manually.  Usage Once attached to the chart, the indicator scans the open orders to attach lines for t
The   Trend Duration Forecast MT4   indicator is designed to estimate the probable lifespan of a bullish or bearish trend. Using a Hull Moving Average (HMA) to detect directional shifts, it tracks the duration of each historical trend and calculates an average to forecast how long the current trend is statistically likely to continue. This allows traders to visualize both real-time trend strength and potential exhaustion zones with exceptional clarity. KEY FEATURES Dynamic Trend Detection:   Uti
Trade with Gann on your side!! MASTER CIRCLE 360 CIRCLE CHART, originally created by Gann admitted that this is “The Mother of all charts”. It is one of the last studies that this great trader left for us. The numeric tab le is apparently quite simple like all the tables and is based on square numbers, the SQUARE OF 12 and is by evolution, one of the most important square numbers. Here we can find CYCLE, PRICE AND TIME thanks to angles and grades, to show past and future support and resistance.
FXC iDeM-DivergencE MT4 Indicator This is an advanced DeMarker indicator that finds trend-turn divergences on the current symbol. The indicator detects divergence between the DeMarker and the price movements as a strong trend-turn pattern. Main features: Advanced divergence settings Price based on Close, Open or High/Low prices Give Buy/Sell open signals PUSH notifications E-mail sending Pop-up alert Customizeable Information panel Input parameters: DeM Period: The Period size of the DeMarker in
Bu ürünün alıcıları ayrıca şunları da satın alıyor
Neuro Poseidon MT4
Daria Rezueva
4.95 (21)
Neuro Poseidon is a new indicator by Daria Rezueva. It combines precise trading signals with adaptive TP/SL levels - creating best possible trades as a result! Message me and get  Neuro Poseidon Assistant  as a gift to automize your trading process! What makes it stand out? 1. Proven profitability on all assets and timeframes 2. Only confirmed BUY and SELL signals present on the chart 3. Adaptive TP & SL levels generated by the software for each trade 4. Easy to understand - suitable for all
Scalper Inside PRO
Alexey Minkov
4.74 (68)
Scalper Inside PRO Scalper Inside PRO is an intraday trend and scalping indicator for MetaTrader 4 that uses an exclusive algorithm to quickly detect market direction and key target levels. It automatically calculates entry, exit and multiple profit targets, and shows detailed performance statistics so you can see how different instruments and strategies performed. This helps you choose the most suitable trading instruments for the current market conditions. Additionally, you can easily integrat
M1 Sniper
Oleg Rodin
5 (23)
M1 SNIPER kullanımı kolay bir işlem göstergesi sistemidir. M1 zaman dilimi için tasarlanmış bir ok göstergesidir. Gösterge, M1 zaman diliminde scalping için bağımsız bir sistem olarak kullanılabilir ve mevcut işlem sisteminizin bir parçası olarak kullanılabilir. Bu işlem sistemi özellikle M1'de işlem yapmak için tasarlanmış olsa da, diğer zaman dilimleriyle de kullanılabilir. Başlangıçta bu yöntemi XAUUSD ve BTCUSD ticareti için tasarladım. Ancak bu yöntemi diğer piyasalarda işlem yaparken de ya
Gann Made Easy
Oleg Rodin
4.84 (164)
Gann Made Easy , bay teorisini kullanarak ticaretin en iyi ilkelerine dayanan, profesyonel ve kullanımı kolay bir Forex ticaret sistemidir. WD Gann. Gösterge, Zararı Durdur ve Kâr Al Seviyeleri dahil olmak üzere doğru SATIN AL ve SAT sinyalleri sağlar. PUSH bildirimlerini kullanarak hareket halindeyken bile işlem yapabilirsiniz. Satın alma işleminden sonra, alım satım talimatlarını ve harika ek göstergeleri ücretsiz olarak almak için lütfen benimle iletişime geçin! Muhtemelen Gann ticaret yöntem
PRO Renko Sistemi, RENKO grafikleri ticareti için özel olarak tasarlanmış son derece hassas bir ticaret sistemidir. Bu, çeşitli ticaret araçlarına uygulanabilen evrensel bir sistemdir. Sistemi etkin piyasa sana doğru ters sinyallerine erişim hakkı denilen ses nötralize eder. Göstergenin kullanımı çok kolaydır ve sinyal üretiminden sorumlu tek bir parametreye sahiptir. Aracı, seçtiğiniz herhangi bir ticaret aracına ve renko çubuğunun boyutuna kolayca uyarlayabilirsiniz. Yazılımımla karlı bir
Trend Catcher ind
Ramil Minniakhmetov
5 (1)
TREND YAKALAYICI GÖSTERGE Trend Yakalayıcı Gösterge, yazarın tescilli ve özelleştirilmiş uyarlanabilir trend analiz göstergelerinin bir kombinasyonunu kullanarak piyasa fiyat hareketlerini analiz eder. Kısa vadeli gürültüyü filtreleyerek ve temel momentum gücüne, volatilite genişlemesine ve fiyat yapısı davranışına odaklanarak gerçek piyasa yönünü belirler. Ayrıca, hareketli ortalamalar, RSI ve volatilite filtreleri gibi yumuşatma ve trend filtreleme özelleştirilmiş göstergelerinin bir kombina
Trend Lines PRO
Roman Podpora
5 (1)
TREND ÇİZGİLERİ PRO     Piyasanın gerçek yön değişimini anlamaya yardımcı olur. Gösterge, gerçek trend dönüşlerini ve büyük oyuncuların piyasaya yeniden girdiği noktaları gösterir. Anlıyorsun     BOS hatları  Daha yüksek zaman dilimlerindeki trend değişiklikleri ve önemli seviyeler, karmaşık ayarlar veya gereksiz gürültü olmadan gösterilir. Sinyaller yeniden çizilmez ve çubuk kapandıktan sonra grafikte kalır. VERSION MT 5     -    RFI LEVELS PRO  göstergesiyle birlikte kullanıldığında maksimum p
Enigmera
Ivan Stefanov
5 (8)
ENIGMERA: Pazarın Kalbi Önemli: MQL5.com demosu Strategy Tester'da çalışır ve Enigmera'nın tüm işlevlerini tam olarak yansıtmayabilir. Daha fazla bilgi için açıklamayı, ekran görüntülerini ve videoyu kontrol edin. Herhangi bir sorunuz varsa, bana mesaj göndermekten çekinmeyin! Göstergenin kodu tamamen yeniden yazılmıştır. 3.0 sürümü, yeni işlevler ekler ve göstergenin başlangıcından bu yana biriken hataları giderir. Giriş Bu gösterge ve ticaret sistemi, finansal piyasalara dikkat çekici bir ya
Dynamic Forex28 Navigator
Bernhard Schweigert
4.43 (7)
Dynamic Forex28 Navigator - Yeni Nesil Forex Ticaret Aracı. ŞU ANDA %49 İNDİRİM. Dynamic Forex28 Navigator, uzun zamandır popüler olan göstergelerimizin evrimidir ve üçünün gücünü tek bir göstergede birleştirir: Gelişmiş Döviz Gücü28 Göstergesi (695 inceleme) + Gelişmiş Döviz İMPULS ve UYARI (520 inceleme) + CS28 Kombo Sinyalleri (Bonus). Gösterge hakkında ayrıntılar https://www.mql5.com/en/blogs/post/758844 Yeni Nesil Güç Göstergesi Ne Sunuyor?  Orijinallerde sevdiğiniz her şey, şimdi yeni
Bu gösterge, pratik ticaret için mükemmel olan otomatik dalga analizine yönelik bir göstergedir! Dava... Not:   Dalga sınıflandırması için Batılı isimleri kullanmaya alışkın değilim. Tang Lun'un (Tang Zhong Shuo Zen) adlandırma kuralının etkisiyle, temel dalgayı   kalem   , ikincil dalga bandını ise   segment   olarak adlandırdım. aynı zamanda segmentin trend yönü vardır. Adlandırma   esas olarak trend segmentidir   (bu adlandırma yöntemi gelecekteki notlarda kullanılacaktır, öncelikle söyleyey
RFI levels PRO
Roman Podpora
5 (1)
Bu gösterge, fiyat dönüş noktalarını ve fiyat geri dönüş bölgelerini doğru bir şekilde gösterir.       Başlıca oyuncular   . Yeni trendlerin nerede oluştuğunu görüyorsunuz ve her işlem üzerinde kontrolü elinizde tutarak, azami hassasiyetle kararlar alıyorsunuz. TREND LINES PRO   göstergesiyle birlikte kullanıldığında maksimum potansiyelini ortaya koyar.  VERSION MT5 Göstergenin gösterdiği şey: Yeni bir trendin başlangıcında aktivasyonla birlikte tersine dönüş yapıları ve tersine dönüş seviyeler
Genesis Matrix Pro is a professional multi-timeframe trend detection indicator designed to help traders identify high-quality market alignment with clarity and structure. It combines 12 different technical indicators into one visual alignment matrix, allowing traders to quickly see when market conditions are bullish, bearish, or neutral. A signal is generated only when the selected strategies are aligned, helping reduce noise and improve decision-making. PLEASE CONTACT ME AFTER PURCHASE TO GET
Bu ürün 2026 piyasası için güncellendi ve en son MT5 sürümleri için optimize edildi. FİYAT GÜNCELLEME BİLDİRİMİ: Smart Trend Trading System şu anda $99 fiyatıyla sunulmaktadır. Sonraki 30 satın alma işleminden sonra fiyat $199 olacaktır. ÖZEL TEKLİF: Smart Trend Trading System satın aldıktan sonra bana özel mesaj gönderin, Smart Universal EA’yı ÜCRETSİZ olarak alın ve Smart Trend sinyallerinizi otomatik işlemlere dönüştürün. Smart Trend Trading System, daha temiz sinyaller, daha iyi trend yönü
MTF Supply Demand Zones
Georgios Kalomoiropoulos
4.82 (22)
Yeni Nesil Otomatik Arz ve Talep Bölgeleri. Her Grafikte Çalışan Yeni ve Yenilikçi Algoritma. Tüm Bölgeler Piyasanın Fiyat Hareketine Göre Dinamik Olarak Oluşturulmaktadır. İKİ TÜR UYARI --> 1) FİYAT BİR BÖLGEYE ÇIKTIĞINDA 2) YENİ BİR BÖLGE OLUŞTURDUĞUNDA Bir tane daha işe yaramaz gösterge almazsın. Kanıtlanmış Sonuçlarla eksiksiz bir Ticaret Stratejisi elde edersiniz.     Yeni özellikler:     Fiyat Arz/Talep Bölgesine ulaştığında uyarılar     Yeni bir Arz/Talep Bölgesi oluşturulduğunda
PZ Trend Trading
PZ TRADING SLU
4.8 (5)
Capture every opportunity: your go-to indicator for profitable trend trading Trend Trading is an indicator designed to profit as much as possible from trends taking place in the market, by timing pullbacks and breakouts. It finds trading opportunities by analyzing what the price is doing during established trends. [ Installation Guide | Update Guide | Troubleshooting | FAQ | All Products ] Trade financial markets with confidence and efficiency Profit from established trends without getting whips
Step into the world of Forex trading with confidence, clarity, and precision using   Gold Indicator   a next-generation tool engineered to take your trading performance to the next level. Whether you’re a seasoned professional or just beginning your journey in the currency markets, Gold Indicator equips you with powerful insights and help you trade smarter, not harder. Built on the proven synergy of three advanced indicators, Gold Indicator focuses exclusively on medium and long-term trends eli
MetaBands M4
Vahidreza Heidar Gholami
3.5 (6)
MetaBands uses powerful and unique algorithms to draw channels and detect trends so that it can provide traders with potential points for entering and exiting trades. It’s a channel indicator plus a powerful trend indicator. It includes different types of channels which can be merged to create new channels simply by using the input parameters. MetaBands uses all types of alerts to notify users about market events. Features Supports most of the channel algorithms Powerful trend detection algorith
M30/H1/H4 Swing versiyonu mevcut Büyük hareketleri yakalamak mı istiyorsunuz? Gold Signal Swing Pro (M30/H1/H4). Hedef: işlem başına $20-$80+. https://www.mql5.com/en/market/product/177643 KURAMA GOLD SIGNAL PRO (MT4) — 7 Katmanlı Filtre, Otomatik TP/SL ve Kalite Puanı ile Komple XAUUSD Trading Sistemi REPAINT YOK. YENİDEN ÇİZİM YOK. GECİKME YOK. Her sinyal kalıcıdır. Gördüğün, aldığındır. BONUS: Ömür boyu lisansı al ve AI Zone Radar ($59 değerinde)
Current event:  https://c.mql5.com/1/326/A2SR2025_NoMusic.gif A. A2SR nedir ?   * Önde gelen bir teknik göstergedir (yeniden boyama yok, gecikme yok). -- Rehberlik : -- https://www.mql5.com/en/blogs/post/734748/page4#comment_16532516 adresinde -- ve https://www.mql5.com/en/users/yohana/blog A2SR, Destek (talep) ve Direnç (arz) seviyelerini belirlemede özel bir tekniğe sahiptir. İnternette gördüğümüz sıradan yoldan farklı olarak A2SR, gerçek SR seviyelerini belirlemede özgün bir konsepte sahi
BTMM State Engine Pro is a MetaTrader 4 indicator for traders who use the Beat The Market Maker approach: Asian session context, kill zone timing, level progression, peak formation detection, and a multi-pair scanner from a single chart. It combines cycle state logic with a built-in scanner dashboard so you do not need the same tool on many charts at once. What it does Draws the Asian session range; session times can follow broker server offset or be set in inputs. Tracks level progression (L
Price & Time Market Structure Indicator A professional market structure tool that analyzes waves through both price and time — not price alone. Main Description NeoWave PRO is a professional market structure indicator for MetaTrader 4 designed for traders who want to move beyond traditional one-dimensional wave tools such as ZigZag, swing indicators, and basic high/low systems. Most wave indicators analyze only one thing: Price. But a real market wave is not only a price movement. A true wave de
Quant Direction
Georgios Kalomoiropoulos
Quant Direction, 3 boyutlu bir piyasa analiz aracıdır. Çeşitli parametrelerdeki yüzdesel sapmaları hassas bir şekilde hesaplayan, tamamen objektif, algoritma tabanlı piyasa analizi sunar. Gelişmiş yapay zeka tabanlı modelleme araçları kullanılarak geliştirilen ve titizlikle test edilen bu algoritma, piyasayı benzersiz bir hassasiyetle analiz eder. Platformda herhangi bir döviz çiftini veya finansal enstrümanı analiz edebilirsiniz. İster kısa vadeli, ister günlük, isterse swing trading yapın, Qua
MonsterDash Harmonic Indicator is a harmonic pattern dashboard. It recognizes all major patterns. MonsterDash is a dashboard that displays all detected patterns for all symbols and (almost) all timeframes in sortable and scrollable format. Users can add their own user defined patterns . MonsterDash can open and update charts with the pattern found. Settings MonsterDash's default settings are good enough most of the time. Feel free to fine tune them to your needs. The color settings are for thos
NAM Order Blocks
NAM TECH GROUP, CORP.
3.67 (3)
MT4 Multi-timeframe Order Blocks detection indicator. Features - Fully customizable on chart control panel, provides complete interaction. - Hide and show control panel wherever you want. - Detect OBs on multiple timeframes. - Select OBs quantity to display. - Different OBs user interface. - Different filters on OBs. - OB proximity alert. - ADR High and Low lines. - Notification service (Screen alerts | Push notifications). Summary Order block is a market behavior that indicates order collection
Apollo SR Master , Destek/Direnç bölgelerinde alım satımı daha kolay ve güvenilir hale getiren özelliklere sahip bir Destek/Direnç göstergesidir. Gösterge, yerel fiyat zirvelerini ve diplerini tespit ederek Destek/Direnç bölgelerini herhangi bir gecikme olmadan gerçek zamanlı olarak hesaplar. Ardından, yeni oluşan Destek/Direnç bölgesini doğrulamak için, Destek/Direnç bölgesinin dikkate alınabileceğini ve gerçek bir SAT veya AL sinyali olarak kullanılabileceğini gösteren özel bir sinyal gösterir
PowerBall Signals, destek/direnç bölgelerini kullanma fikrine dayanan bir AL/SAT sinyal göstergesidir. Gösterge, destek/direnç bölgelerine dayalı özel dönüş modellerini tespit eder ve bu sinyalleri grafiğinize sunar. Göstergenin ana fikri MTF (Çoklu Zaman Çerçevesi) analizini kullanmak ve mevcut ve bir sonraki daha yüksek zaman dilimindeki seviyelere göre sinyaller sağlamaktır. Bu yöntem, para birimleri, metaller, endeksler ve hatta kripto para birimleri olsun, herhangi bir pazardaki olası fiyat
Auto Optimized Parabolic RSI: Gelişmiş 3D Momentum Motoru Çoğu perakende indikatörü, piyasa volatilitesi değiştiği an çöken statik girdilere dayandığı için başarısız olur. Auto Optimized Parabolic RSI, kendi matematiksel avantajını sürekli olarak yeniden hesaplayarak "indikatör körelmesi" (indicator decay) sorununu çözer ve kurumsal düzeyde kantitatif adaptasyonu doğrudan MT5 terminalinize getirir. Temel Avantaj: Özel Bellek İçi (In-Memory) 3D Optimizasyon   Standart otomatik optimize ediciler,
GoldRush Trend Ok Sinyali GoldRush Trend Ok Sinyali göstergesi, XAU/USD'de yüksek hızlı, kısa vadeli scalperlar için özel olarak tasarlanmış hassas, gerçek zamanlı trend analizi sağlar. 1 dakikalık zaman dilimi için özel olarak tasarlanan bu araç, net giriş noktaları için yön okları gösterir ve scalper'ların değişken piyasa koşullarında güvenle hareket etmelerini sağlar. Gösterge, PRIMARY ve SECONDARY uyarı oklarından oluşur. PRIMARY sinyalleri, trend yönündeki değişikliği gösteren Beyaz ve
PZ 123 Pattern
PZ TRADING SLU
1 (1)
Unlock powerful breakout opportunities The 123 Pattern is one of the most popular, powerful and flexible chart patterns. The pattern is made up of three price points: a bottom, a peak or valley, and a Fibonacci retracement between 38.2% and 71.8%. A pattern is considered valid when the price breaks beyond the last peak or valley, moment at which the indicator plots an arrow, rises an alert, and the trade can be placed. [ Installation Guide | Update Guide | Troubleshooting | FAQ | All Products  ]
Bull versus Bear
Mohamed Hassan
4.5 (18)
Send us a message after your purchase to receive more information on how to get your  BONUS  for FREE  that works in great combination with Bull vs Bear ! Bull versus Bear is an easy-to-use Forex indicator that gives traders clear and accurate signals based on clear trend retests . Forget about lagging indicators or staring at charts for hours because  Bull vs Bear provides real-time entries with no lag and no repaint, so you can trade with confidence. Bull vs Bear  helps you enter trades during
Yazarın diğer ürünleri
ZigZag Lines MTF
Taras Slobodyanik
4.38 (13)
Çoklu zaman dilimi ZigZag göstergesi. Destek/direnç yatay çizgilerini ve bunların kırılmalarını gösterir, ayrıca piyasanın mevcut hedeflerini de çizer. Ayrıca Fraktallar göstergesinin çizgilerini ve diğer dönemlere ait mumları da görüntüleyebilir (Üç Aylığa kadar). Gösterge – Trend çizgilerini göstermek için önemli dip ve tepe noktalarını birbirine bağlar. Gösterge son (geçerli) noktayı yeniden çizer ve bazı durumlarda son 2-3 noktayı değiştirebilir. Tüm çizgiler nesneler olarak çizilir ( gös
Time Scale for MT5
Taras Slobodyanik
4.77 (30)
The indicator draws the time scale on the chart. You can specify the time offset, adjust the size and font to display on the chart ( it is displaying your local time on your chart instead of MT time ). You can also select the desired format for displaying the date and time. You may be interested in my other product , which contains a more advanced version of the Time Scale . You can also find my other products here Parameters Hours (time shift) — time shift (hours); Minutes (time shift) — time
FREE
Çoklu para birimi ve çoklu zaman çerçeveli Heikin Ashi göstergesi. Piyasanın mevcut durumunu gösterir. Tarayıcı panelinde mevcut trendin yönünü, gücünü ve çubuk sayısını görebilirsiniz. Konsolidasyon/Tersine Dönme mumları da renk kullanılarak gösterilir. Parametrelerde istediğiniz para birimini ve periyodu belirtebilirsiniz. Ayrıca gösterge, trend değiştiğinde veya tersine dönüş ve konsolidasyon mumları (dojiler) göründüğünde bildirim gönderebilir. Bir hücreye tıkladığınızda bu simge ve nokta a
ZigZag göstergesinin çoklu para birimi ve çoklu zaman çerçevesi modifikasyonu. Piyasanın mevcut yönünü, son hareketin yüksekliğini, bu hareketteki çubuk sayısını ve ZigZag'ın önceki noktasının (yatay çizgi) kırılmasını görüntüler. Bu MTF Tarayıcıdır. Parametrelerde istediğiniz para birimini ve zaman dilimlerini belirtebilirsiniz. Ayrıca panel, ZigZag yön değiştirdiğinde veya önceki noktada bir ilerleme olduğunda bildirim gönderebilir. Noktalı bir hücreye tıkladığınızda bu sembol ve nokta açıla
ZigZag Lines MTF for MT5
Taras Slobodyanik
5 (11)
Çoklu zaman dilimi ZigZag göstergesi. Destek/direnç yatay çizgilerini ve bunların kırılmalarını gösterir, ayrıca piyasanın mevcut hedeflerini de çizer. Ayrıca Fraktallar göstergesinin çizgilerini ve diğer dönemlere ait mumları da görüntüleyebilir (Üç Aylığa kadar). Gösterge – Trend çizgilerini göstermek için önemli dip ve tepe noktalarını birbirine bağlar. Gösterge son (geçerli) noktayı yeniden çizer ve bazı durumlarda son 2-3 noktayı değiştirebilir. Tüm çizgiler nesneler olarak çizilir ( gös
Lines Profit Loss MT5
Taras Slobodyanik
4.62 (13)
Gösterge mevcut sembol üzerinde kârı (zararı) gösterir. Mevcut kar veya zararı görüntülemek için çizgiyi serbestçe sürükleyip bırakabilirsiniz. You can find my products   here Parametreler Calculation in money or in points — kar/zararı puan veya para cinsinden hesaplayın. Add pending orders to calculate — hesaplamalarda bekleyen siparişleri dikkate alın. Magic Number (0 - all orders on symbol) — belirli sıraları değerlendirmek gerekiyorsa sihirli sayı. Offset for first drawing (points from t
FREE
Göstergenin üç ana aracı vardır: Büyüteç (Yakınlaştırma grafiği), Cetvel (Zaman ve Fiyat ölçekleri) ve Artı İşareti. Farenizle her yeri hareket ettirebilir ve farklı görüntüleme formatlarını özelleştirebilir, her öğenin boyutunu ve rengini özelleştirebilirsiniz. Büyüteç   (yakınlaştırma tablosu), mumları herhangi bir zaman diliminde ve farklı ölçeklerde görüntülemenizi sağlar. Varsayılan kısayol tuşları: 'Q' - daha yüksek zaman aralığı, 'A' - daha düşük zaman aralığı, 'W' - mum boyutunu azalt,
CCI Dashboard for MT5
Taras Slobodyanik
5 (1)
Emtia Kanalı Endeksi (CCI) göstergesinin çok para birimi ve çok zaman çerçeveli modifikasyonu. Parametrelerde istediğiniz para birimini ve zaman dilimlerini belirtebilirsiniz. Ayrıca panel aşırı alım ve aşırı satım seviyelerini geçerken bildirim gönderebilir. Noktalı bir hücreye tıkladığınızda bu sembol ve nokta açılacaktır. Bu MTF Tarayıcıdır. Kontrol panelini grafikten gizlemenin anahtarı varsayılan olarak "D"dir Parametreler CCI Period — ortalama dönem. CCI Applied price — fiyat türü. Cl
MA Dashboard MT5
Taras Slobodyanik
5 (4)
Hareketli Ortalama (MA) göstergesinin çok para birimi ve çok zaman çerçeveli modifikasyonu. Kontrol panelinde göstergenin mevcut durumunu görebilirsiniz - Hızlı MA ve Yavaş MA'nın kırılmaları ve dokunuşları (fiyata göre) ve ayrıca MA çizgilerinin birbirleri arasındaki kesişimi (hareketli ortalama geçiş). Parametrelerde istediğiniz para birimini ve zaman dilimlerini belirleyebilirsiniz. Ayrıca gösterge, fiyatın çizgilere temas etmesi ve geçişleri hakkında bildirimler gönderebilir. Noktalı bir hü
Symbol Manager or Grid Manager, designed to group orders into one position (by Symbol or by Magic Number). This utility will be useful to multi-currency traders (many EAs), who can have multiple orders on several pairs. You will be able to see the total number of lots, the total profit, and set virtual stop loss and virtual take profit. To set a real TP (or SL), you must first set the virtual value, and then enter the command in this cell: "set". If you want to set real TP/SL for all orders at
Symbol Manager
Taras Slobodyanik
5 (4)
Symbol Manager or Grid Manager, designed to group orders into one position (by Symbol or by Magic Number). This utility will be useful to multi-currency traders (many EAs), who can have multiple orders on several pairs. You will be able to see the total number of lots, the total profit, and set virtual stop loss and virtual take profit. To set a real TP (or SL), you must first set the virtual value, and then enter the command in this cell: "set". If you want to set real TP/SL for all orders at
ADX Dashboard MT5
Taras Slobodyanik
5 (4)
ADX göstergesi trendi ve gücünü belirlemek için kullanılır. Fiyatın yönü +DI ve -DI değerleriyle, ADX değeri ise trendin gücünü gösterir. +DI -DI'nin üzerindeyse piyasa yükseliş trendindedir, tam tersi ise düşüş trendindedir. ADX 20'nin altında ise kesin bir yön yoktur. Gösterge bu seviyeyi kırdığı anda orta güçte bir trend başlıyor. 40'ın üzerindeki değerler güçlü bir trendi (düşüş trendi veya yükseliş trendi) gösterir. Ortalama Yönlü Hareket Endeksi (ADX) göstergesinin çoklu para birimi ve ç
Stokastik Osilatörün çoklu para birimi ve çoklu zaman çerçevesi modifikasyonu. Parametrelerde istediğiniz para birimini ve zaman dilimlerini belirtebilirsiniz. Panel, Sinyal ve Ana (stokastik geçiş) çizgilerinin mevcut değerlerini ve kesişimlerini görüntüler. Ayrıca gösterge aşırı alım ve aşırı satım seviyelerini geçerken bildirim gönderebilir. Noktalı bir hücreye tıkladığınızda bu sembol ve nokta açılacaktır. Bu MTF Tarayıcıdır. Para Birimi Gücü Ölçer'e benzer şekilde, Kontrol Paneli belirli b
Göreceli Güç Endeksi (RSI) göstergesinin çoklu para birimi ve çoklu zaman çerçeveli modifikasyonu. Parametrelerde istediğiniz para birimini ve zaman dilimlerini belirtebilirsiniz. Ayrıca panel aşırı alım ve aşırı satım seviyelerini geçerken bildirim gönderebilir. Noktalı bir hücreye tıkladığınızda bu sembol ve nokta açılacaktır. Bu MTF Tarayıcıdır. Kontrol panelini grafikten gizlemenin anahtarı varsayılan olarak "D"dir Para Birimi Gücü Ölçer'e benzer şekilde, Kontrol Paneli belirli bir para b
Lines Profit Loss
Taras Slobodyanik
4.65 (17)
Gösterge mevcut sembol üzerinde kârı (zararı) gösterir. Mevcut kar veya zararı görüntülemek için çizgiyi serbestçe sürükleyip bırakabilirsiniz. You can find my products   here Parametreler Calculation in money or in points — kar/zararı puan veya para cinsinden hesaplayın. Add pending orders to calculate — hesaplamalarda bekleyen siparişleri dikkate alın. Magic Number (0 - all orders on symbol) — belirli sıraları değerlendirmek gerekiyorsa sihirli sayı. Offset for first drawing (points from t
FREE
Pro Sessions MT4
Taras Slobodyanik
4.75 (4)
Bu, dört seans boyunca tüm seviyeleri (Açık-Yüksek-Düşük-Kapanış) görüntüleyebilen işlem seanslarının bir göstergesidir. Gösterge aynı zamanda oturum düzeylerini de tahmin edebilir. Oturumlar çizgiler veya dikdörtgenler (boş veya dolu) ile çizilebilir, çizgiler bir sonraki oturuma uzatılabilir. Kısayol tuşlarına (varsayılan olarak '1', '2', '3', '4') basarak her oturumu kolayca gizleyebilir/gösterebilirsiniz ASR (Ortalama Oturum Aralığı) satırlarını görebilirsiniz (varsayılan kısayol tuşu 'A')
Time Scale
Taras Slobodyanik
4.87 (15)
The indicator draws the time scale on the chart. You can specify the time offset, adjust the size and font to display on the chart (it is displaying your local time on your chart instead of MT time). You can also select the desired format for displaying the date and time. While holding down the middle mouse button, and moving the cursor, a slider will appear on the scale. You may be interested in my other product , which contains a more advanced version of the Time Scale. You can also find my o
FREE
Gösterge, ZigZag göstergesine, İşlem Seanslarına, Fraktallara veya Mumlara (standart olmayan zaman dilimleri dahil: Yıl, 6 Ay, 4 Ay, 3 Ay, 2 Ay) (Otomatik Fibo Geri Çekme) dayalı olarak Fibonacci seviyelerini otomatik olarak çizer. Fibonachi hesaplaması için daha yüksek bir zaman dilimini seçebilirsiniz. Mevcut çubuk her kapandığında seviyeler yeniden çizilir. Belirtilen seviyeleri geçerken uyarıları etkinleştirmek mümkündür. Ayrıca tarihteki seviyeleri de analiz edebilirsiniz. Bunun için "Geç
Çoklu para birimi ve çoklu zaman dilimi göstergesi Inside Bar (IB). Parametrelerde istediğiniz para birimini ve zaman dilimini belirtebilirsiniz. Panel, en son bulunan İç Çubuk (ve Ana Çubuk) formasyonunu, mevcut fiyat pozisyonunu ve Ana ve İç Çubuk seviyelerinin kırılmasını görüntüler. Hücrelerdeki çubukların ve metnin boyutunu ve rengini ayarlayabilirsiniz. Gösterge aynı zamanda seviyeler kırıldığında da bildirim gönderebiliyor. Noktalı bir hücreye tıkladığınızda belirtilen sembol ve nokta aç
Levels of Timeframes
Taras Slobodyanik
5 (2)
Gösterge, diğer (ve standart olmayan) zaman dilimlerindeki Yüksek/Düşük/Açık/Kapanış Seviyelerini gösterir - Yıl, 6 Ay, 4 Ay, 3 Ay, 2 Ay, Ay, Hafta, Gün, H3-H6-H8-H12 Saat . Ayrıca mumları açmak ve sanal mumlar oluşturmak için vardiyayı da ayarlayabilirsiniz. Bu zaman dilimlerinden biri için "Dönem ayırıcılar" dikey çizgiler biçiminde mevcuttur. Uyarılar, mevcut veya önceki seviyelerin kırılmaları (dün/geçen haftanın Yüksek/Düşük çizgisinin kırılması vb.) için yapılandırılabilir. Ayrıca tüm sev
Stokastik Osilatörün çoklu para birimi ve çoklu zaman çerçevesi modifikasyonu. Parametrelerde istediğiniz para birimini ve zaman dilimlerini belirtebilirsiniz. Panel, Sinyal ve Ana (stokastik geçiş) çizgilerinin mevcut değerlerini ve kesişimlerini görüntüler. Ayrıca gösterge aşırı alım ve aşırı satım seviyelerini geçerken bildirim gönderebilir. Noktalı bir hücreye tıkladığınızda bu sembol ve nokta açılacaktır. Bu MTF Tarayıcıdır. Para Birimi Gücü Ölçer'e benzer şekilde, Kontrol Paneli belirli b
Göstergenin üç ana aracı vardır: Büyüteç (Yakınlaştırma grafiği), Cetvel (Zaman ve Fiyat ölçekleri) ve Artı İşareti. Farenizle her yeri hareket ettirebilir ve farklı görüntüleme formatlarını özelleştirebilir, her öğenin boyutunu ve rengini özelleştirebilirsiniz. Büyüteç (yakınlaştırma tablosu), mumları herhangi bir zaman diliminde ve farklı ölçeklerde görüntülemenizi sağlar. Varsayılan kısayol tuşları: 'Q' - daha yüksek zaman aralığı, 'A' - daha düşük zaman aralığı, 'W' - mum boyutunu azalt, '
Gösterge, diğer (ve standart olmayan) zaman dilimlerindeki Yüksek/Düşük/Açık/Kapanış Seviyelerini gösterir - Yıl, 6 Ay, 4 Ay, 3 Ay, 2 Ay, Ay, Hafta, Gün, H3-H6-H8-H12 Saat . Ayrıca mumları açmak ve sanal mumlar oluşturmak için vardiyayı da ayarlayabilirsiniz. Bu zaman dilimlerinden biri için "Dönem ayırıcılar" dikey çizgiler biçiminde mevcuttur. Uyarılar, mevcut veya önceki seviyelerin kırılmaları (dün/geçen haftanın Yüksek/Düşük çizgisinin kırılması vb.) için yapılandırılabilir. Ayrıca tüm sev
Pro Sessions MT5
Taras Slobodyanik
5 (1)
Bu, dört seans boyunca tüm seviyeleri (Açık-Yüksek-Düşük-Kapanış) görüntüleyebilen işlem seanslarının bir göstergesidir. Gösterge aynı zamanda oturum düzeylerini de tahmin edebilir. Oturumlar çizgiler veya dikdörtgenler (boş veya dolu) ile çizilebilir, çizgiler bir sonraki oturuma uzatılabilir. Kısayol tuşlarına (varsayılan olarak '1', '2', '3', '4') basarak her oturumu kolayca gizleyebilir/gösterebilirsiniz ASR (Ortalama Oturum Aralığı)   satırlarını görebilirsiniz (varsayılan kısayol tuşu 'A
Multi-timeframe indicator Relative Strength Index displays information simultaneously from different periods in one subwindow of the chart. Parameters Period of averaging — averaging period for the RSI calculation. Type of price — price used. Timeframes for RSI — list of periods, separated by a space or comma or semicolon. Number of bars for each period — the number of bars displayed for each period. Sort periods — sort periods if they are listed in no particular order. Current period first — d
Stochastic Oscillator displays information simultaneously from different periods in one subwindow of the chart. Parameters %K Period — K-period (number of bars for calculations). %D Period — D-period (period of first smoothing). Slowing — final smoothing. Method — type of smoothing. Price field — stochastic calculation method . Timeframes for Stochastic — list of periods, separated by a space or comma or semicolon. Number of bars for each period — the number of bars displayed for each period. S
This is the famous FX Sniper's T3 CCI indicator. It is a fixed version additionally containing search for classical and reverse (hidden) divergence. The classical divergence is displayed as a solid line, the reverse divergence is shown as a dotted line. Divergences are drawn in the indicator and on the chart (if you select the appropriate options). Parameters CCI Period — Commodity Channel Index indicator period CCI Type of price — price used for indicator calculation T3 Period — Sniper period
The indicator calculates the inclination angle between the Highs, Lows and Closes of adjacent bars. The angle can be measured in degrees or radians. A linear graph or a histogram is drawn in a subwindow. You can set the scale for the calculation — floating or fixed. For use in Expert Advisors or indicators, you need to specify a fixed scale. Parameters Angular measure — degrees or radians. Scale mode for calculation — scaling mode. Free scale — free transformation, the indicator will calculate
FREE
Angle High Low
Taras Slobodyanik
The indicator calculates the angle between the Highs, Lows and Closes of neighboring bars. The angle can be measured in degrees or radians. A linear chart or a histogram is drawn in a subwindow. You can set the scale for the calculation — floating or fixed. For use in the EA, you need to specify a fixed scale. Parameters Angular measure — degrees or radians. Scale mode for calculation — scaling mode. Free scale — free transformation, the indicator will calculate values each time the chart scale
FREE
Filtrele:
MP_mpap
633
MP_mpap 2025.03.05 20:09 
 

3/5/2025:

It covers all MACD indicator signals with a very well-designed dashboard that is easy to use. The settings are extremely detailed. Excellent work! Bravo!

6/27/2025 :

I've been a trader for 15 years... The developer is simply incredible! There aren’t many words—just amazing results. I've purchased many of his products—each one better than the last. The support is fantastic.

If someone wants a serious “view” of the market, these are the ultimate tools!

A thousand thanks, Taras! Keep up the great work!

P.S. I run Taras’s products 24/7 on a VPS. Every tool he has created provides professional-grade insights.

Brinol1
22
Brinol1 2024.12.13 01:11 
 

Extremely well designed and coded indi, if you use the MACD for finding pullbacks and other trades you wont need anything else to keep an eye on all your instruments. Fantastic Indicator.

Değerlendirmeye yanıt