Gann Square of 144
- Göstergeler
- Sürüm: 3.20
- Güncellendi: 19 Temmuz 2026
- Etkinleştirmeler: 10

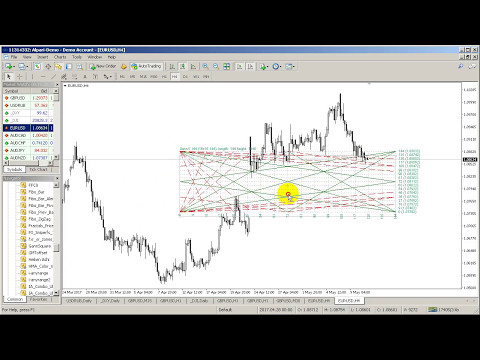
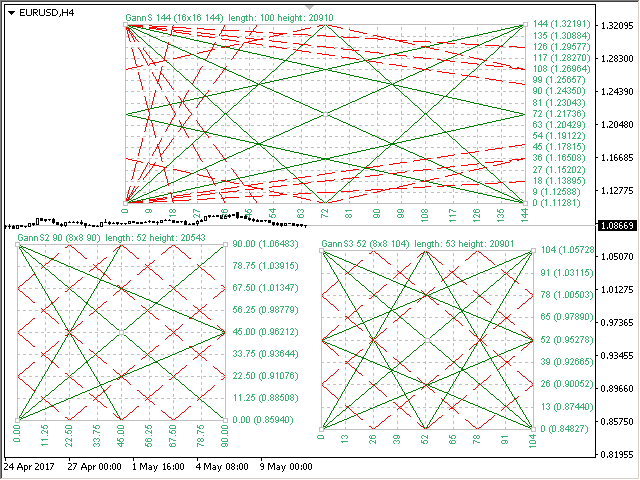
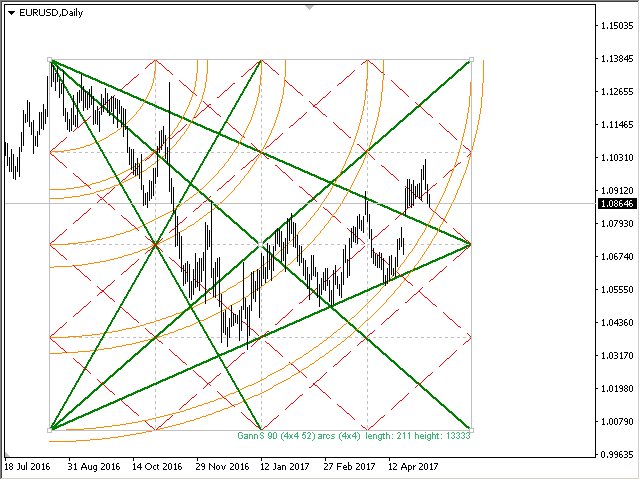
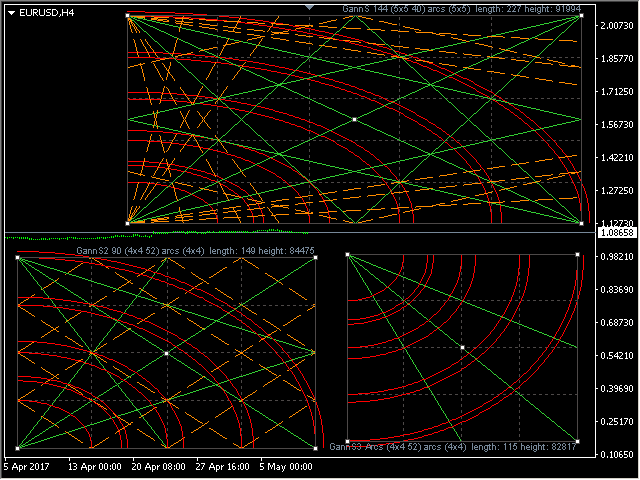
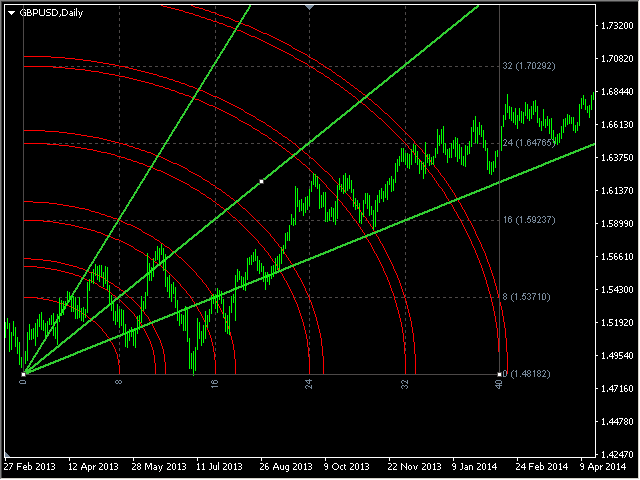
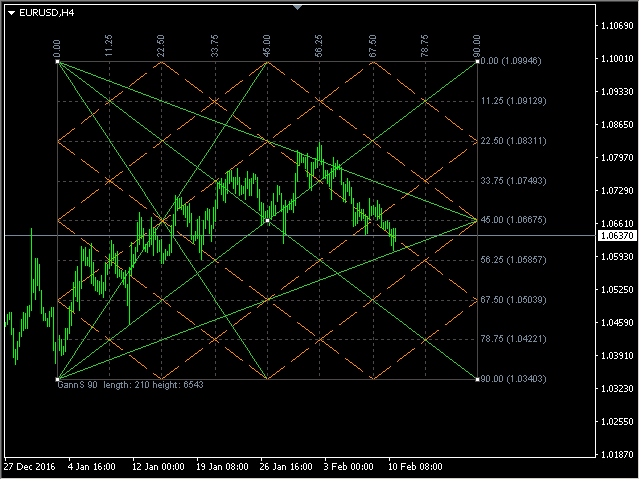
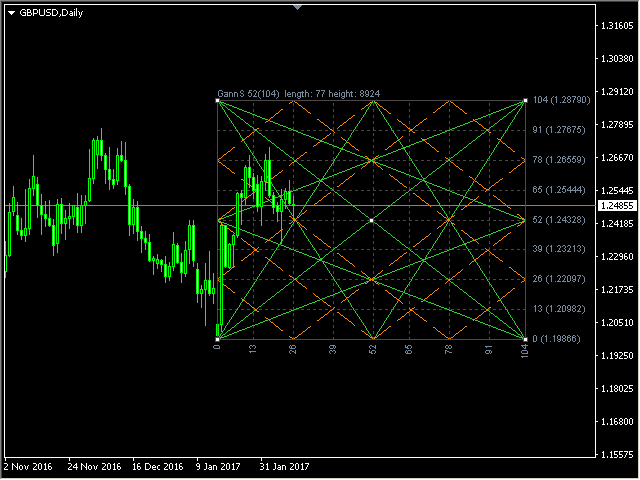
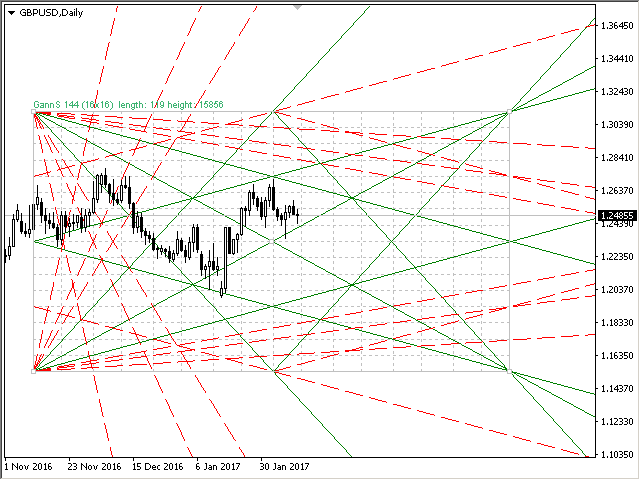
Gann Kutusu (veya Gann Meydanı), W.D. Gann'ın "Piyasa tahminleri için matematiksel formül" makalesine dayanan bir pazar analiz yöntemidir. Bu gösterge üç Kare modelini çizebilir: 90, 52(104), 144. Altı ızgara çeşidi ve iki yay çeşidi vardır. Bir grafik üzerinde aynı anda birden fazla kare çizebilirsiniz
Parametreler
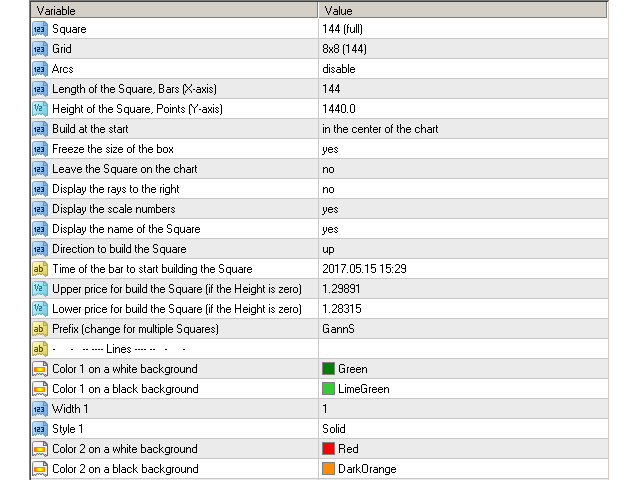
Square — Gann kare modelinin seçimi:
- 90 — 90'ın karesi (veya dokuzun karesi);
- 52 (104) — 52'nin karesi (veya 104);
- 144 — 144'ün evrensel karesi;
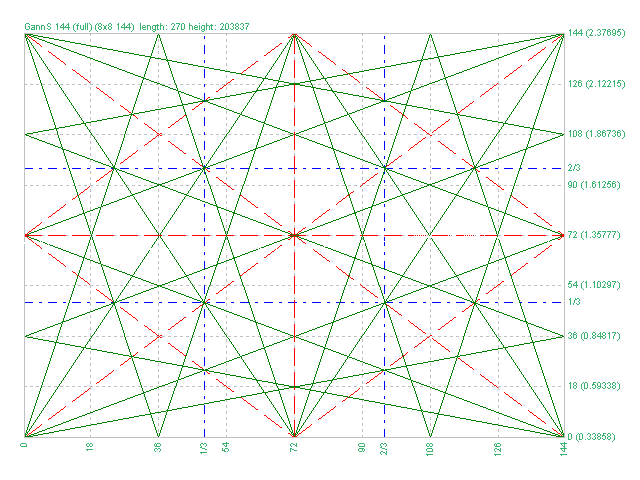
- 144 (full) — karenin "tam" versiyonu, diğer karelerden birleştirilmiş çizgiler. Bilindiği kadarıyla W.D. Gann'ın böyle bir işaretlemesi yoktu;
- for Arcs — yaylar için basitleştirilmiş kare;
Grid — ızgaraların çeşitleri:
- 4x4 (52) — 4'e 4 ızgara, 52 işaretleme;
- 5x5 (40);
- 8x8 (90);
- 8x8 (104);
- 8x8 (144);
- 16x16 (144);
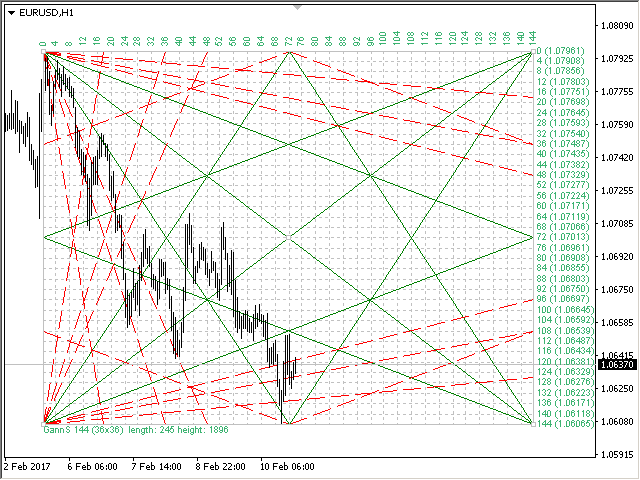
- 36x36 (144);
- disable — ızgarayı devre dışı bırakın;
- 4x4;
- 5x5;
- disable — yayları devre dışı bırakın;
Başlangıçtaki kare parametreler:
Length of Square, Bars (X-axis) — karenin çubuk cinsinden uzunluğu;
Height of Square, Points (Y-axis) — karenin nokta cinsinden yüksekliği;
Build at the start — kareyi başlangıçta inşa edin:
— in the center of the chart — grafiğin ortasında;— at the specified time — belirtilen zamanda;— to use the previous — önceki kareyi kullanın (eğer grafikte mevcutsa);
Freeze the size of the box — kutunun ölçeğini sabitleyin;
Leave the square on the chart — göstergeyi çıkarırken kareyi grafikte bırakın;
Display the rays to the right — ışınları sağda görüntüleyin;
Display the scale numbers — ölçek numaralarını görüntüleyin;
Display the name of the Square — karenin adını görüntüleyin;
Direction of Square — kareyi oluşturma yönü, yukarı veya aşağı;
Time of the bar to start building the Square — çubuğun kutuyu çizmeye başlama zamanı;
Upper price for build the Square (if the Height is zero) — kutunun üst fiyatı, "Kare Yüksekliği" parametresi sıfırsa, bu fiyatlar için kare çizilir;
Lower price for build the Square (if the Height is zero) — kutunun daha düşük fiyatı, "Kare Yüksekliği" parametresi sıfırsa, bu fiyatlar için kare çizilir;
Prefix (change for several boxes) — kutu nesnelerinin öneki; birden fazla kare aynı anda kullanılıyorsa değiştirilmelidir;
Renkler
Color 1 on a white background — beyaz zemin üzerindeki çizgi 1'in rengi;
Color 1 on a black background — siyah zemin üzerinde çizgi 1'in rengi;
Width 1 — çizgi genişliği 1;
Style 1 — çizgi stili 1;
Color 2 on a white background — beyaz zemin üzerindeki çizgi 2'nin rengi;
Color 2 on a black background — siyah zemin üzerinde çizgi 2'nin rengi;
Width 2 — çizgi genişliği 2;
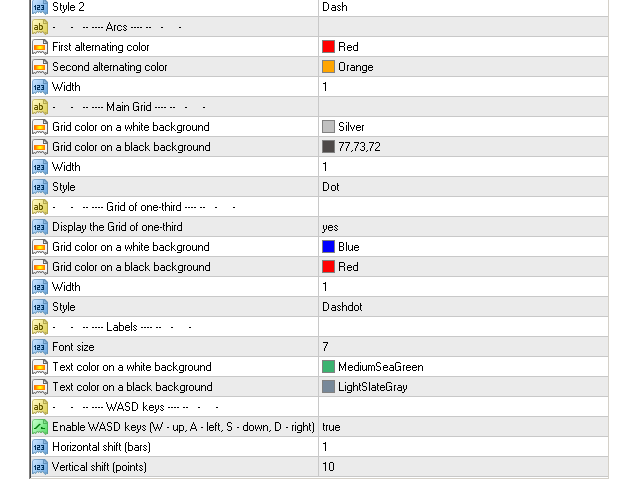
Style 2 — çizgi stili 2;
Yaylar
Color on a white background — Beyaz zemin üzerine renk;
Color on a black background — Siyah zemin üzerine renk;
Width — yay çizgisinin genişliği;
Kafes
Grid color on a white background — Beyaz zemin üzerine ızgara rengi;
Grid color on a black background — Siyah zemin üzerine ızgara rengi;
Width lines — ızgara çizgilerinin genişliği;
Style lines — ızgara çizgilerinin stili;
Satır 1/3
Display the Grid of one-third — ızgarayı 1/3 olarak gösterin;
Font size — Yazı Boyutu;
Text color on a white background — Beyaz zemin üzerine metin rengi;
Text color on a black background — Siyah zemin üzerine metin rengi;
Anahtar kontrolü
Enable WASD keys — 'WASD' tuşlarıyla kontrolü etkinleştirin. 'W' yukarı, 'A' sol, 'S' aşağı ve 'D' sağ;
Horizontal shift (bars) — Karenin (çubuklar) yatay kaydırması;
Vertical shift (points) — Karenin (noktalar) dikey kayması;
All timeframes — grafiğin tüm zaman dilimlerinde bir kare görüntüler;
M1-MN1 — karşılık gelen M1-MN1 periyodunda bir kare görüntüler.


more than great