ZigZag Lines MTF for MT5
- Göstergeler
- Sürüm: 6.5
- Güncellendi: 19 Temmuz 2026
- Etkinleştirmeler: 10

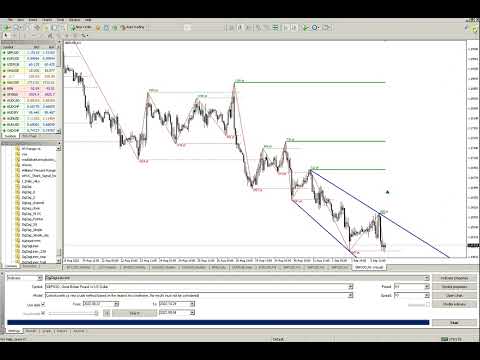
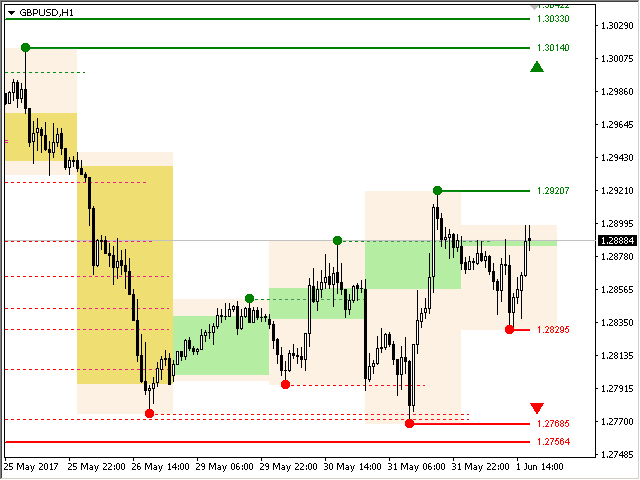
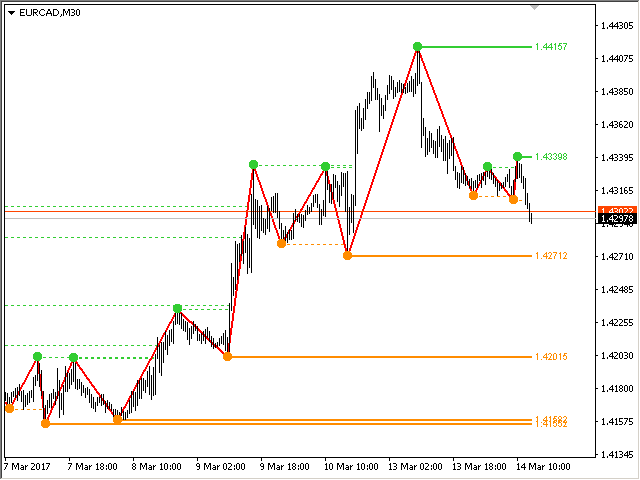
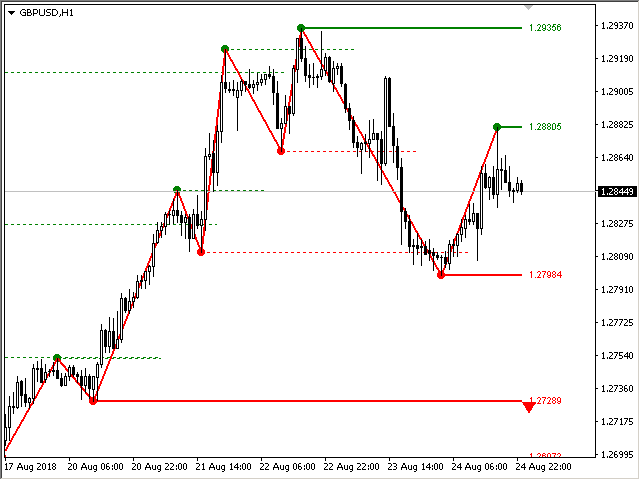
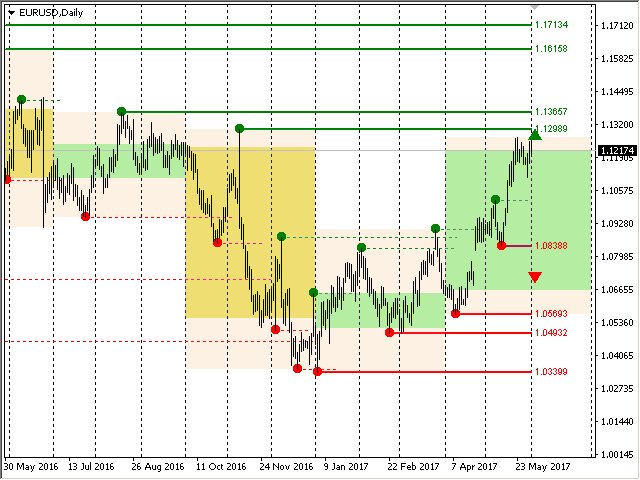
Çoklu zaman dilimi ZigZag göstergesi. Destek/direnç yatay çizgilerini ve bunların kırılmalarını gösterir, ayrıca piyasanın mevcut hedeflerini de çizer. Ayrıca Fraktallar göstergesinin çizgilerini ve diğer dönemlere ait mumları da görüntüleyebilir (Üç Aylığa kadar). Gösterge – Trend çizgilerini göstermek için önemli dip ve tepe noktalarını birbirine bağlar.
Gösterge son (geçerli) noktayı yeniden çizer ve bazı durumlarda son 2-3 noktayı değiştirebilir.
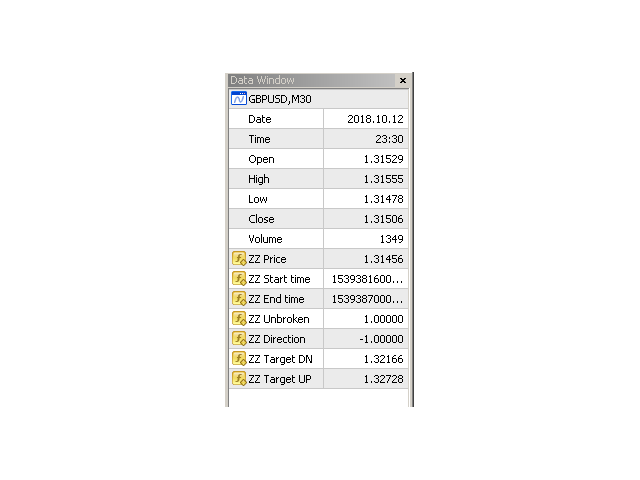
Tüm çizgiler nesneler olarak çizilir (gösterge arabellekleri değil, ancak EA için veri alma olasılığı vardır).
Uzman Danışmanda kullanıldığında, iCustom'u kullanarak ZigZag noktalarını okuyabilirsiniz
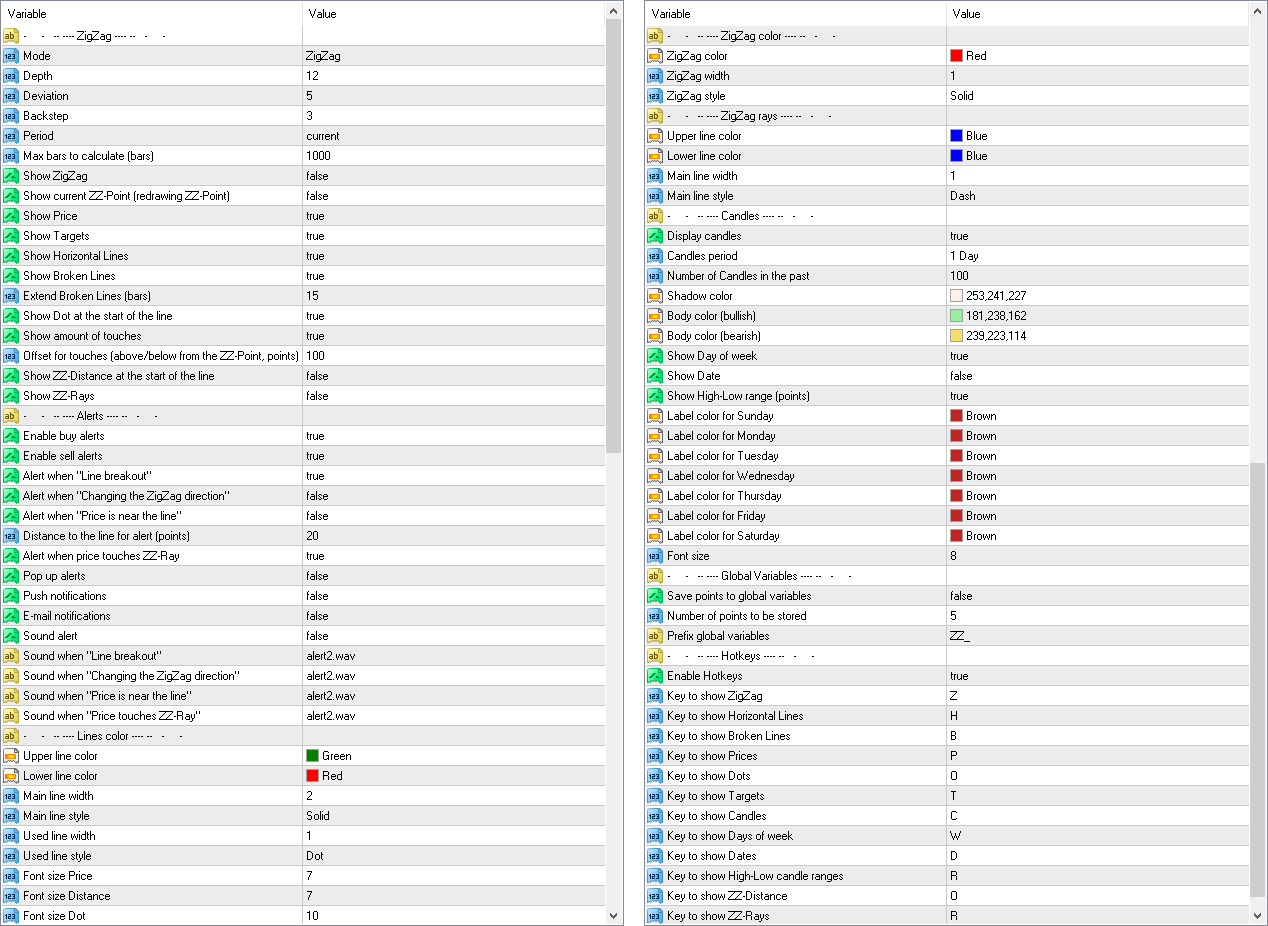
Ayarlar
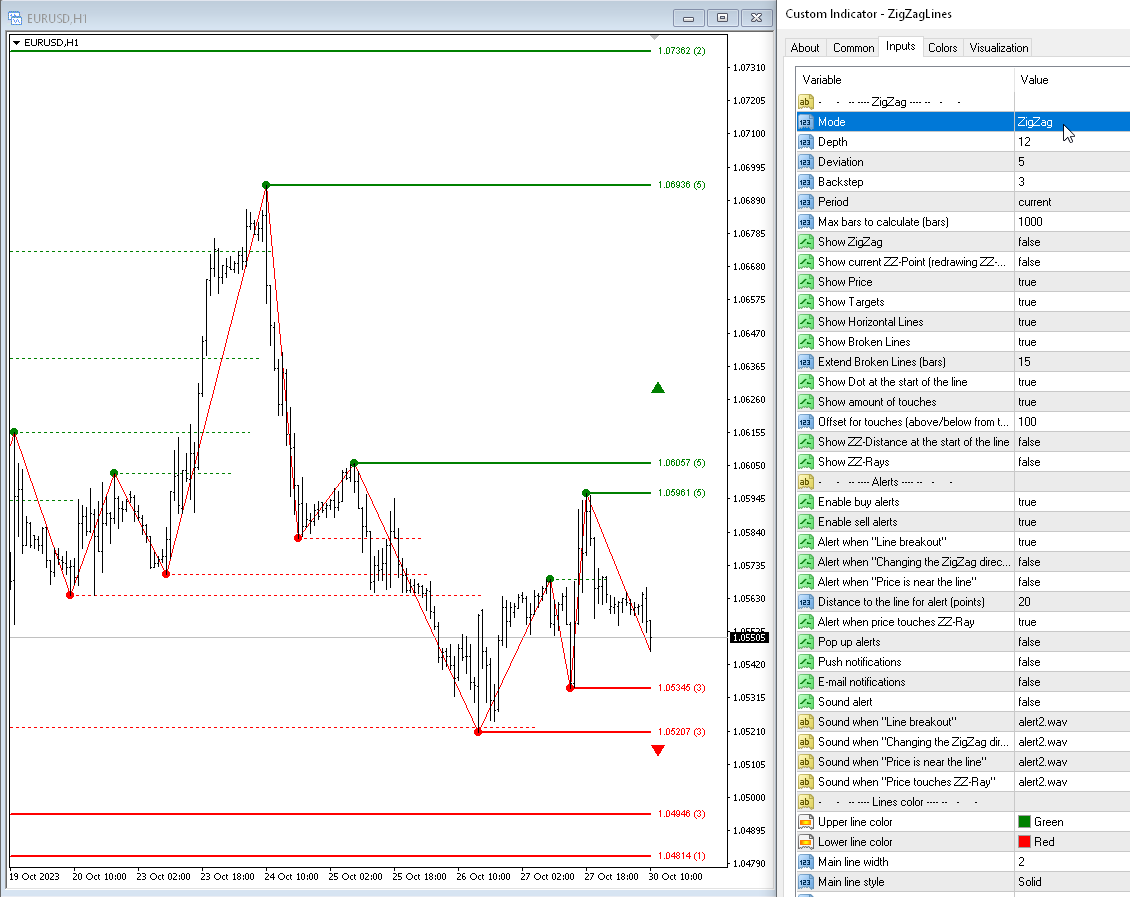
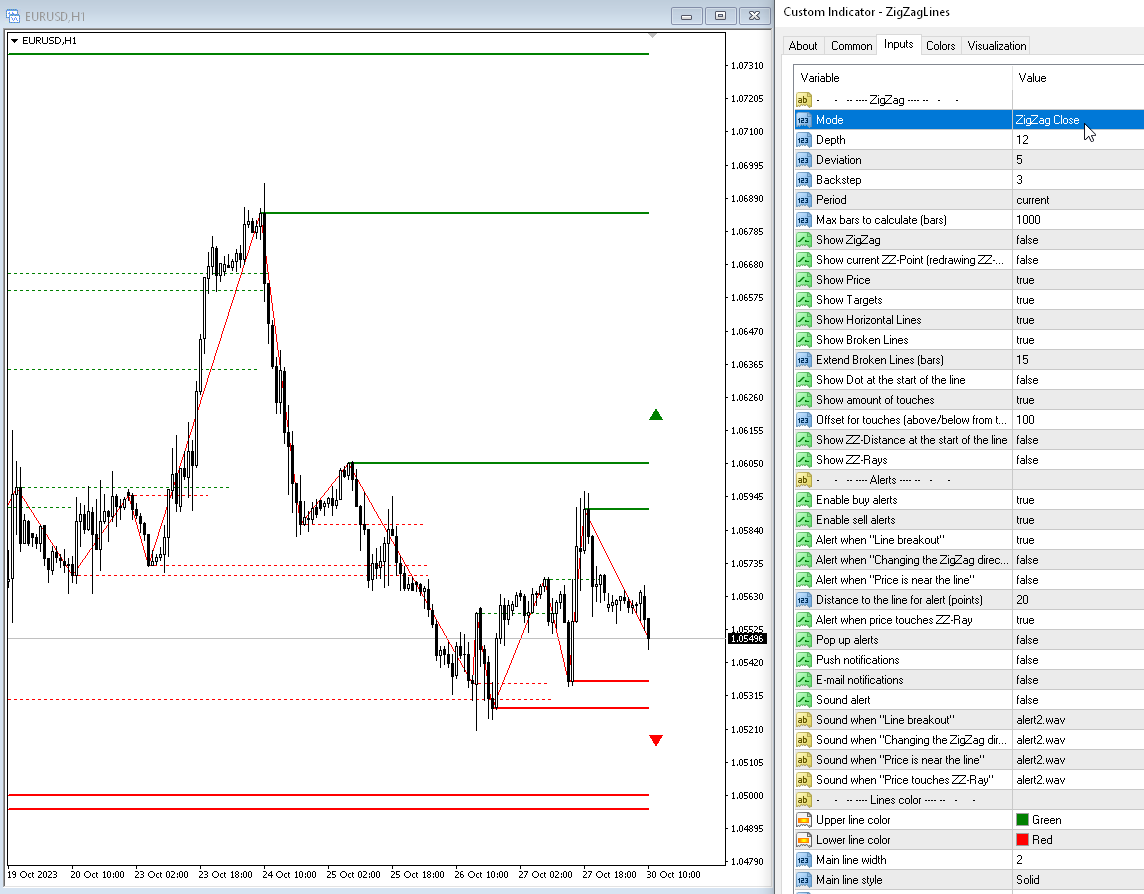
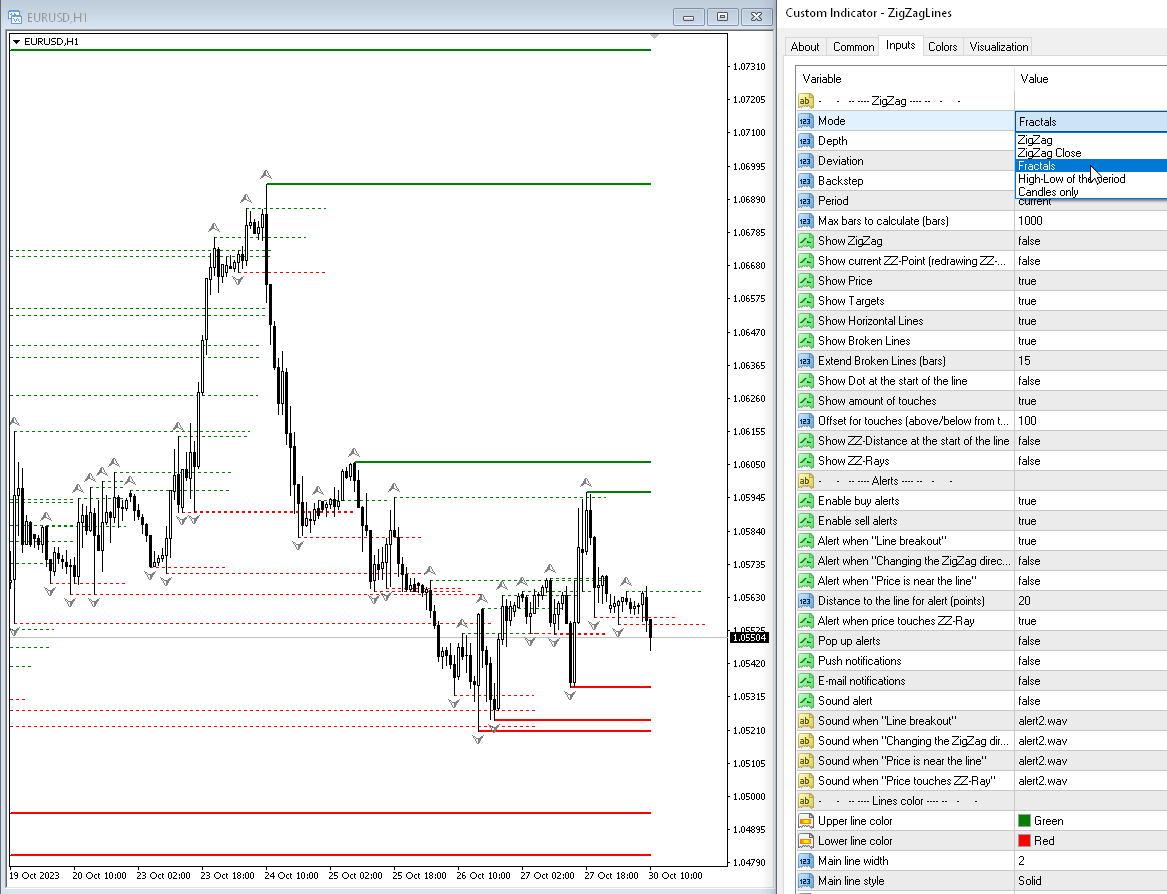
Mode — Destek ve direnç seviyelerini hesaplayın:
— Zig Zag — ZigZag göstergesi;— ZigZag Close — ZigZag Kapatma göstergesi;— Fractals — Fraktallar göstergesi;— High-Low of the period — yüksek-düşük seviyelere göre bir gösterge oluşturmak. Zaman çerçevesi Dönem parametresinde belirtilir;— Candles only — yalnızca Mumları çizin;
Depth — eğer sonuncusu öncekinden daha az (veya daha büyük) Sapma ise, Zigzag'ın ikinci maksimumu (veya minimumu) çekmeyeceği minimum mum çubuğu sayısı;
Deviation — Zigzag'ın yerel bir tepe/dip oluşturması için iki bitişik mum çubuğunun Yüksek/Düşük noktaları arasındaki minimum nokta sayısı;
Backstep — yerel Yüksekler/Düşükler arasındaki minimum mum çubuğu sayısı;
Period — Fraktalların ZigZag'ının hesaplanması için dönem;
Max bars to calculate (bars) — hesaplama için maksimum çubuk sayısı. Bu sınırlama hesaplamaları hızlandırmak için getirilmiştir;
Grafikte görüntüle
Show Zigzag — ZigZag'ı göster;
Show current ZZ-point (redrawing point) — geçerli (son) noktayı göster;
Show Price — seviyelerin fiyatını gösterin;
Show Targets — mevcut hedefleri gösterin (piyasanın nereye gittiğini);
Show broken lines) — kesikli seviyeleri gösterir;
Check the breakout of the Lines by price — Hatların dağılımını fiyata göre kontrol edin:
- High-Low (current bar) — Yüksek-Düşük (mevcut çubuk)
- High-Low (previous bar) — Yüksek-Düşük (önceki çubuk)
- Close (previous bar) — Kapat (önceki çubuk)
- Open (current bar) — Açık (geçerli çubuk)
Extend broken lines (bars) — kesik çizgileri belirtilen sayıda çubuk kadar sağa doğru uzatın;
Show Dot at the start of the line — göstergenin dönüş noktalarında noktaları görüntüleyin;
Show amount of touches — satır fiyatına yakın dokunma sayısını gösterin;
Offset for touches (above/below from the ZZ-point, points) — ZZ noktasının seviyeye temas ettiği kabul edilecek aralık.
Uyarılar
Pop up alerts — bir seviyeye dokunduğunuzda açılan uyarı;
Push notifications — Anında bildirim;
E-mail notifications — e-postayla bildirim;
Sound alert — bir seviyeye dokunduğunuzda sesli uyarı;
Alert when "Line breakout" — ZigZag seviyesi kırıldığında uyarı;
Alert when "Changing the ZigZag direction" — ZigZag yönünü değiştirirken uyarı ver;
Alert when "Price is near the line" — fiyat seviyeye yakınsa uyarı ver (çubuk olduğunda ZigZag'ın mevcut noktası kontrol edilmez);
Distance to the line for alert (points) — uyarı için mesafe (puan olarak);
Renkler
Upper line color — üst çizgilerin rengi;
Lower line color — alt çizgilerin rengi;
Main line width — ana çizginin genişliği;
Main line style — ana çizginin stili;
Used line width — kullanılan çizginin genişliği;
Used line style — kullanılan çizginin stili;
Font size price — Fiyatlar için yazı tipi boyutu;
Font size dot — Noktalar için yazı tipi boyutu;
ZigZag color — ZigZagа'nın rengi;
ZigZag width — ZigZag çizgilerinin genişliği;
ZigZag style — ZigZag çizgilerinin stili;
Mumlar
Display candles — diğer dönemlere ait mumların görüntülenmesini etkinleştirin;
Candles period — mum dönemi, tüm standart olanlar artı Üç Aylık;
Number of Candles in the past — grafikteki mum sayısı;
Shadow color — mum fitillerinin mumu;
Body color (bullish) — yükseliş mumunun gövde mumu;
Body color (bearish) — düşüş mumunun gövde rengi;
Save points to global variables — noktaları terminalin Global Değişkenlerinde saklayın;
Number of points to be stored — saklanacak nokta sayısı (mevcut nokta sıfırdır);
Prefix global variables — Genel Değişken adlarının öneki.


Самый лучший индикатор который рисует структуру которую я видел, мультитаимфреймный анализ вообще идеальный. Спасибо)))