RSI Better Version mt4
- Göstergeler
- Arinze Michael Ejike
- Sürüm: 1.0
- Etkinleştirmeler: 19
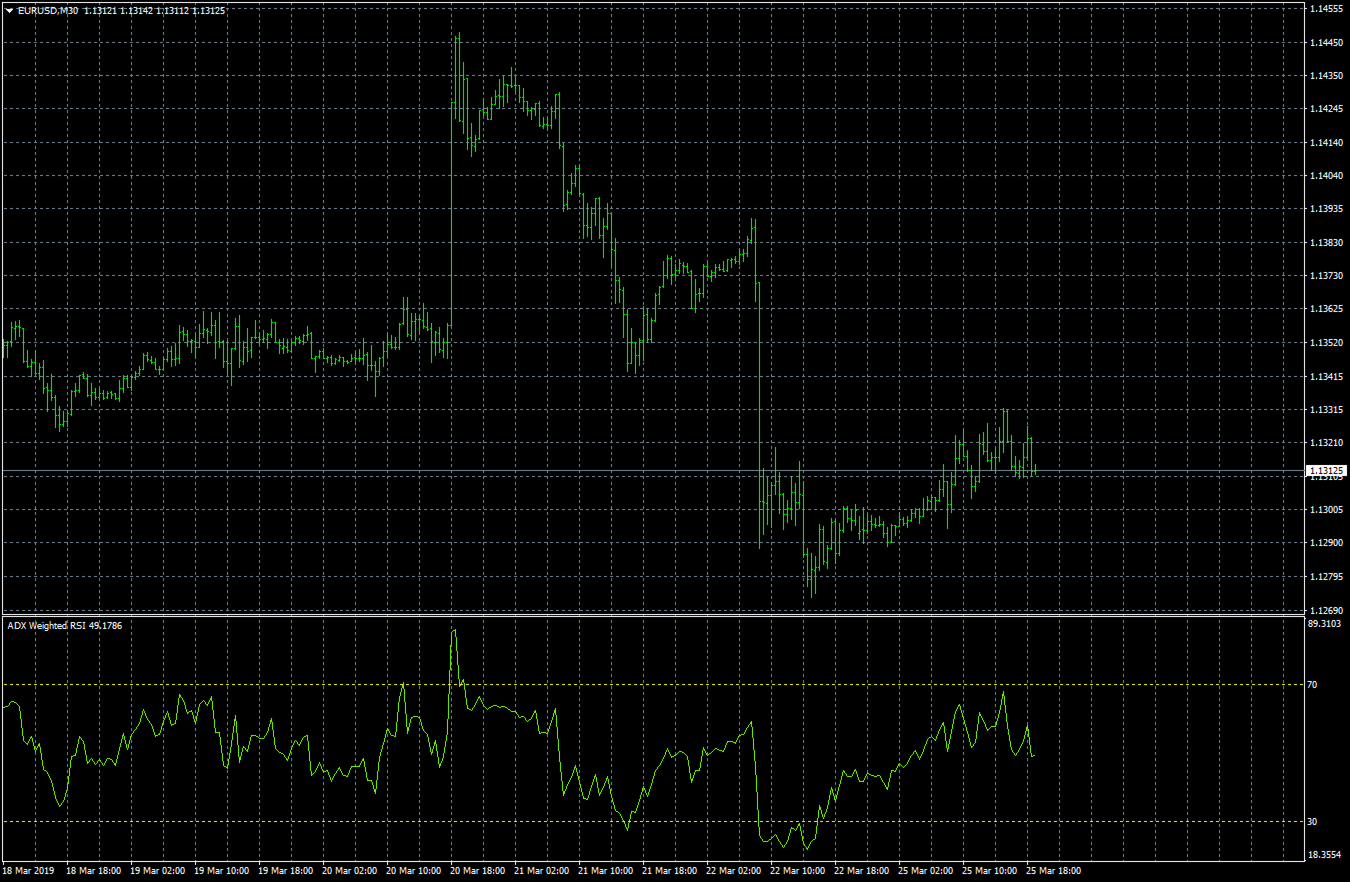
The Better RSI is an enhanced version of the traditional Relative Strength Index (RSI) that incorporates Average Directional Index (ADX) weighting to address one of the classic RSI's fundamental weaknesses: false signals during strong trending markets.
The Problem with Traditional RSI
The standard RSI oscillator, developed by J. Welles Wilder Jr., measures the magnitude of recent price changes to evaluate overbought or oversold conditions. However, during strong trending markets, RSI tends to remain in extreme zones (above 70 or below 30) for extended periods, generating numerous false reversal signals. Traders who act on these signals often find themselves fighting the trend and incurring losses.
The Solution: ADX-Based Trend Filtering
The Better RSI solves this problem by incorporating ADX measurements to detect trend strength and automatically adjust the RSI's sensitivity. The key insight is this: when the market is trending strongly, we want the RSI to be less reactive to minor pullbacks and consolidations.
How It Works
Core Calculation Components
- Standard RSI Calculation: The foundation begins with Wilder's traditional RSI using exponential moving averages of gains and losses over the specified period.
- ADX and ADXR Comparison: The indicator calculates both ADX (Average Directional Index) and ADXR (ADX Rating). ADXR is simply the average of the current ADX and the ADX from n periods ago, providing a smoothed reference point for trend strength comparison.
- Adaptive Weighting Logic:
- When ADX < ADXR: The market is in a weakening or consolidating phase. The indicator outputs the standard RSI value without modification.
- When ADX ≥ ADXR: The market is in a strengthening trend phase. The indicator applies adaptive weighting to dampen the RSI's oscillations.
How Weighting Works
When ADX indicates a strengthening trend, the indicator centers the RSI around 50, applies proportional dampening based on trend strength, then recenters the result. Stronger ADX values produce more dampening, preventing the RSI from reaching extreme levels during powerful trends. The weighting percentage allows traders to adjust how aggressively the indicator responds to trend strength.
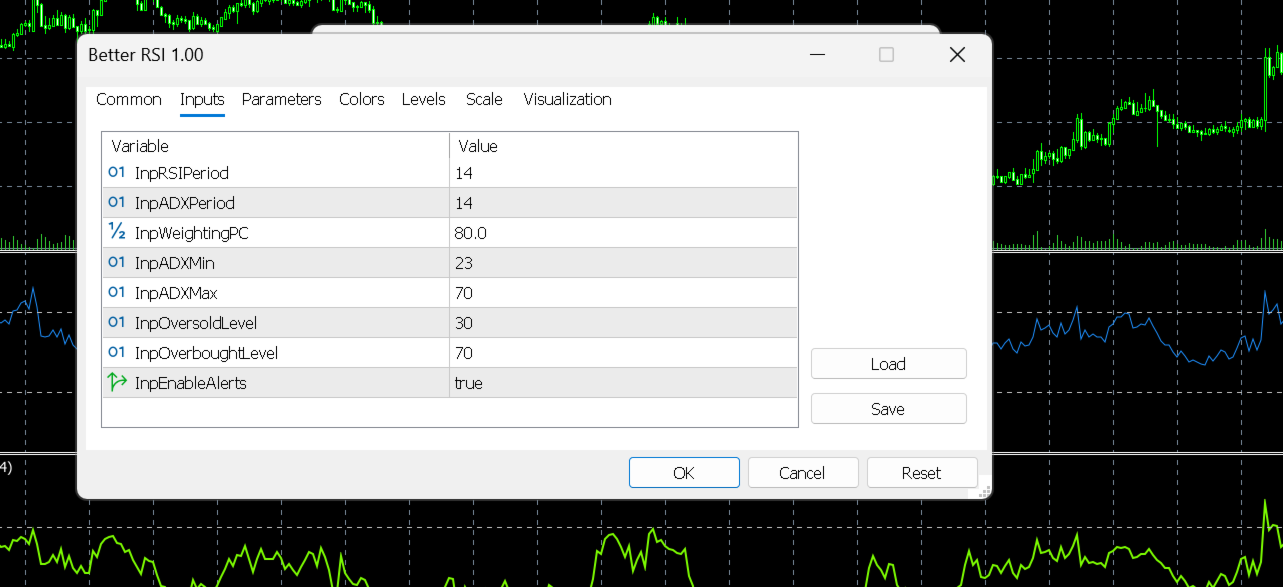
Parameters Explained
- RSI Period: Standard RSI lookback period. Lower values make RSI more sensitive; higher values make it smoother. The default setting provides balanced responsiveness for most timeframes.
- ADX Period: Lookback period for ADX calculation. Should typically match or complement the RSI period to ensure both components analyze similar market timeframes.
- Weighting Percentage: The percentage of dampening to apply during strong trends. Higher values create more dampening, keeping RSI away from extremes during powerful trends. Lower values allow more traditional RSI behavior even during trends.
- ADX Minimum: The threshold below which ADX is considered weak and no dampening occurs. Values below this trigger standard RSI behavior, making the indicator responsive in ranging markets.
- ADX Maximum: The ceiling for ADX in the dampening calculation. Values above this are capped to prevent excessive dampening during extremely strong trends.
- Overbought Level / Oversold Level: Traditional overbought and oversold thresholds that trigger alerts. These define the zones where reversal or continuation opportunities may emerge.
Practical Applications
Trend Following
During strong uptrends, the Better RSI stays elevated but doesn't reach the extreme overbought levels that would trigger premature exit signals. This allows traders to remain in profitable positions longer without being shaken out by minor corrections.
Ranging Markets
When ADX is low (below ADXR), the indicator reverts to standard RSI behavior, making it excellent for identifying reversal opportunities in ranging or consolidating markets.
Alert System
The indicator provides four types of alerts:
- Entry into oversold zone
- Exit from oversold zone
- Entry into overbought zone
- Exit from overbought zone
These alerts include the symbol, timeframe, RSI value, and timestamp, enabling traders to monitor multiple instruments across multiple timeframes without constant chart watching.
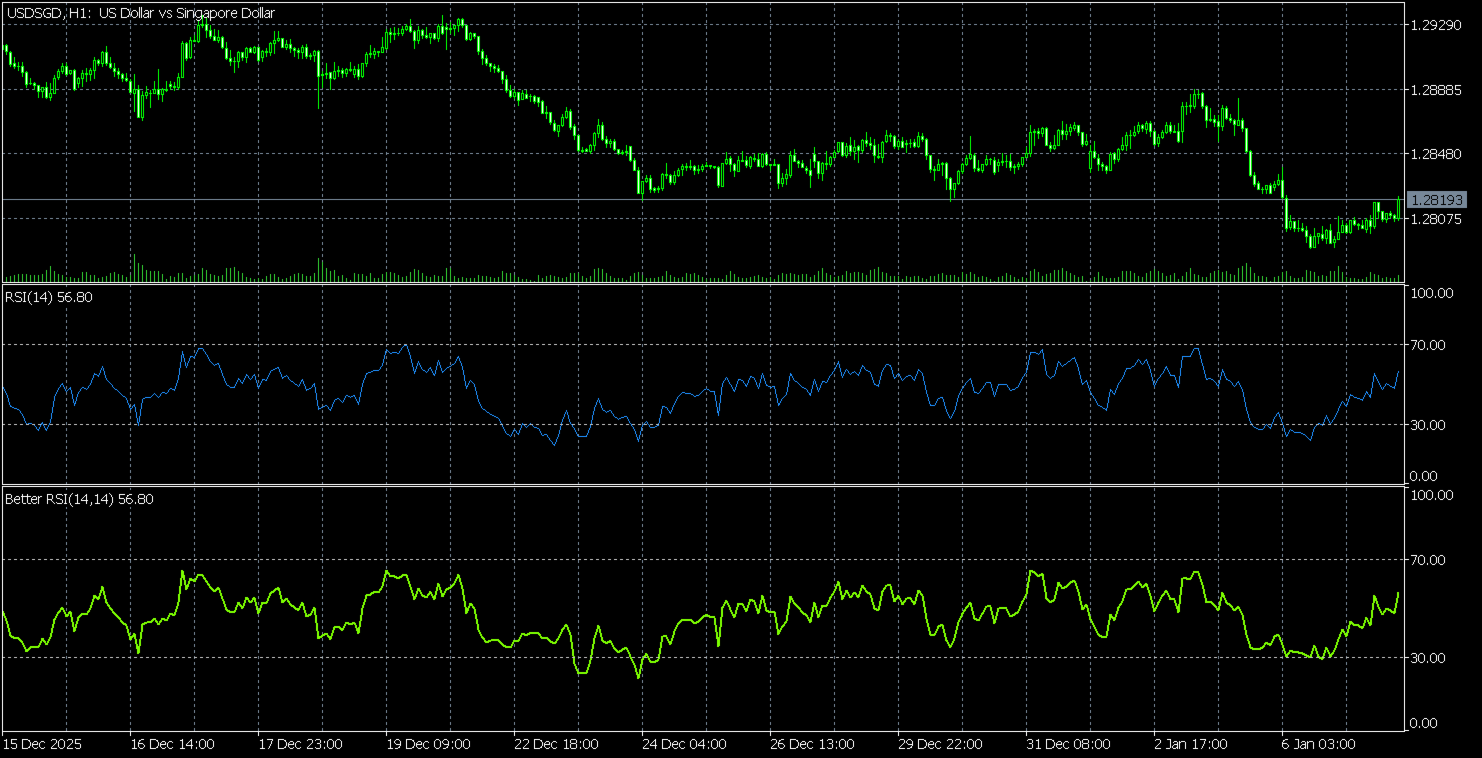
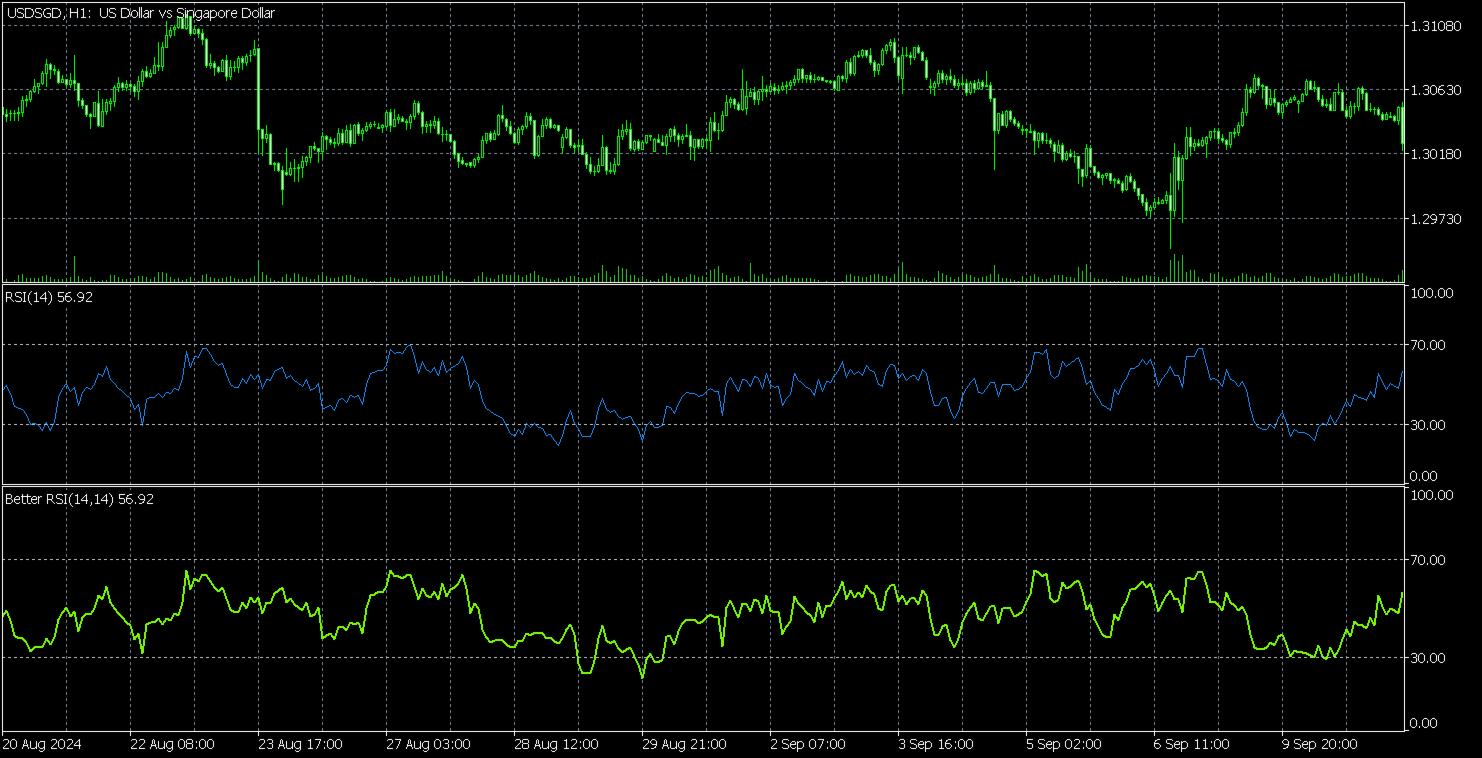
Advantages Over Standard RSI
- Fewer false signals: By recognizing trend strength, the indicator avoids the whipsaw trades that plague traditional RSI users.
- Context-aware: The same reading has different implications depending on whether the market is trending or ranging.
- Adaptive behavior: Automatically adjusts sensitivity without requiring manual intervention or parameter changes.
- Maintains RSI familiarity: Traders accustomed to RSI interpretation can easily understand Better RSI readings.
Trading Strategy Considerations
Oversold in Uptrend: When Better RSI reaches oversold levels during an established uptrend (ADX strong), this often represents a high-probability buying opportunity rather than a reversal signal.
Overbought in Downtrend: Similarly, overbought readings during strong downtrends (high ADX) may indicate optimal short entry points rather than imminent reversals.
Divergence: The indicator can still be used for divergence analysis. However, divergences are more reliable when ADX is declining, indicating trend exhaustion.
Multiple Timeframe Analysis: The Better RSI excels when used across multiple timeframes. Higher timeframe trend direction (where ADX is strong) can guide lower timeframe entry timing (where RSI provides precise signals).
Conclusion
The Better RSI represents an evolution in oscillator design by acknowledging that market context matters. Rather than treating all price action equally, it recognizes that trending and ranging markets require different analytical approaches. By adjusting its calculations based on trend strength, the Better RSI provides traders with a more intelligent, context-aware tool for timing entries and exits.
The result is an indicator that maintains the intuitive simplicity of the original RSI while dramatically reducing false signals and improving overall trading performance in both trending and ranging market conditions.
Note: Like all technical indicators, the Better RSI should be used as part of a comprehensive trading system that includes proper risk management, position sizing, and confirmation from multiple sources. No indicator is infallible, and traders should always consider fundamental factors, market conditions, and their own risk tolerance when making trading decisions.