Gold Signal Pro with Auto TP SL

3.8

KURAMA GOLD SIGNAL PRO (MT5) — 7 Katmanlı Filtre, Otomatik TP/SL, Kalite Puanı ve Sinyal Geçmişi Kaydı | Eksiksiz XAUUSD Ticaret Sistemi


Gerçek zamanlı olarak yeniden çizmez. Bir sinyal belirdiği anda ok, giriş, TP ve SL anında sabitlenir ve sonradan hareket etmez. Sizin işlem yaptığınız şey bu gerçek zamanlı sinyaldir. Ve v7.20'de, gerçekten gönderilen her sinyal otomatik olarak kaydedilir ve yeniden başlatmanın ardından olduğu gibi geri yüklenir.


━━━━━━━━━━━━━━━━

ALICILARA ÖZEL HEDİYE

━━━━━━━━━━━━━━━━

Ömür boyu lisansı satın alın ve AI Zone Radar'ı ($59 değerinde) + eksiksiz PDF kılavuzunu ücretsiz alın. Ürün fiyatının üzerine $59 değerinde bir hediye gelir. Satın alma sonrası MQL5 üzerinden bana mesaj atmanız yeterli.

AI Zone Radar: https://www.mql5.com/en/market/product/175834


Altın yatırımcılarından oluşan bir toplulukta aktif olarak kullanılıyor ve doğruluğu ile kullanım kolaylığı nedeniyle yüksek puan alıyor.


━━━━━━━━━━━━━━━━━━━━

SORUNUNUZ — VE ÇÖZÜMÜ

━━━━━━━━━━━━━━━━━━━━

Altın günde $30–$50 hareket eder. Fırsatın orada olduğunu biliyorsunuz. Ama şu tanıdık geliyor mu?


- Çok erken giriyorsunuz, fiyat $10 aleyhinize gidiyor, sonra nihayet sizin yönünüze dönüyor

- Her MA dokunuşunda giriyorsunuz ve yarısında kaybediyorsunuz

- TP/SL ölçütü olmadığından ya çok uzun tutuyor ya da çok erken çıkıyorsunuz

- Ölü saatlerde işlem yapıyor ve neden hiçbir şeyin işe yaramadığını merak ediyorsunuz


KURAMA GOLD SIGNAL PRO tüm bunları çözmek için yapıldı. Tek bir filtreyle değil — yedi filtreyle.


━━━━━━━━━━━━━━━━━━━━

NASIL KULLANILIR — 3 ADIM

━━━━━━━━━━━━━━━━━━━━

1. Grafikte bir ok sinyali belirir

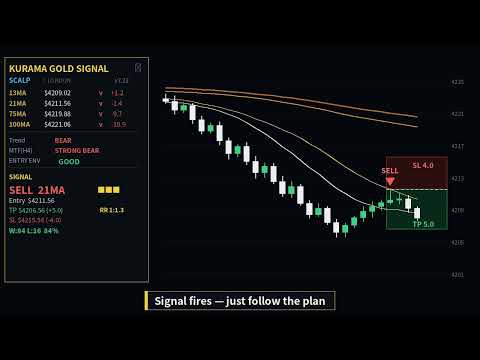
2. Panelden TP fiyatını, SL fiyatını, kalite puanını ve risk-ödül oranını kontrol edin

3. Emri verin ve bekleyin


Tahmin yok. Karmaşık analiz yok. Oku takip edin, sayılarla yönetin.


━━━━━━━━━━━━━━━━━━━━

SADECE GİRİŞLER DEĞİL — TAM ÇIKIŞ PLANI EKRANDA

━━━━━━━━━━━━━━━━━━━━

Çoğu gösterge size yalnızca girişi gösterir ve gerisini size bırakır.


Bu gösterge, bir sinyal tetiklendiği anda her şeyi gösterir:


- Ok: giriş yönü ve fiyatı

- Yeşil bölge: kâr alma hedefi ve tam fiyatı

- Kırmızı bölge: zarar durdurma seviyesi ve tam fiyatı

- Panel: TP, SL, risk-ödül oranı ve kalite puanı sayılarla


Gösterilen sayıları doğrudan emrinize girmeniz yeterli. Hesap gerekmez.


━━━━━━━━━━━━━━━━━━━━

YEDİ BAĞIMSIZ FİLTRE — ASIL AVANTAJ

━━━━━━━━━━━━━━━━━━━━

Bir sinyal belirmeden önce piyasanın yedi filtrenin tamamından aynı anda geçmesi gerekir:


Filtre 1 — Volatilite anomali tespiti: ATR sıçramalarında ve ölü piyasalarda sinyalleri engeller.

Filtre 2 — MA yapı kontrolü: SMA 13/21/75/100 dizilimini doğrular.

Filtre 3 — Trend yönü filtresi: MA eğimini ve fiyat konumunu birleştirir.

Filtre 4 — MA açı filtresi: gerçek MA açısını ölçer. Düz MA = sinyal yok. Yatay piyasa zararlarını ortadan kaldırır.

Filtre 5 — Üst zaman dilimi filtresi (H4): herhangi bir M5/M15 girişinden önce H4 trendini kontrol eder.

Filtre 6 — RSI filtresi: aşırı alım/aşırı satım uçlarında girişleri engeller.

Filtre 7 — Penetrasyon engeli: gerçek bir geri çekilmeyi bir kırılımdan ayırır.


Filtre geçilmedi = sinyal yok = işlem yok. Piyasadaki çoğu XAUUSD göstergesi bir veya iki filtre kullanır. Bu, yedi filtre kullanır.


━━━━━━━━━━━━━━━━━━━━

ÜÇ FİLTRE SEVİYESİ

━━━━━━━━━━━━━━━━━━━━

SAFE [S] — Maksimum filtreleme. First-Touch filtresi AÇIK. En az sinyal, en yüksek doğruluk.

STANDARD (varsayılan) — Dengeli mod. Kalite ve sıklığın optimum dengesi. Önerilir.

ACTIVE [A] — Gevşetilmiş filtreler. Daha fazla sinyal. Yalnızca düşük spreadli hesaplar için. Kalite puanına göre elle filtreleme önerilir.


Parametrelerden tek tıkla değiştirin. TP/SL hesaplaması her seviyede aynıdır.


━━━━━━━━━━━━━━━━━━━━

HER SİNYALDE BİR KALİTE PUANI

━━━━━━━━━━━━━━━━━━━━

★★★ — Tüm koşullar mükemmel. Güçlü kurulum. Daha geniş TP.

★★ — Sağlam kurulum. Standart TP/SL. Ana işlemleriniz.

★ — Belirsiz koşullar. Daha dar TP/SL. Lotu azaltın veya atlayın.


Risk yönetimi puan aracılığıyla otomatik olarak gerçekleşir.


[v7.20 YENİ] Panel artık yıldız seviyesine göre bir kazanç/kayıp sayımı da gösteriyor. Mevcut piyasada hangi kalite puanının işe yaradığını kendiniz görebilirsiniz.


━━━━━━━━━━━━━━━━━━━━

[v7.20 YENİ] GEREKÇE ETİKETLERİ — BU SİNYAL NEDEN TETİKLENDİ

━━━━━━━━━━━━━━━━━━━━

Her sinyal, tetiklenme gerekçelerini etiketler halinde gösterir. Bir kara kutu değildir.


FT — First Touch (o MA'ya ilk dokunuş)

RT — Re-Touch (ikinci veya sonraki)

TREND — trend yönüyle uyumlu

H4 — üst zaman dilimi (H4) yönüyle uyumlu

PO — Perfect Order geçerli

VOL — volatilite sağlıklı bir aralıkta


Etiket ne kadar çoksa, o sinyalde o kadar çok gerekçe örtüşür. Kalite puanıyla birlikte, giriş kararlarını güvenle verebilirsiniz. Etiketler telefonunuzdaki anlık bildirimde de görünür, böylece grafiğe bakmadan bile gerekçeyi bilirsiniz.


━━━━━━━━━━━━━━━━━━━━

DİNAMİK TP/SL — HER SEFERİNDE PİYASAYA UYUM SAĞLAR

━━━━━━━━━━━━━━━━━━━━

Sabit TP/SL işe yaramaz çünkü piyasa her gün değişir. Bu gösterge her seferinde şunlara göre sıfırdan yeniden hesaplar:


- Hangi MA'ya dokunulduğu

- Kalite puanı

- Mevcut volatilite

- Ardışık sinyal sayısı


Tam şu anki piyasaya uyan bir TP/SL elde edersiniz.


━━━━━━━━━━━━━━━━━━━━

DÖRT MA — DÖRT TÜR İŞLEM

━━━━━━━━━━━━━━━━━━━━

13MA — Sığ geri çekilme. Hızlı scalp. Dar TP/SL. Yalnızca Perfect Order.

21MA — Standart geri çekilme. En sık görülen sinyal. Dengeli TP/SL.

75MA — Derin geri çekilme. Geniş TP/SL.

100MA — En derin geri çekilme. Ana destek/direnç. Geniş TP/SL.


Panel hangi MA'nın tetiklendiğini size söyler.


━━━━━━━━━━━━━━━━━━━━

EKSİKSİZ PANEL — HER ŞEY TEK EKRANDA

━━━━━━━━━━━━━━━━━━━━

- 4 MA değeri, eğimleri ve fiyata olan uzaklığı

- Filtre seviyesi: [S], [A] veya boş

- Trend: Strong Bull / Bull / Range / Bear / Strong Bear

- H4 üst zaman dilimi bağlamı

- ATR (Normal/Spike/Low durumuyla)

- RSI değeri

- ENTRY ENV: mevcut giriş ortamının genel değerlendirmesi (GOOD/CAUTION/NG)

- Mevcut sinyal: yön, MA tipi, kalite, gerekçe etiketleri, TP, SL, risk-ödül oranı

- 21MA tabanlı takip eden SL referansı

- Yıldız seviyesine göre kazanç/kayıp sayacı

- Spread monitörü: yeşil/sarı/kırmızı

- Mum geri sayım sayacı


━━━━━━━━━━━━━━━━━━━━

[v7.20 YENİ] OTOMATİK SİNYAL GEÇMİŞİ KAYDI VE GERİ YÜKLEME

━━━━━━━━━━━━━━━━━━━━

Sinyal göstergeleriyle ilgili sık karşılaşılan bir şikâyet hep "yeniden başlatınca sinyaller kayboluyor" olmuştur. v7.20'de çözüldü.


- Tetiklenen her sinyal otomatik olarak bir dosyaya kaydedilir

- Bir MT5 yeniden başlatması, grafik yeniden yüklemesi veya göstergeyi yeniden uygulamanın ardından oklar, TP/SL ve bölgeler otomatik olarak geri yüklenir

- Geri yüklenen şey, tam olarak gerçekten gönderilen sinyallerdir

- Bir VPS taşırken veya PC değiştirirken, geçmiş dosyasını kopyalamanız yeterlidir


Geçmiş sinyaller kaldığı için geçmiş performansı kendi gözlerinizle doğrulayabilirsiniz. Gizli sonuç yok.


Ayrıca v7.20, grafik yeniden yüklendiğinde aynı sinyalin tekrar bildirilmesi sorununu giderir. Yalnızca yeni sinyaller bildirilir.


━━━━━━━━━━━━━━━━━━━━

GERİYE KAYDIRIN VE DOĞRULAYIN

━━━━━━━━━━━━━━━━━━━━

Geçmiş her sinyal, TP/SL bölgeleriyle birlikte grafikte kalır. Yeşil bölgeye ulaştı = TP gerçekleşti. Kırmızı bölgeye ulaştı = SL gerçekleşti. Gizli sonuç yok. Kendiniz görün.


━━━━━━━━━━━━━━━━━━━━

İKİ MOD

━━━━━━━━━━━━━━━━━━━━

SCALP M5 — Hızlı. Dar TP/SL. Trendli seanslarda aktif işlem.

DAY M15 — Daha büyük hedefler. Daha sıkı filtreler. Daha az ama daha kaliteli sinyal.


En güçlü kurulum: ikisini yan yana gösterin. Yönü M15'te doğrulayın. Girişi M5'te zamanlayın.


━━━━━━━━━━━━━━━━━━━━

UYARILAR

━━━━━━━━━━━━━━━━━━━━

PC'de sesli uyarı. MT5 mobile anlık bildirim. İsteğe bağlı e-posta. Yüksek kaliteli sinyaller için özel bir ses. Gerekçe etiketleri anlık bildirimde de yer alır.


━━━━━━━━━━━━━━━━━━━━

SADECE ALTIN. ALTINDAN BAŞKA HİÇBİR ŞEY.

━━━━━━━━━━━━━━━━━━━━

Her filtre, eşik ve TP/SL hesaplaması yalnızca XAUUSD için sıfırdan tasarlandı. Seans örüntüleri, ATR sıçramaları, haber öncesi davranış — hepsi hesaba katıldı.


Bu, üzerine altın ön ayarı eklenmiş bir FX göstergesi değildir. Yalnızca altına özel bir göstergedir.


━━━━━━━━━━━━━━━━━━━━

OTOMATİK SEANS TESPİTİ

━━━━━━━━━━━━━━━━━━━━

Sidney, Tokyo, Londra, New York — broker'ınızın sunucu saatinden bağımsız olarak otomatik tespit edilir.


━━━━━━━━━━━━━━━━━━━━

SPREAD MONİTÖRÜ

━━━━━━━━━━━━━━━━━━━━

Yeşil = devam. Sarı = dikkat. Kırmızı = bekle. Her zaman grafikte.


━━━━━━━━━━━━━━━━━━━━

GERÇEK ZAMANLI OLARAK YENİDEN ÇİZMEZ — VE YENİDEN HESAPLAMA HAKKINDA DÜRÜST BİR AÇIKLAMA

━━━━━━━━━━━━━━━━━━━━

[Gerçek zamanlı davranış]

Bir sinyal kapanmış bir mumda belirdikten sonra, o mumun içinde kaybolmaz veya konum değiştirmez. Ok, giriş, TP ve SL belirdiği anda sabitlenir ve sonradan hareket etmez. Gerçekte işlem yaptığınız şey bu gerçek zamanlı sinyaldir. Burada gecikme yok, yeniden çizim yok.


[Yeniden hesaplama hakkında — açıkça belirtelim]

Göstergeyi yeniden uyguladığınızda, yeniden başlattığınızda veya zaman dilimini değiştirdiğinizde, geçmiş mumlar sıfır iç durumdan (bekleme süreleri vb.) yeniden hesaplanır. O noktada geçmiş "referans okların" görünme şekli biraz değişebilir. Bu yeniden çizim değildir — iç durum tutan herhangi bir gösterge için ortak olan bir yeniden hesaplama davranışıdır ve her platformda standarttır. Önemli olan, bunun gerçek zamanlı işlem sonuçlarınız üzerinde hiçbir etkisinin olmamasıdır. Sinyali belirdiği anda işlem yaparsınız; geçmiş mumların yeniden çizilmesi hiçbir girişi, TP'yi, SL'yi veya kâr/zararı asla değiştirmez.


Ve v7.20'de, gerçekten gönderilen her sinyal otomatik olarak bir dosyaya kaydedilir ve yeniden başlatmanın ardından aynı konuma geri yüklenir. Bildirilen sinyal geçmişi yeniden yazılmaz.


[Gerçek bir kullanıcının sözleri]

Tam da bu konuda, alıcı Violette incelemesinde şunu yazdı (MQL5 incelemelerinden):

"Yenilemeden sonra geçmiş yeniden çizilse bile, bu kesinlikle bir sorun değil çünkü iki haftadır kesintisiz kâr ediyorum. Tavsiye ederim."

Gerçek zamanlı işlem yapan gerçek bir kullanıcı için yeniden hesaplama pratikte bir sorun değildir — sahadan gelen karar budur.


━━━━━━━━━━━━━━━━━━━━

TAKİP EDEN SL (TRAILING)

━━━━━━━━━━━━━━━━━━━━

Panel, 21MA tabanlı bir takip değeri gösterir. Kârı güvence altına almak için SL'nizi taşıyın. Elle uygulama.


━━━━━━━━━━━━━━━━━━━━

DAHA İYİ SONUÇLAR İÇİN ÜÇ KURAL

━━━━━━━━━━━━━━━━━━━━

1. Yalnızca M5 ve M15 yön konusunda uyuştuğunda işlem yapın

2. ★★ ve ★★★ üzerine odaklanın. ★ olanları atlayın veya minimum lot kullanın

3. Trend Range olduğunda atlayın. Trend yok = avantaj yok


━━━━━━━━━━━━━━━━━━━━

BU GÖSTERGENİN ARKASINDAKİ HİKÂYE — 12 YIL

━━━━━━━━━━━━━━━━━━━━

Onu satmak için yapmadım. İhtiyacım olduğu için yaptım. 12 yıl boyunca yalnızca altın işlemi. İki patlamış hesap. Her filtre eşiği gerçek parayla doğrulandı.


Kendi işlemlerimde her gün kullanıyorum. Şimdi sıra sizde.


━━━━━━━━━━━━━━━━━━━━

TEKNİK ÖZELLİKLER

━━━━━━━━━━━━━━━━━━━━

Platform: MetaTrader 5

Sembol: yalnızca XAUUSD

Zaman dilimleri: M5 ve M15

Önerilen spread: $1.0 veya altı


━━━━━━━━━━━━━━━━━━━━

SIKÇA SORULAN SORULAR

━━━━━━━━━━━━━━━━━━━━

S: FX döviz paritelerinde kullanabilir miyim? — Hayır. Yalnızca XAUUSD.

S: M30 veya H1'de kullanabilir miyim? — Hayır. Yalnızca M5 ve M15. Swing işlem istiyorsanız Gold Signal Swing Pro'ya (M30/H1/H4) bakın.

S: Parametreleri ayarlamam gerekir mi? — Varsayılanlar optimize edilmiştir. Yalnızca filtre seviyesi değiştirilebilir.

S: Hiç sinyal çıkmıyor? — Filtreler doğru çalışıyor. Uygun bir kurulumu bekleyin.

S: Yeniden çizer mi? — Gerçek zamanlı olarak çizmez. Beliren bir sinyalin girişi, TP'si ve SL'si anında sabitlenir. Yeniden uygulamak veya yeniden başlatmak geçmiş referans okları yeniden hesaplar, ancak bu işlem sonuçlarını etkilemez. Bildirilen sinyaller v7.20'de kaydedilir ve geri yüklenir.

S: Yeniden başlatınca sinyaller kaybolur mu? — Hayır. v7.20'den itibaren otomatik olarak kaydedilir ve geri yüklenir.

S: Kılavuz var mı? — Evet. Satın alma sonrası bana mesaj atın, PDF kılavuzunu ve AI Zone Radar hediyesini göndereyim.


━━━━━━━━━━━━━━━━━━━━

ÖMÜR BOYU LİSANS ALICI HEDİYESİ

━━━━━━━━━━━━━━━━━━━━

Ömür boyu lisansı satın alın ve aşağıdakileri ücretsiz alın:


- AI Zone Radar ($59 değerinde): 5 katmanlı güç puanlamasına sahip otomatik destek ve direnç dedektörü

- Eksiksiz PDF kılavuzu: kurulum ve işlem kurallarına dair eksiksiz bir rehber


Kiralamalar uygun değildir. Satın alma sonrası MQL5 üzerinden bana doğrudan mesaj atın, ikisini de göndereyim.

AI Zone Radar: https://www.mql5.com/en/market/product/175834


━━━━━━━━━━━━━━━━━━━━

ÜRÜN YELPAZESİ

━━━━━━━━━━━━━━━━━━━━

Bir MT4 sürümü de mevcuttur: https://www.mql5.com/en/market/product/170617


Ayrıca bir M30/H1/H4 swing sürümü de var — M5/M15'in yakalayamadığı daha büyük dalgaları yakalamak isteyenler için. Gold Signal Swing Pro (M30/H1/H4). İşlem başına $20–$80+ hedefleyin.

https://www.mql5.com/en/market/product/177643


━━━━━━━━━━━━━━━━━━━━

İNCELEMELER

━━━━━━━━━━━━━━━━━━━━

Bu göstergeyi faydalı bulursanız, lütfen bir inceleme bırakın. Geri bildiriminiz diğer yatırımcıların karar vermesine yardımcı olur.


━━━━━━━━━━━━━━━━━━━━

RİSK AÇIKLAMASI

━━━━━━━━━━━━━━━━━━━━

Bu, yatırım tavsiyesi değil, karar destek aracıdır. Geçmiş performans gelecekteki sonuçları garanti etmez. XAUUSD oldukça oynaktır ve büyük kayıplara yol açabilir. Yalnızca kaybetmeyi göze alabileceğiniz parayla işlem yapın. Düşük spreadli bir ortam şiddetle önerilir.
Değerlendirmeler 5
Yik Hung Lai
1187
Yik Hung Lai 2026.07.04 02:18 
 

i bought Gold Signal Pro with Auto TP SL and Gold Signal Swing Pro XAUUSD with Auto TP SL,very easy to use

Violette
660
Violette 2026.06.10 14:04 
 

I did buy a LOT of indicators of the market and they all went to the trash. This one is different because it's the first one which gives me good profit, i'm very satisfied of this indicator and the seller is very friendly. I for example had losses in my account because of an EA (which did go to the trash also) and within 1 week i did recover all thanks to this indicator, so thank you very much ! I must also say that even if the history repaints after refresh, it's absolutely not a problem as i'm continuesly doing profits since 2 weeks. I recommand.

jcasas311948 Casas
198
jcasas311948 Casas 2026.04.17 11:31 
 

El 18 de Abril del 2.026, alquile por un mes el indicador Gold Signal Pro with Auto TP SL y desde el primer momento, las señales fueron perfectas y el resultado de las primeras dos semanas fue espectacular: -Total de señales en el mercado de Londres y Nueva York = 110 -Total de señales en las que he entrado =57 - Operaciones positivas 55 (96,49%) - Resultados de los 9 días operados= 8.923$ RESULTADOS REALES 20/30- Abril 2.026 Total 9 dias Op. Total Señales Dia /Semana -177 100% Señales en M. Asiatico -67 38% S. en M. Londres + N.Y. -110 62% Señales de Venta -86 48,59% Señales de Compra -57 32,20% Solo mercado de London + NY Señales Buenas -77 70,00% Señales Malas -33 30,00% NO entrado -53 48,18% Entrado L/NY -57 51,82% Beneficio $ 9.313,85 Operaciones positivas -55 96,49% Perdida -$ 390,51 Operaciones Negativas -2 3,51% Resultado total SEMANA -$ 8.923,34 En la segunda semana pude constatar que el indicador tenia una serie de pequeñas incidencias en MT5 y se las manifesté al desarrollador, el cual en la actualización de hoy 7,13, parece que están todas superadas y mejorado el rendimiento en MT5. Por todo ello recomiendo este indicador Gold Signal Pro with Auto TP SL y yo confirmo que cuando venza el mes de alquiler , lo compraré definitivamente. Un saludo..... Atentamente: Jose Casas

Hoy domingo 17 de Mayo de 2026, confirmo que he adquirido la licencia de compra completa, espero recibir AI Zone Radar + manual PD.

Un saludo....... Atentamente: Jose Casas

Recibido.... Gracias.

Önerilen ürünler
Gösterge, tarihsel olanlarla karşılaştırılabilecek güncel teklifler oluşturur ve bu temelde bir fiyat hareketi tahmini yapar. Gösterge, istenen tarihe hızlı navigasyon için bir metin alanına sahiptir. Seçenekler: Sembol - göstergenin göstereceği sembolün seçimi; SymbolPeriod - göstergenin veri alacağı dönemin seçimi; GöstergeRenk - gösterge rengi; Ters - doğru tırnakları tersine çevirir, yanlış - orijinal görünüm; Sonraki, tarihi girebileceğiniz ve 'enter' tuşuna basarak hemen atlayab
Was: $249  Now: $99   Market Profile defines a number of day types that can help the trader to determine market behaviour. A key feature is the Value Area, representing the range of price action where 70% of trading took place. Understanding the Value Area can give traders valuable insight into market direction and establish the higher odds trade. It is an excellent addition to any system you may be using. Inspired by Jim Dalton’s book “Mind Over Markets”, this indicator is designed to suit the
The Horizontal Ray Tool is a lightweight, professional charting utility designed to streamline support and resistance mapping on MetaTrader 5. It brings rapid, one-click horizontal level placement directly to your live chart, eliminating the workspace clutter associated with infinite horizontal lines or manually drawn trendlines. Key Features: Interactive On-Screen Button: Spawns a clean, responsive "DRAW RAY" button docked directly on your chart canvas. A single click drops an independent hor
FREE
VOLUME PROFILE SAF-XII MT5 için Profesyonel Market Profile Analizi (Grid tarzı yatırımcılar için rüya indikatör) VOLUME PROFILE (HACİM PROFİLİ) NEDİR? Volume Profile, hacmi zamana göre gösteren geleneksel hacim indikatörlerinin aksine, belirli fiyat seviyelerindeki işlem faaliyetlerini görüntüleyen profesyonel bir kurumsal araçtır. Seçtiğiniz pencere içinde işlemlerin NEREDE gerçekleştiğini ortaya çıkararak şunları belirlemenize yardımcı olur: ADİL DEĞER ALANLARI (VAH/VAL) – İşlemlerin çoğunun
The "MR Volume Profile 5" indicator is a charting tool that displays trading volume at different price levels rather than time intervals. A key concept in volume profile is the point of control (POC)—the price level with the highest volume traded during the session or time range. While tools like VWAP or OBV provide volume trends, the "MR Volume Profile 5" indicator offers granular detail about where the most market activity occurs at specific price levels. This makes it a more precise tool for
Here   our more valuable tools SMC Trend Trading   ,  Easy SMC Trading  ,  Institutional SMC Architect Volume Analysis Tools  ,  Volume flow Profile  ,  Market volume profile  , FVG with Volume  , Liquidity Heatmap Profile  ,  Volume Spread Analysis 2. Key Features Dynamic Filtering : The core feature. As soon as the current price crosses a historical liquidity level, that level disappears. This reduces chart clutter and prevents you from trading off "dead" support/resistance. Liquidity Heatma
Master Edition, piyasa yapısını hacim ve para akışı merceğinden görselleştirmek için tasarlanmış profesyonel kalitede bir analiz aracıdır. Standart hacim göstergelerinin aksine, bu araç doğrudan grafiğinizde bir Günlük Hacim Profili görüntüleyerek, fiyat keşfinin tam olarak nerede gerçekleştiğini ve "akıllı paranın" nerede konumlandığını görmenizi sağlar. Bu Master Edition, netlik ve hız için tasarlanmıştır ve yüklendiğinde grafik düzeninizi anında güzelleştiren benzersiz bir Otomatik Tema Senkr
Blahtech Supply Demand MT5
Blahtech Limited
4.54 (13)
Was: $299  Now: $99  Supply Demand uses previous price action to identify potential imbalances between buyers and sellers. The key is to identify the better odds zones, not just the untouched ones. Blahtech Supply Demand indicator delivers functionality previously unavailable on any trading platform. This 4-in-1 indicator not only highlights the higher probability zones using a multi-criteria strength engine, but also combines it with multi-timeframe trend analysis, previously confirmed swings a
Boom Crash SMC
Israr Hussain Shah
Here   our more valuable tools SMC Trend Trading   ,  Easy SMC Trading  ,  Institutional SMC Architect Volume Analysis Tools  ,  Volume flow Profile  ,  Market volume profile  , FVG with Volume  , Liquidity Heatmap Profile  ,  Volume Spread Analysis Deriv boom and crash index spike killer system you can use it only on m5 timeframe  follow the structure and get signal with alert on phone open trade set sl tp and enjoy easy analysis and trading made simple 
Here   our more valuable tools SMC Trend Trading   ,  Easy SMC Trading  ,  Institutional SMC Architect Volume Analysis Tools  ,  Volume flow Profile  ,  Market volume profile  , FVG with Volume  , Liquidity Heatmap Profile  ,  Volume Spread Analysis The    Liquidity Heatmap   is a sophisticated institutional trading tool designed to reveal where over-leveraged traders are trapped. By calculating estimated liquidation levels based on volume spikes and leverage, this indicator draws a dynamic "h
BoxChart MT5
Evgeny Shevtsov
5 (7)
The market is unfair if only because 10% of participants manage 90% of funds. An ordinary trader has slim changes to stand against these "vultures". This problem can be solved. You just need to be among these 10%, learn to predict their intentions and move with them. Volume is the only preemptive factor that faultlessly works on any timeframe and symbol. First, the volume appears and is accumulated, and only then the price moves. The price moves from one volume to another. Areas of volume accumu
PriceMagnet Volume Profile Stop guessing where the smart money is sitting. See it. PriceMagnet Volume Profile is a precision volume-analysis indicator built for MetaTrader 5 traders who want to trade with institutional context instead of guesswork. Rather than plotting volume as a flat bar under your chart, PriceMagnet reconstructs a full horizontal volume histogram directly on price — showing you exactly which price levels attracted the most trading activity over your selected lookback window,
This Volume Delta Profile is an advanced MetaTrader 5 indicator that visualizes   volume delta (order flow imbalance)   using a volume profile-style histogram. It shows the difference between buying and selling pressure at specific price levels, helping traders identify supply and demand zones. This indicator provides a unique perspective on market dynamics by visualizing the imbalance between buying and selling pressure, offering insights beyond traditional volume analysis. Core Concept Positiv
VR Grid Mt5
Vladimir Pastushak
3.25 (8)
VR Izgara göstergesi, kullanıcı tanımlı ayarlarla grafiksel bir ızgara oluşturmak için tasarlanmıştır . Standart ızgaradan farklı olarak, VR Izgarası dairesel seviyeler oluşturmak için kullanılır. Kullanıcının seçimine bağlı olarak tur seviyeleri arasındaki adım isteğe bağlı olabilir. Ek olarak, diğer göstergeler ve yardımcı programlardan farklı olarak VR Grid, zaman dilimi değiştiğinde veya terminal yeniden başlatıldığında bile ızgaranın konumunu korur . Ayarlar, set dosyaları, demo versiyonlar

FREE
Turkish Bu indikatör, Grafik Formasyonları (Chart Patterns) ile işlem yapmayı seven yatırımcılar için gelişmiş bir grafik analiz asistanı olarak işlev görür. Görsel analiz yükünü azaltmak ve kâr elde etmede doğruluğu artırmak için tasarlanmıştır. Pratik kullanım açısından bu indikatörün temel özellikleri: 1. Otomatik Formasyon Tespiti (Automated Pattern Detection) Zaman kazandırır ve önyargıyı (Bias) azaltır: Trend çizgilerini manuel olarak çizmenize gerek kalmaz. İndikatör, fiyat dalgalanmaları
VibeFox Volume Profile — MetaTrader 5 için Volume Profile VibeFox Volume Profile, MetaTrader 5 için eksiksiz bir Volume Profile araç setidir. İşlem gören hacmin fiyat boyunca yatay dağılımını oluşturur, böylece piyasanın en çok nerede aktivite gösterdiğini, nerede ince işlem yaptığını ve hangi fiyat seviyelerinin mıknatıs veya bariyer gibi davranma olasılığı olduğunu anında görürsünüz. Her profil doğrudan grafiğin üzerine çizilir ve modern, fareyle kontrol edilen bir panelden yönetilir — eşelene
Smart DOM Tick Flow; uyarlanabilir SmartDOM, tik akışı analizi, fiyat hareketinin spektral değerlendirmesi, piyasa aktivite seviyeleri ve işlem sinyallerinin çok katmanlı onayını bir araya getiren, özel olarak geliştirilmiş bir gün içi göstergedir. Göstergenin merkezinde SmartDOM bulunur: fiyat dengesindeki hareketi ve aktivitenin fiyat seviyelerine dağılımını gösteren dinamik bir harita. Yalnızca fiyat hareketinin yönünü değil, mevcut piyasa müzayedesinin iç yapısını da görmeye yardımcı olur:

Here   our more valuable tools SMC Trend Trading   ,  Easy SMC Trading  ,  Institutional SMC Architect Volume Analysis Tools  ,  Volume flow Profile  ,  Market volume profile  , FVG with Volume  , Liquidity Heatmap Profile  ,  Volume Spread Analysis Transform Your Trading with Intelligent Market Insights! The 2025 Spike Killer Dashboard is a powerful MQL5 indicator that combines cutting-edge signal generation with an intuitive crystal dashboard for real-time market analysis. Designed for tra
Delta Profile Volume
Teresinha Moraes Correia
Technical Description of the Indicator – Delta Profile for MetaTrader 5 The Delta Profile is an indicator developed for MetaTrader 5 focused on detailed analysis of volume flow within a defined range of candles. It organizes and displays information about the imbalance of positive volumes (associated with upward movements) and negative volumes (associated with downward movements) at different price levels. The result is a clear view of the chart points where the highest concentration of trades o
ONNYX INDICATOR sürüm 1.14 MetaTrader 5 için onaylanmış ve yeniden boyanmayan sinyallere sahip arz-talep göstergesidir. Onaylı salınımları belirler, bölge genişliğini ATR ile ayarlar, kaliteyi yüzde olarak gösterir ve kapanmış mumlarda BUY/SELL okları çizer. TEMEL ÖZELLİKLER - Bölge içinde yüzde kalite puanı bulunan arz-talep bölgeleri. - Mum kapanışından sonra büyütülmüş BUY/SELL okları. - İsteğe bağlı EMA trend filtresi ve mum reddi onayı. - Trend, fiyat seviyeleri ve piyasa bağlamı paneli. -
TradeAQ
Guo Sheng Zhao
LuoMo Volume & Price Structure 8.98 A multi-function chart indicator for   MetaTrader 4 and MetaTrader 5 , designed to display key volume, volatility, sentiment, and price-structure information directly on the main chart. Main Features Volume and price-based Support & Resistance Volume spike and exhaustion signals ATR volatility expansion alerts Volume Profile with HVN and LVN Bullish and bearish sentiment distribution Developing or fixed POC VAH and VAL levels Supply and Demand zones Volume-wei
Haven Volume Profile
Maksim Tarutin
4.58 (12)
Haven Volume Profile, ticaret hacminin dağılımına dayalı olarak önemli fiyat seviyelerini belirlemeye yardımcı olan çok fonksiyonlu bir hacim profili analiz göstergesidir. Piyasayı daha iyi anlamak ve önemli giriş ve çıkış noktalarını belirlemek isteyen profesyonel yatırımcılar için tasarlanmıştır. Diğer Ürünler ->  BURADAN Temel Özellikler: Point of Control (POC) Hesaplama - en yüksek ticaret aktivitesinin gerçekleştiği seviye, en likit seviyeleri belirlemeye yardımcı olur Value Area (yüksek ak
FREE
Before installing the HeatMap indicator make sure you are using a broker that gives you access to the Depth of market (DOM) !! This indicator creates a heatmap on your chart allowing you to see the buy or sell limit orders easily and in real time. You have the possibility to change the setting and the colors of the HeatMap in order to adapt to all markets and all charts. Here is an example of a setting you can use with the NASDAQ100 on the AMPGlobal broker :  https://www.youtube.com/watch?v=x0Y
Market Structure, Liquidity and Price Action Analysis for MetaTrader 5 A chart can contain plenty of information and still leave a trader without a clear decision. A BOS label may appear, liquidity may be nearby, and an order block may remain active, yet the real challenge is understanding how those elements relate to one another. ICT Yoshi Pro organizes that process into a cleaner, more disciplined MetaTrader 5 workflow. What ICT Yoshi Pro Does ICT Yoshi Pro is a manual decision-support indicat
PivotWave
Jeffrey Quiatchon
Introducing PivotWave – your ultimate trading companion that redefines precision and market analysis. Designed with traders in mind, PivotWave is more than just an indicator; it’s a powerful tool that captures the pulse of the market, identifying key turning points and trends with pinpoint accuracy. PivotWave leverages advanced algorithms to provide clear visual signals for optimal entry and exit points, making it easier for traders to navigate volatile market conditions. Whether you are a begin
What if you could finally SEE where the market really wants to go? Most traders watch price. Pros watch VOLUME — where the money was actually traded. Volume Profile Fibo Confluence puts that reading right in front of you, in plain language, no jargon. WHAT YOU SEE ON YOUR CHART • The POC, the most-traded price: the market's natural magnet • The value area (VAH / VAL): the "house" where price spends its time • Automatic Fibonacci retracement + the golden pocket • Low-volume nodes
RSI Currency Strength Meter is a powerful and elegant multi-currency indicator that measures the real-time relative strength of the 8 major currencies using RSI logic. By calculating the smoothed performance of each currency across its major pairs and applying the RSI formula, it delivers clean and responsive strength lines that make it easy to spot which currencies are truly strong or weak at any moment. This indicator is particularly useful for visualizing currency correlations and divergence
Gioteen Volatility Index (GVI) - your ultimate solution to overcoming market unpredictability and maximizing trading opportunities. This revolutionary indicator helps you in lowering your losing trades due to choppy market movements. The GVI is designed to measure market volatility, providing you with valuable insights to identify the most favorable trading prospects. Its intuitive interface consists of a dynamic red line representing the volatility index, accompanied by blue line that indicate
Market Profile Heat indicator  — is a classic Market Profile implementation that can show the price density over time, outlining the most important price levels, value area, and control value of a given trading session. This indicator can be attached to timeframes between M1 and D1 and will show the Market Profile for daily, weekly, monthly, or even intraday sessions. Lower timeframes offer higher precision. Higher timeframes are recommended for better visibility. It is also possible to use a fr
Spike Blast Pro
Israr Hussain Shah
Here   our more valuable tools SMC Trend Trading   ,  Easy SMC Trading  ,  Institutional SMC Architect Volume Analysis Tools  ,  Volume flow Profile  ,  Market volume profile  , FVG with Volume  , Liquidity Heatmap Profile  ,  Volume Spread Analysis Spike Blaster Pro is a next-generation MT5 indicator designed specifically for synthetic markets. It works seamlessly on Boom Index and Weltrade Index , providing traders with sharp, reliable spike detection signals. What makes Spike Blaster Pro po
Bu ürünün alıcıları ayrıca şunları da satın alıyor
Neuro Poseidon MT5
Daria Rezueva
4.85 (54)
Neuro Poseidon is a new indicator by Daria Rezueva. It combines precise trading signals with adaptive TP/SL levels - creating best possible trades as a result! Message me and get  Neuro Poseidon Assistant  as a gift to automize your trading process! What makes it stand out? 1. Proven profitability on all assets and timeframes 2. Only confirmed BUY and SELL signals present on the chart 3. Adaptive TP & SL levels generated by the software for each trade 4. Easy to understand - suitable for al
UZFX {SSS} Scalping Smart Signals v4.0 MT5, hızlı hareket eden piyasalarda doğru ve gerçek zamanlı sinyaller bekleyen scalperlar, günlük işlemciler ve swing işlemciler için tasarlanmış, yeniden çizilmeyen yüksek performanslı bir işlem göstergesidir. (UZFX-LABS) tarafından geliştirilen bu gösterge, fiyat hareketi analizi, trend teyidi ve akıllı filtrelemeyi bir araya getirerek tüm döviz çiftleri ve zaman dilimlerinde yüksek olasılıklı alım ve satım sinyalleri, Uyarı Sinyalleri ve Trend Devam Fırs
The Oracle Pro
Ottaviano De Cicco
5 (1)
The Oracle Pro: Synthetic Multi-Timeframe Bias Engine for MT5 ️ Summer Launch Offer — Get The Oracle Pro for USD 199 (early buyers). Price rises with traction; final price USD 399. The Oracle Pro is a premium multi-timeframe bias engine for MetaTrader 5, built for demanding and professional traders. It answers one question with discipline: what is the directional bias on each timeframe right now, how strong is it, and how much do the timeframes agree? Everything is computed on closed bars only
ARICoins
Temirlan Kdyrkhan
ARICoin is a powerful trading companion designed to generate high-probability entry signals with dynamic TP/SL/DP levels based on volatility. Built-in performance tracking shows win/loss stats, PP1/PP2 hits, and success rates all updated live. Key Features: Buy/Sell signals with adaptive volatility bands Real-time TP/SL/DP levels based on ATR Built-in MA Filter with optional ATR/StdDev volatility Performance stats panel (Success, Profit/Loss, PP1/PP2) Alerts via popup, sound, push, or email Cust
Azimuth Pro
Ottaviano De Cicco
5 (7)
Azimuth Pro V2: Synthetic Fractal Structure and Confirmed Entries for MT5 Overview Azimuth Pro is a multi-level swing structure indicator by Merkava Labs . Four nested swing layers, swing-anchored VWAP, ABC pattern detection, three-timeframe structural filtering, and closed-bar confirmed entries — one chart, one workflow from micro-swings to macro-cycles. This is not a blind signal product. It is a structure-first workflow for traders who care about location, context, and timing. ️ Summer Sale
ZAB Supply Demand MTF automatically detects institutional supply and demand zones across up to 9 timeframes and draws them directly on your chart. Based on Sam Seiden's methodology, this indicator identifies the exact zones where banks and institutions placed their orders. Why This Indicator? Unlike basic support/resistance tools, ZAB Supply Demand MTF classifies every zone by its formation pattern and merges overlapping zones from different timeframes into high-probability confluence areas. Key
Ziva LSE Pro
Hassan Abdullah Hassan Al Balushi
ZIVA LSE Pro: Trade the Flow, Not the Noise ZIVA LSE Pro was developed around a simple belief: professional traders do not need more random signals; they need better context. This workflow reflects the ZIVA approach to filtering market noise and focusing on the liquidity and structural mechanics that influence price behavior. Most indicators treat the market like a static picture. ZIVA LSE Pro is built to read it as a dynamic environment where liquidity, structure, volatility, and execution con
Gem SIGNAL
Shengzu Zhong
5 (1)
GEM Signal Pro GEM Signal Pro, MetaTrader 5 için geliştirilmiş bir trend takip göstergesidir ve daha net sinyaller, daha düzenli işlem kurulumları ve daha pratik risk yönetimini doğrudan grafik üzerinde görmek isteyen yatırımcılar için tasarlanmıştır. Sadece basit bir ok göstermek yerine, GEM Signal Pro işlem fikrinin tamamını daha temiz ve daha okunabilir bir şekilde sunmaya yardımcı olur. Koşullar onaylandığında, gösterge giriş fiyatını, stop loss seviyesini ve take profit hedeflerini grafik ü
PrimeScalping
Temirlan Kdyrkhan
PrimeScalping is a powerful trading companion designed to generate high-probability entry signals with dynamic TP/SL/DP levels based on volatility. Built-in performance tracking shows win/loss stats, PP1/PP2 hits, and success rates — all updated live. Key Features: Buy/Sell signals with adaptive volatility bands Real-time TP/SL/DP levels based on ATR Built-in MA Filter with optional ATR/StdDev volatility Performance stats panel (Success, Profit/Loss, PP1/PP2) Alerts via popup, sound, push, or e
RelicusRoad Pro MT5
Relicus LLC
4.96 (24)
RelicusRoad Pro: Kantitatif Piyasa İşletim Sistemi ÖMÜR BOYU ERİŞİMDE %70 İNDİRİM (SINIRLI SÜRE) - 2.000+ TRADER'A KATILIN Neden çoğu trader "mükemmel" indikatörlere rağmen başarısız olur? Çünkü tekil kavramları boşlukta trade ederler. Bağlamı olmayan bir sinyal kumardır. Sürekli kazanmak için KONFLÜANS (UYUM) gerekir. RelicusRoad Pro basit bir ok indikatörü değildir. Tam bir Kantitatif Piyasa Ekosistemi dir. Tescilli volatilite modellemesini kullanarak fiyatın ilerlediği "Adil Değer Yolu"nu har
Introducing the South African Sniper Indicator Created by a dedicated team of South African traders with years of profitable experience in the financial markets, the South African Sniper Indicator is designed to give traders a sharp edge — combining simplicity, precision, and power in one tool. This is a plug-and-play indicator for MT5, built to deliver accurate BUY and SELL (Sniper Entry) signals — complete with target levels and automated trailing stops. Whether you trade forex, indice
TrendMaestro5
Stefano Frisetti
note: this indicator is for METATRADER4, if you want the version for METATRADER5 this is the link:  https://www.mql5.com/it/market/product/108106 TRENDMAESTRO ver 2.5 TRENDMAESTRO recognizes a new TREND from the start, he never makes mistakes. The certainty of identifying a new TREND is priceless. DESCRIPTION TRENDMAESTRO identifies a new TREND in the bud, this indicator examines the volatility, volumes and momentum to identify the moment in which there is an explosion of one or more of these da
OrderFlow Absorption – MT5 için Profesyonel Delta ve Absorpsiyon Sinyal Göstergesi OrderFlow Absorption ile gerçek emir akışı analizinin gücünü keşfedin – MetaTrader 5 için nihai delta histogramı ve absorpsiyon sinyal göstergesi. Fiyat hareketlerinin arkasında gerçekte neler olduğunu görmek isteyen traderlar için tasarlanan bu araç, piyasayı hareket ettiren gizli alım/satım baskısını ve absorpsiyon olaylarını ortaya çıkarır. Özellikler Delta Histogramı Görselleştirme:   Alım ve satım baskısını a
SmartScalping
Temirlan Kdyrkhan
SmartScalping is a powerful trading companion designed to generate high-probability entry signals with dynamic TP/SL/DP levels based on volatility. Built-in performance tracking shows win/loss stats, PP1/PP2 hits, and success rates — all updated live. Key Features: Buy/Sell signals with adaptive volatility bands Real-time TP/SL/DP levels based on ATR Built-in MA Filter with optional ATR/StdDev volatility Performance stats panel (Success, Profit/Loss, PP1/PP2) Alerts via popup, sound, push, or e
ScalpPoint
Temirlan Kdyrkhan
ScalpPoint is a powerful trading companion designed to generate high-probability entry signals with dynamic TP/SL/DP levels based on volatility. Built-in performance tracking shows win/loss stats, PP1/PP2 hits, and success rates — all updated live. Key Features: Buy/Sell signals with adaptive volatility bands Real-time TP/SL/DP levels based on ATR Built-in MA Filter with optional ATR/StdDev volatility Performance stats panel (Success, Profit/Loss, PP1/PP2) Alerts via popup, sound, push, or emai
KT Alpha Hunter Arrows MT5
KEENBASE SOFTWARE SOLUTIONS
Çoğu ok göstergesi size yalnızca bir sinyal verir ve geri kalan her şeyi sizin çözmenizi bekler. KT Alpha Hunter Arrows ise size tam bir işlem planı sunar. Her sinyal oku, hazır çizilmiş tam bir planla birlikte görünür: giriş çizgisi, stop loss, dört take profit seviyesi ve bu sembol ile zaman diliminin o anda işlem yapmaya değer olup olmadığını gösteren canlı edge değerlendirmesi. Dahil edilen Trade Manager EA, siz işleme girdikten sonra yönetimi üstlenir. Böylece piyasa gürültülü ve stresli ha
TrendProMaster
Temirlan Kdyrkhan
MasterTrend Indicator for MT5 A powerful trend-following and signal-evaluation tool MasterTrend   is a custom MT5 indicator that combines Moving Averages and ATR-based risk/reward logic to generate clear buy/sell signals. It visualizes dynamic SL/TP levels, evaluates past trade outcomes, and displays win/loss statistics in a clean on-chart panel. Key features include: Buy/Sell signals based on MA crossovers ATR-based SL/TP1/TP2/TP3 levels with visual lines and labels Signal outcome tracking wit
ARIPoint
Temirlan Kdyrkhan
1 (1)
ARIPoint is a powerful trading companion designed to generate high-probability entry signals with dynamic TP/SL/DP levels based on volatility. Built-in performance tracking shows win/loss stats, PP1/PP2 hits, and success rates all updated live. Key Features: Buy/Sell signals with adaptive volatility bands Real-time TP/SL/DP levels based on ATR Built-in MA Filter with optional ATR/StdDev volatility Performance stats panel (Success, Profit/Loss, PP1/PP2) Alerts via popup, sound, push, or email Cu
MasterTrend
Temirlan Kdyrkhan
MasterTrend Indicator for MT5 A powerful trend-following and signal-evaluation tool MasterTrend   is a custom MT5 indicator that combines Moving Averages and ATR-based risk/reward logic to generate clear buy/sell signals. It visualizes dynamic SL/TP levels, evaluates past trade outcomes, and displays win/loss statistics in a clean on-chart panel. Key features include: Buy/Sell signals based on MA crossovers ATR-based SL/TP1/TP2/TP3 levels with visual lines and labels Signal outcome tracking wit
Naked Forex Tweezer Pro Indicator Tweezer Pro Indicator is a pattern recognition indicator for Forex, Stocks, Indices, Futures, Commodities and Cryptos. The standard Tweezer is a two bar pattern. Our enhanced version is a multi-bar pattern. We filter the patterns for you so that you only get the     best and most effective patterns   and ignore the noise. The Tweezer pattern is a simple and effective pattern to trade. The strategy that comes with the Tweezer is based on price action. The Twe
Göstergemiz, piyasada ilgi gösterilen bölgeleri vurgular ve ardından emir birikim bölgelerini gösterir. Büyük ölçekli bir emir defteri (order book) gibi çalışır. Bu, büyük sermaye için geliştirilmiş bir göstergedir. Performansı olağanüstüdür. Piyasada ne tür bir ilgi olursa olsun, onu görürsünüz . (Bu, tamamen yeniden yazılmış ve otomatikleştirilmiş bir versiyondur – artık manuel analiz gerekmez.) İşlem Hızı (Transaction Speed) , piyasada büyük emirlerin nerede ve ne zaman biriktiğini gösteren v
AriX
Temirlan Kdyrkhan
1 (4)
AriX Indicator for MT5 A powerful trend-following and signal-evaluation tool AriX is a custom MT5 indicator that combines Moving Averages and ATR-based risk/reward logic to generate clear buy/sell signals. It visualizes dynamic SL/TP levels, evaluates past trade outcomes, and displays win/loss statistics in a clean on-chart panel. Key features include: Buy/Sell signals based on MA crossovers ATR-based SL/TP1/TP2/TP3 levels with visual lines and labels Signal outcome tracking with real-time stat
MetaTrader 5 için Akıllı Çok Katmanlı Kırılım ve Geri Çekilme Dedektörü "Akıllı, Basit, Hızlı!" Yüksek olasılıklı kırılım girişlerini kaçırmaktan bıktınız mı? Kırılımları trend yönü ve para birimi momentumuyla hizalamaya çalışarak birden fazla grafiği saatlerce tarayıp — yine de hareketi kaçırıyor musunuz? Break Pullback, tüm bunları tek bir göstergede çözüyor. Break Pullback Nedir? Break Pullback, piyasa yapısı, kırılım ve trend devamı kurulumlarında işlem yapan yatırımcılar için özel olarak
Quant Direction MT5
Georgios Kalomoiropoulos
Quant Direction, 3 boyutlu bir piyasa analiz aracıdır. Çeşitli parametrelerdeki yüzdesel sapmaları hassas bir şekilde hesaplayan, tamamen objektif, algoritma tabanlı piyasa analizi sunar. Gelişmiş yapay zeka tabanlı modelleme araçları kullanılarak geliştirilen ve titizlikle test edilen bu algoritma, piyasayı benzersiz bir hassasiyetle analiz eder. Platformda herhangi bir döviz çiftini veya finansal enstrümanı analiz edebilirsiniz. İster kısa vadeli, ister günlük, isterse swing trading yapın, Qua
Piyasanın Gerçekte Ne Yaptığını Görün.   3 piyasa evresini gözünüzün önünde canlı izleyin (Sıkışma, Genişleme, Trend) ve Trend evresinin erken aşamasında daha iyi   girişler yapın.      Tahmin etmeyi bırakın. Piyasayı kurumların ve akıllı paranın okuduğu gibi okumaya başlayın.   MT5 için Apex Market Structure Pro, gürültüyü ayıklayan ve her mumun altındaki gerçek yapıyı gösteren hassas bir akıllı para   analiz aracıdır: likidite, yapı değişimleri, birikim bölgeleri ve trend eğilimi — hepsi tek
OmniSync Projection
Antonio-alin Teculescu
5 (1)
Chronos Fractal Engine is an innovative price projection indicator for MetaTrader 5, designed to transform your technical analysis by intelligently identifying and projecting historical price patterns. Built upon an advanced correlation algorithm and the fractal principles of the market, this powerful tool visualizes potential future price movements, giving you a unique edge in your trading decisions. What is Chronos Fractal Engine? At its core, the Chronos Fractal Engine employs a sophisticat
Presenting one-of-a-kind Gann Indicator for XAUUSD IQ Gold Gann Levels is a non-repainting, precision tool designed exclusively for XAUUSD intraday trading. It uses W.D. Gann’s square root method to plot real-time support and resistance levels, helping traders spot high-probability entries with confidence and clarity. William Delbert Gann (W.D. Gann) was an exceptional market analyst whose trading technique was based on a complex blend of mathematics, geometry, astrology, and ancient calculation
Meravith MT5
Ivan Stefanov
5 (3)
Göstergе, herhangi bir noktadan hacmi analiz eder ve bu hacim için piyasanın tükeniş seviyelerini hesaplar. Meravith’in ana çizgileri: Boğa hacim tükeniş çizgisi – hedef olarak kullanılır. Ayı hacim tükeniş çizgisi – hedef olarak kullanılır. Trend çizgisi – piyasa trendini gösterir. Piyasanın boğa mı ayı mı olduğuna bağlı olarak rengi değişir ve trend desteği görevi görür. Nasıl kullanılır: Mor dikey çizgiye çift tıklayın ve istediğiniz konuma taşıyın. Her şeyi analiz edebilirsiniz – trendleri v
WaveSniper
Alessandro Farinella
Wave Sniper One indicator. Adaptive baseline, multi-layer signal engine, and closed-bar confirmed entries — designed for traders who want precision without complexity. I tried to build the perfect indicator. I ended up deleting most of them. I used, studied and coded hundreds of indicators. I analyzed and converted entire libraries from PineScript, ProRealCode, EasyLanguage, MQL. Oscillators, moving averages, bands, candlestick pattern: you name it! I spent weeks, even months optimizing param
Merhaba yatırımcılar! Birçok bireysel yatırımcı yavaş web komut dosyaları kullanıyor. Kârlı işlem yapmak için sistematik bir yaklaşım şarttır. Astro AI göstergesi sadece bir grafik üzerindeki görselleştirme değildir. Doğrudan terminal içinde çalışan iki ajandan oluşan gelişmiş bir sinir ağıdır. Sistemin teknik detayları: 1. Ajan 1: Analist (Grafiksel Sinir Ağı – GNN) Piyasa, tek tek fiyat çubuklarından değil, birbirine bağlı verilerden oluşan bir ağdan oluşur. İşlev: Ajan 1, bu karmaşık, d
Yazarın diğer ürünleri
KURAMA GOLD SIGNAL PRO (MT4) — 7 Katmanlı Filtre, Otomatik TP/SL, Kalite Puanı ve Sinyal Geçmişi Kaydı | Eksiksiz XAUUSD Ticaret Sistemi Gerçek zamanlı olarak yeniden çizmez. Bir sinyal belirdiği anda ok, giriş, TP ve SL anında sabitlenir ve sonradan hareket etmez. Sizin işlem yaptığınız şey bu gerçek zamanlı sinyaldir. Ve v7.20'de, gerçekten gönderilen her sinyal otomatik olarak kaydedilir ve yeniden başlatmanın ardından olduğu gibi geri yüklenir. ALICILARA ÖZEL HEDİYE
Gold Signal Swing Pro XAUUSD with Auto TP SL (MT4) — XAUUSD Swing Trading için 7 Katmanlı Filtre + RR Garanti Sistemi Yeniden çizme yok. Yeniden çizim yok. Gecikme yok. Tüm sinyaller onaydan sonra kilitlenir. Alıcılar için bonus: Outright lisans satın aldığınızda AI Zone Radar ($59 değerinde) + PDF kılavuzu ücretsiz. Satın aldıktan sonra MQL5'te bana mesaj gönderin. AI Zone Radar: https://www.mql5.com/en/market/product/175834 MT5 sürümü de mevcut: https://www.mql5.com/en/market/product/170916?so
Gold Signal Swing Pro XAUUSD with Auto TP SL — XAUUSD Swing Trading için 7 Katmanlı Filtre + RR Garanti Sistemi Yeniden çizme yok. Yeniden çizim yok. Gecikme yok. Tüm sinyaller onaydan sonra kilitlenir. Alıcılar için bonus: Outright lisans satın aldığınızda AI Zone Radar ($59 değerinde) + PDF kılavuzu ücretsiz. Satın aldıktan sonra MQL5'te bana mesaj gönderin. AI Zone Radar: https://www.mql5.com/en/market/product/175834 MT4 sürümü de mevcut: https://www.mql5.com/ja/market/product/177778?source=S
AI Zone Radar — 5 Katmanlı Puanlama ile Akıllı Destek ve Direnç Tespiti Manuel olarak çizgi çizmeyi bırak. AI Zone Radar gerçekten önemli olan destek ve direnç bölgelerini otomatik olarak tespit eder — ve özel 5 katmanlı algoritma kullanarak her birini 1'den 5'e kadar puanlar. "Fiyat nerede dönecek?" — AI Zone Radar buna tahminle değil, sayılarla cevap verir. NEDEN BU FARKLI Çoğu destek/direnç indikatörü her sallanım yüksek ve düşüğüne çizgi çizer. Hangilerinin önemli olduğunu söylemeni
EA'nız NEDEN kazandığını açıklayabiliyor mu? Çoğu EA size yalnızca sonuç verir. Kazandı, kaybetti, bakiye arttı, bakiye düştü. Neden girdi, şimdi neden girmiyor, hangi sinyal türü SİZİN hesabınızda gerçekten kazanıyor — asla bilemezsiniz. Sadece çalıştırır ve umut edersiniz. KURAMA GOLD SWING AUTO temelden farklıdır. [Bu EA'yı farklı kılan tek şey] Bu EA, SİZİN hesabınızda hangi sinyallerin kazandığını izler — ve size söyler. Her sinyal otomatik olarak derecelendirilir: S / A / B / . Her
Filtrele:
Yik Hung Lai
1187
Yik Hung Lai 2026.07.04 02:18 
 

i bought Gold Signal Pro with Auto TP SL and Gold Signal Swing Pro XAUUSD with Auto TP SL,very easy to use

Genki Andou
746
Geliştiriciden yanıt Genki Andou 2026.07.05 08:54
Thank you so much for the review, and for choosing both the scalping and swing versions! I'm really glad you find them easy to use — that's exactly what I aim for. If you ever have questions as you trade, feel free to reach out anytime. Happy trading!
Violette
660
Violette 2026.06.10 14:04 
 

I did buy a LOT of indicators of the market and they all went to the trash. This one is different because it's the first one which gives me good profit, i'm very satisfied of this indicator and the seller is very friendly. I for example had losses in my account because of an EA (which did go to the trash also) and within 1 week i did recover all thanks to this indicator, so thank you very much ! I must also say that even if the history repaints after refresh, it's absolutely not a problem as i'm continuesly doing profits since 2 weeks. I recommand.

Genki Andou
746
Geliştiriciden yanıt Genki Andou 2026.06.10 22:53
Thank you so much for this wonderful review, Violette! I'm truly happy to hear you recovered your losses within a week and have been consistently profitable for two weeks now. That's exactly the kind of result I built this tool for. And I really appreciate you pointing out that the recalculation on refresh is not a problem in real trading — as an active, profitable user, your perspective means a lot. Keep up the disciplined trading, and feel free to reach out anytime if you have questions. Wishing you continued success!
404 strategy not found
568
404 strategy not found 2026.06.02 13:57 
 

I want to open with the concerns, as these are the most material considerations for any prospective buyer.

The most significant issue is that the indicator panel does not display in backtests. This is a meaningful limitation, because it prevents buyers from assessing the true hit-rate prior to purchase. When the indicator is first applied to the chart, a number of past losing trades are removed and excluded from the count, which inflates the displayed performance. Only a forward test conducted after purchase reveals the actual results. In my case, the win-rate settled closer to 55–60%, materially below the 80%+ the panel initially suggests. This is a poor practice and, at minimum, creates a misleading impression of performance.

A second concern is that the variable settings in the input tab are non-functional. Adjusting them produces no change in the signals. The developer has explained that the logic is entirely internal, which raises the question of why the input tab presents these parameters as adjustable when they are, in fact, fixed. There is also an inconsistency whereby removing and reapplying the indicator causes some entries to disappear; if left running without reloading, the signals remain stable. Collectively, these issues call into question how mature and transparent the strategy actually is, and prospective users should be prepared to apply additional indicators to filter the signals.

To be clear, I do not consider this a scam, and I have no direct evidence of bad faith on the part of the author. That said, the combination of inflated backtest figures, non-functional inputs, and a performance panel that flatters early results does give the product the appearance of one, and buyers should evaluate it on that basis rather than on the initial numbers.

On the positive side, the strategy does have merit. The chart displays TP and SL levels, which makes execution straightforward. The developer was responsive and provided support promptly when required. As with any strategy, results depend on discipline, practice, and adherence to the manual. I will update this review if the situation changes.

Genki Andou
746
Geliştiriciden yanıt Genki Andou 2026.06.02 21:30
Thank you for the fair and thoughtful review, Gerard. You've understood the indicator perfectly: signals never disappear during live trading — only on a full reload (remove/re-add, timeframe switch, restart). I'd like to explain why this is a deliberate design choice rather than a bug. The indicator fires signals in real-time, the moment price touches an MA during bar formation — not waiting for the candle to close. This is what lets you enter early, before price runs toward TP. The tradeoff is that real-time signals cannot perfectly match a recalculation, which only sees completed bar data after the fact. To make historical signals 100% fixed, I would have to delay every signal until the candle closes — meaning entries come 5 minutes late on M5, often after price has already moved. I made this choice deliberately: I wanted to build an indicator that actually helps users win in live trading, not one that simply looks perfect in hindsight. Real-time entries are what make money. As you said — let it run, and no signals disappear. Thank you for trading with discipline and for the kind words about support. Wishing you continued success!
khkh14
273
khkh14 2026.06.02 03:06 
 

**Repaints despite being advertised as "No Repaint."** Purchased based on the explicit claim: "No repaint. No redraw. Every signal stays fixed once confirmed." After testing, I found that historical arrows changed after a simple chart reload (changing timeframe and changing back). The seller later confirmed that historical signals can change after recalculation. This directly contradicts the product description. A signal that changes after recalculation is not "fixed once confirmed." The actual behavior was not clearly disclosed and was a key factor in my purchase decision. Had the true behavior been disclosed before purchase, I would not have bought this indicator.

*** BELOW IS THE REPLY to AUTHOR'S COMMENT***

Your explanation confirms that historical signals are recalculated and can change after a reload.

That is precisely the problem.

In my testing, the recalculated chart appeared to contain fewer losing signals and a higher-quality signal history than what was originally displayed. This creates the impression of a much better-performing indicator than what traders actually experienced in real time.

If historical signals are modified after the fact, then any win rate, signal history, or performance statistics derived from those signals become unreliable because they are based on hindsight-adjusted results.

Calling this "recalculation" instead of "repainting" does not change the underlying fact that historical signals are not fixed and can change after the event.

A signal that can disappear or change after it has been plotted is not "fixed once confirmed."

Genki Andou
746
Geliştiriciden yanıt Genki Andou 2026.06.02 03:49
Thank you for your feedback. To be clear for anyone reading this: the indicator does NOT repaint during live trading. Once a signal appears on the current bar, it stays fixed. This is verified by all active users, including one who achieved a 96.49% win rate over 57 trades in 9 days of live trading. What the reviewer describes is recalculation behavior that occurs when the indicator is reloaded from scratch (chart refresh, timeframe switch, MT restart). This resets internal cooldown counters and can produce slightly different signals on historical bars. This is standard behavior for any indicator that uses internal state tracking, across any platform. This has zero impact on live trading. You trade the signal when it appears in real-time. No entry, TP, SL, or result is affected. I have updated the product description to make this distinction even clearer. The "no repaint" claim applies to real-time signals, which is the industry-standard definition used across MQL5 Market.
jcasas311948 Casas
198
jcasas311948 Casas 2026.04.17 11:31 
 

El 18 de Abril del 2.026, alquile por un mes el indicador Gold Signal Pro with Auto TP SL y desde el primer momento, las señales fueron perfectas y el resultado de las primeras dos semanas fue espectacular: -Total de señales en el mercado de Londres y Nueva York = 110 -Total de señales en las que he entrado =57 - Operaciones positivas 55 (96,49%) - Resultados de los 9 días operados= 8.923$ RESULTADOS REALES 20/30- Abril 2.026 Total 9 dias Op. Total Señales Dia /Semana -177 100% Señales en M. Asiatico -67 38% S. en M. Londres + N.Y. -110 62% Señales de Venta -86 48,59% Señales de Compra -57 32,20% Solo mercado de London + NY Señales Buenas -77 70,00% Señales Malas -33 30,00% NO entrado -53 48,18% Entrado L/NY -57 51,82% Beneficio $ 9.313,85 Operaciones positivas -55 96,49% Perdida -$ 390,51 Operaciones Negativas -2 3,51% Resultado total SEMANA -$ 8.923,34 En la segunda semana pude constatar que el indicador tenia una serie de pequeñas incidencias en MT5 y se las manifesté al desarrollador, el cual en la actualización de hoy 7,13, parece que están todas superadas y mejorado el rendimiento en MT5. Por todo ello recomiendo este indicador Gold Signal Pro with Auto TP SL y yo confirmo que cuando venza el mes de alquiler , lo compraré definitivamente. Un saludo..... Atentamente: Jose Casas

Hoy domingo 17 de Mayo de 2026, confirmo que he adquirido la licencia de compra completa, espero recibir AI Zone Radar + manual PD.

Un saludo....... Atentamente: Jose Casas

Recibido.... Gracias.

Genki Andou
746
Geliştiriciden yanıt Genki Andou 2026.06.14 06:56
¡Hola Jose! Muchísimas gracias por adquirir la licencia completa y por esta reseña tan detallada y generosa. Significa mucho para mí. Tus resultados son extraordinarios, y sobre todo admiro tu disciplina: operar solo en Londres y Nueva York, filtrar las señales débiles y entrar con criterio. Ese es exactamente el uso que hace que el indicador brille. También te agradezco mucho tu feedback sobre MT5 — gracias a tus observaciones pude lanzar la actualización 7.13 con el rendimiento mejorado. Me ayudaste a mejorar el producto para todos. Me alegra que ya hayas recibido AI Zone Radar y el manual. Si tienes cualquier duda sobre cómo combinarlo con el indicador, no dudes en escribirme. ¡Gracias por tu confianza, Jose! Un fuerte saludo.
Değerlendirmeye yanıt














