Dynamic Pivot Zones
- Indicateurs
-
Vincent Jose Proenca
 Je suis trader depuis plus de dix ans, spécialisé principalement sur les CFD. Ce que j’aime dans le trading, c’est la logique, la discipline et la création d’outils qui simplifient la prise de décision. Ne trouvant pas d’indicateurs qui collent à mon approche, j’ai commencé à les coder — d’abord par
 - Version: 1.0
Dynamic Pivot Zones – Your Level Assistant on the Chart
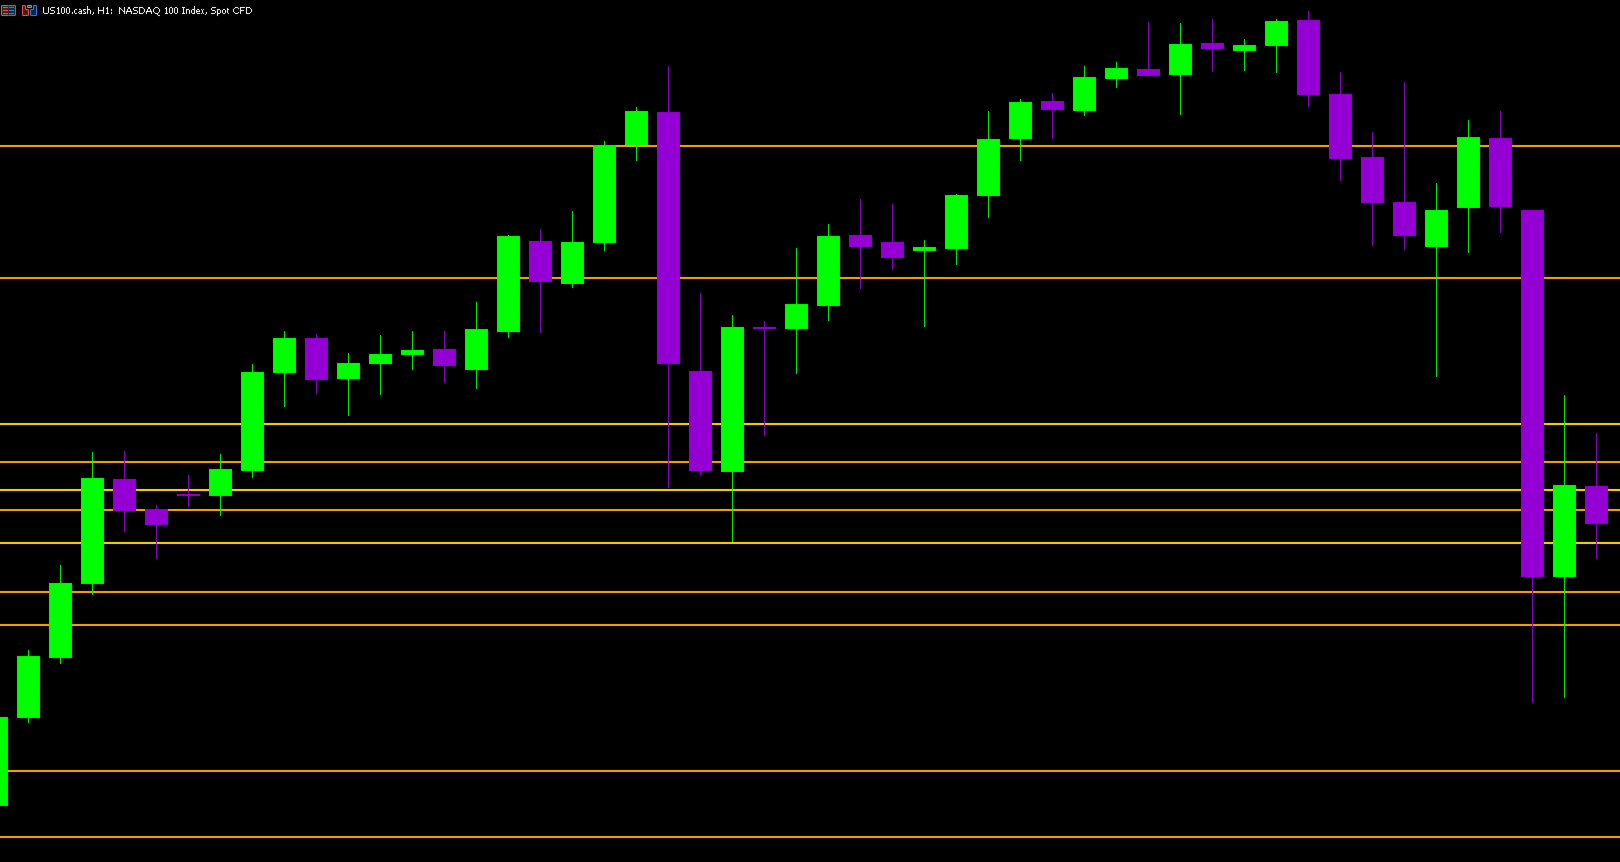
This indicator is a bit like a GPS for your trading. It shows you where the price likes to hang out, where it gets nervous, and where it flies through. No more calculating pivots by hand or guessing support and resistance levels.
What it does:
-
Automatically plots H1, H4, and D1 pivots.
-
Shows support and resistance zones: R1, R2, S1, S2.
-
Lines are colored and easy to read, so you can instantly see what’s hot or cold.
Why you’ll love it:
-
Drop the indicator on your chart, and bam – it comes alive.
-
No more spending hours hunting for key levels.
-
You instantly see where the price might bounce or break.
It’s simple, effective, and gives you a serious helping hand for your trades.