Dynamic Pivot Zones
- 指标
-
Vincent Jose Proenca
 我从事交易已有十多年,主要专注于差价合约(CFD)。我热爱交易的逻辑性、纪律性,以及创造能简化决策过程的工具。因为找不到符合自己方法的指标,我开始自己编写——最初是出于需要,后来变成了乐趣。
我的首批工具包括:Custom Box 和 Daily Bar Number。这些指标并不是理论原型,而是为日常使用而设计,并在真实市场环境中经过测试与优化。结果是:实用、易于整合的解决方案,帮助更快地做出决策,而不会被信息淹没。
我分享这些工具的原因:
我并非被竞争或逐利所驱动,我只是喜欢创造有用的工具。
将这些指标出售,对我来说是帮助其他交易者获得清晰度和效率的一种自然方式。 - 版本: 1.0
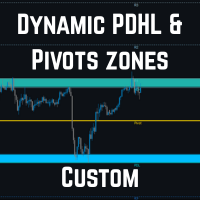
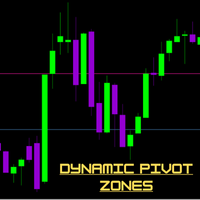
Dynamic Pivot Zones – Your Level Assistant on the Chart
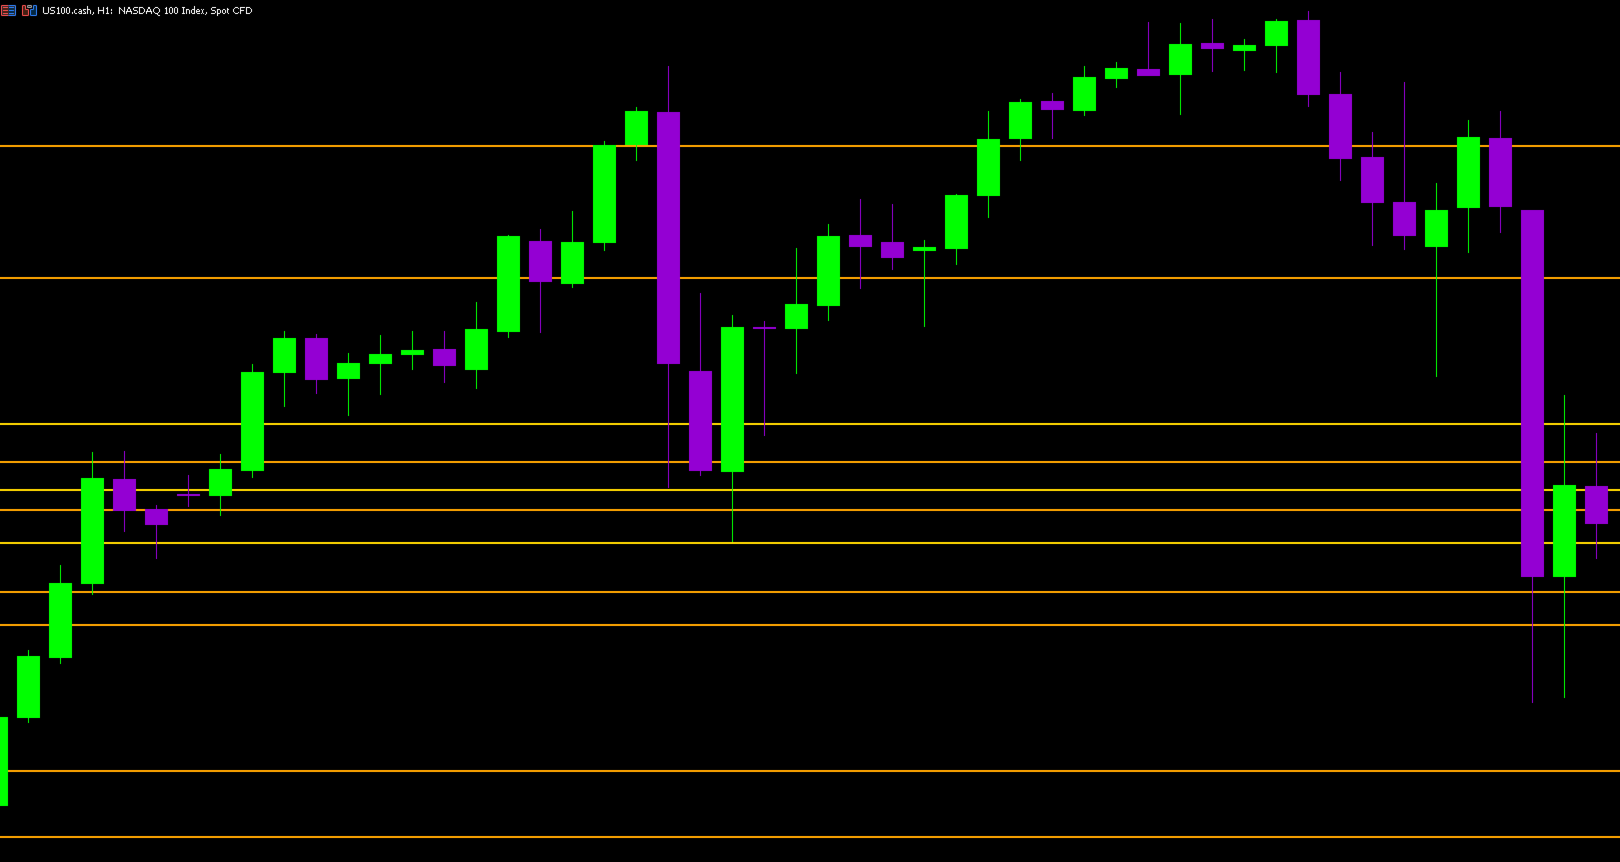
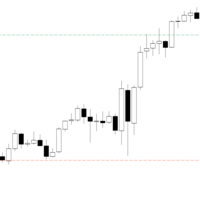
This indicator is a bit like a GPS for your trading. It shows you where the price likes to hang out, where it gets nervous, and where it flies through. No more calculating pivots by hand or guessing support and resistance levels.
What it does:
-
Automatically plots H1, H4, and D1 pivots.
-
Shows support and resistance zones: R1, R2, S1, S2.
-
Lines are colored and easy to read, so you can instantly see what’s hot or cold.
Why you’ll love it:
-
Drop the indicator on your chart, and bam – it comes alive.
-
No more spending hours hunting for key levels.
-
You instantly see where the price might bounce or break.
It’s simple, effective, and gives you a serious helping hand for your trades.