Multi Timeframe Levels Pro

한국어 (Coréen)

설명

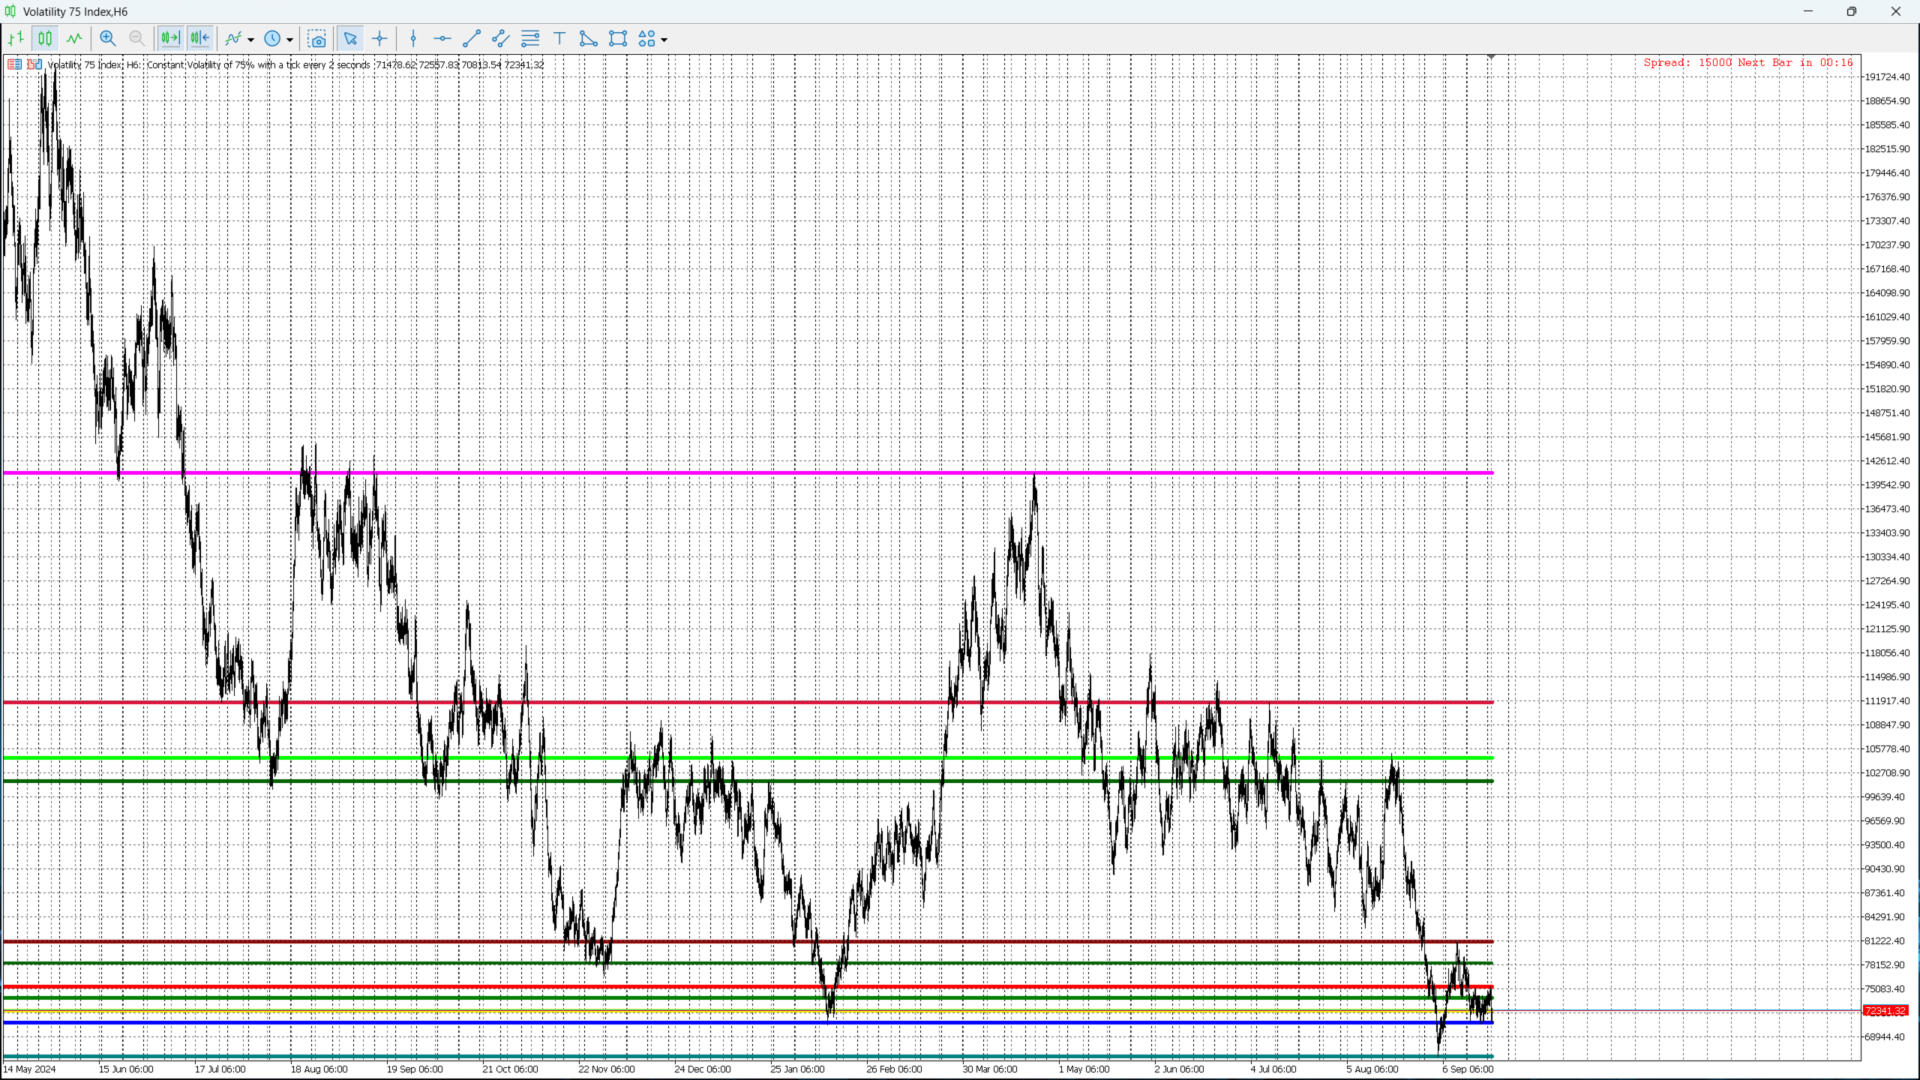
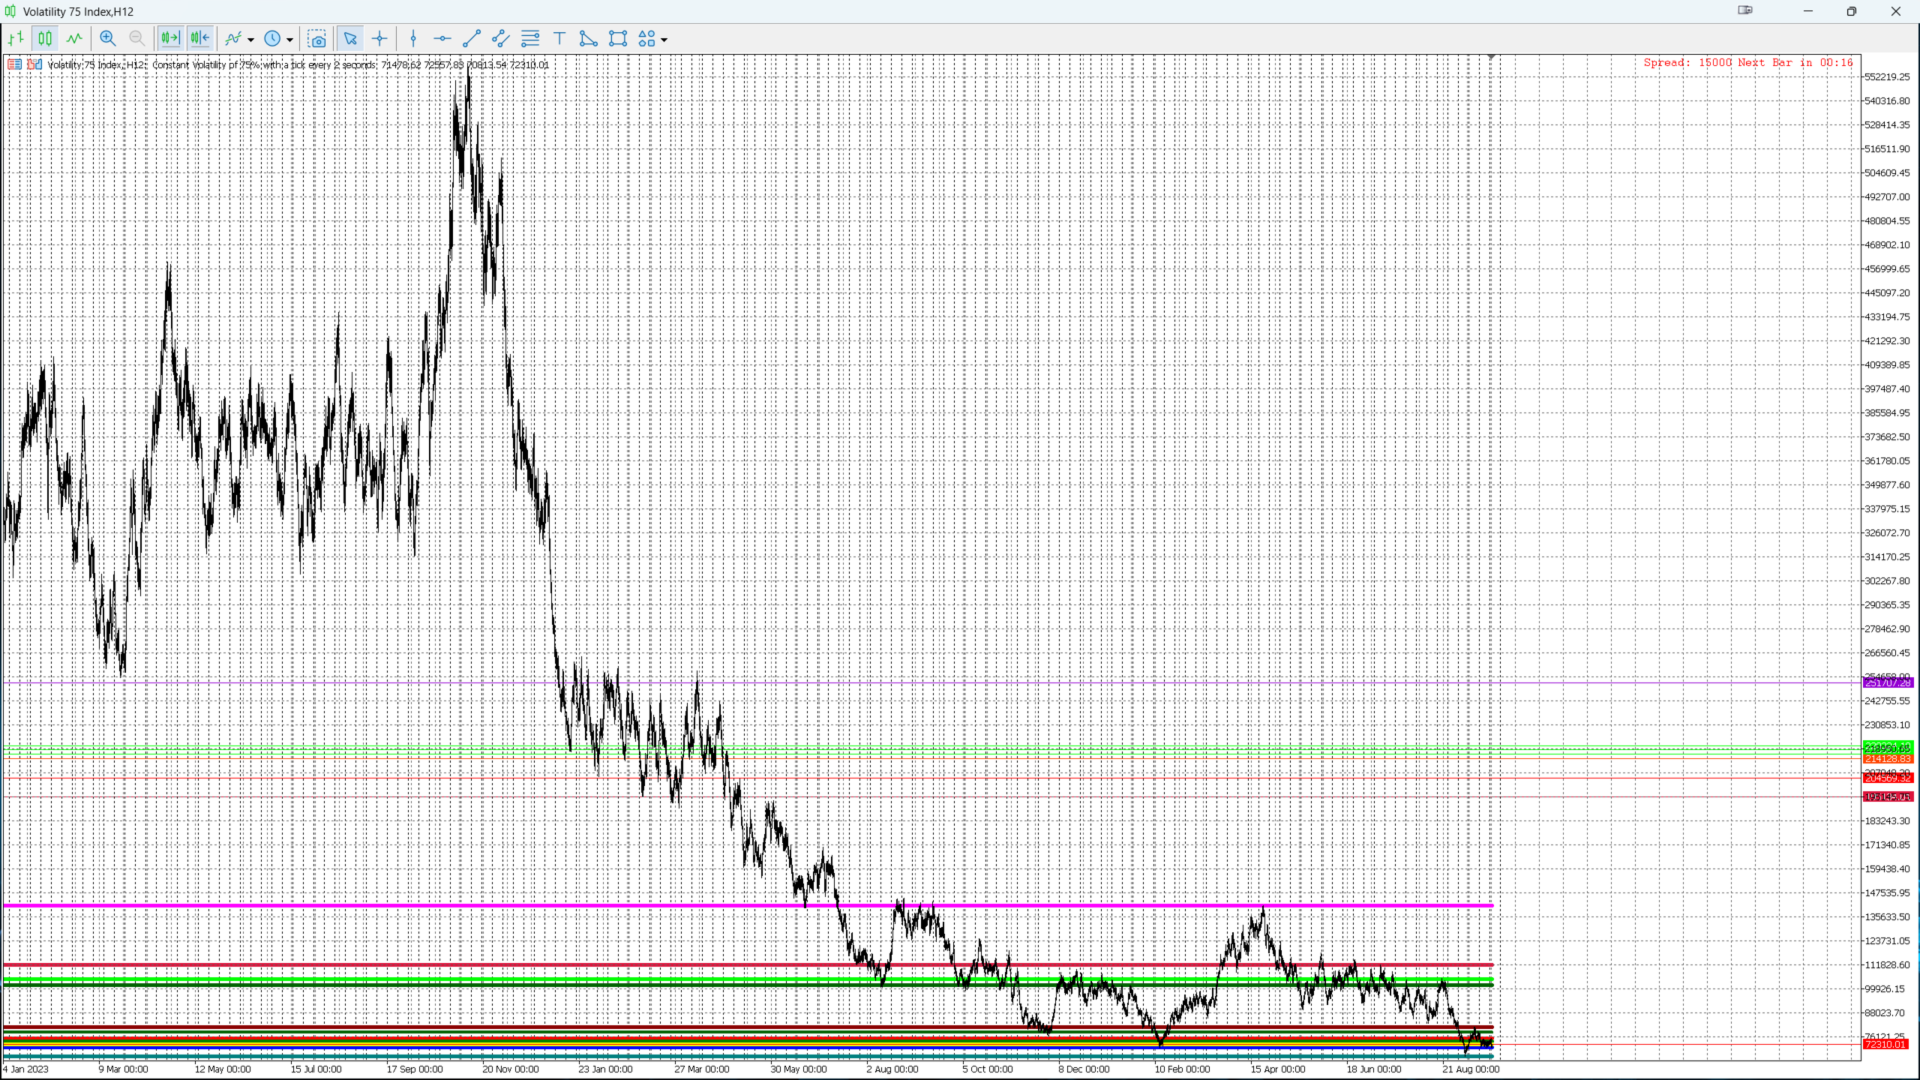
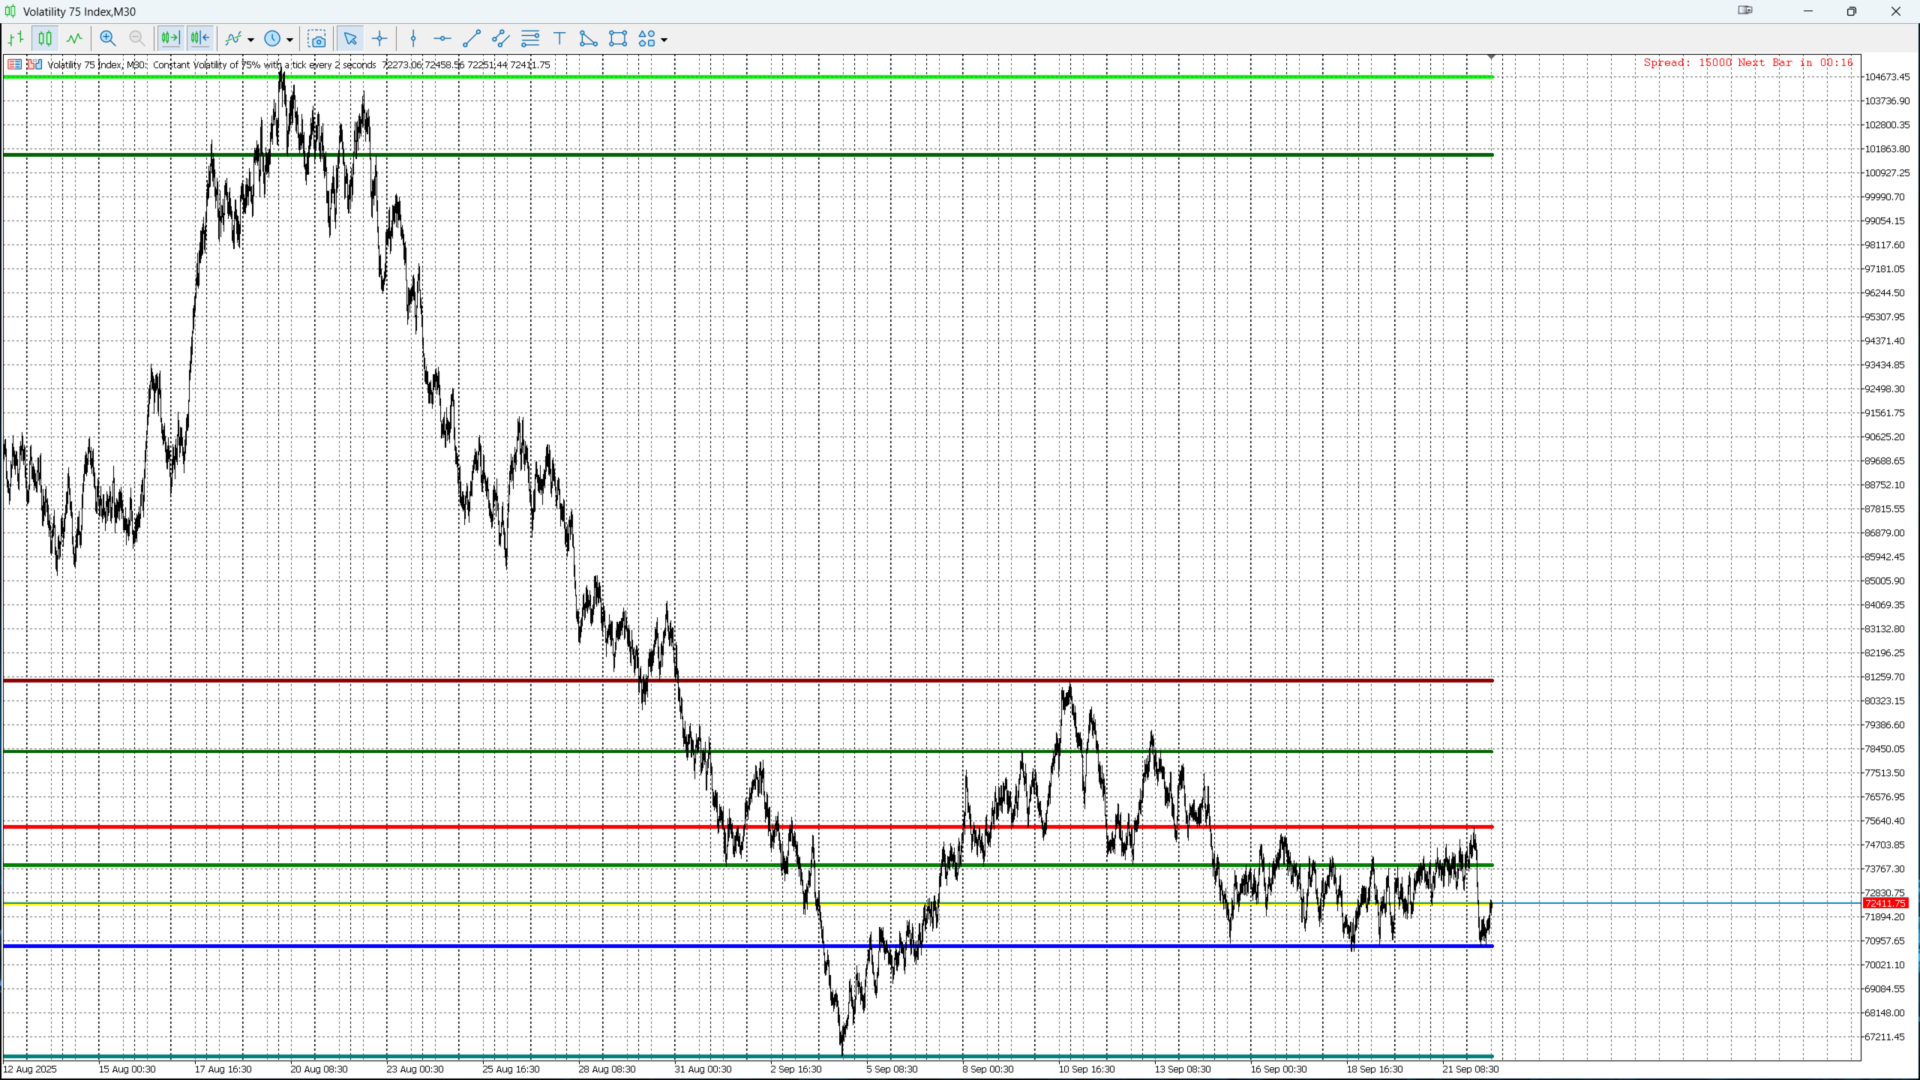
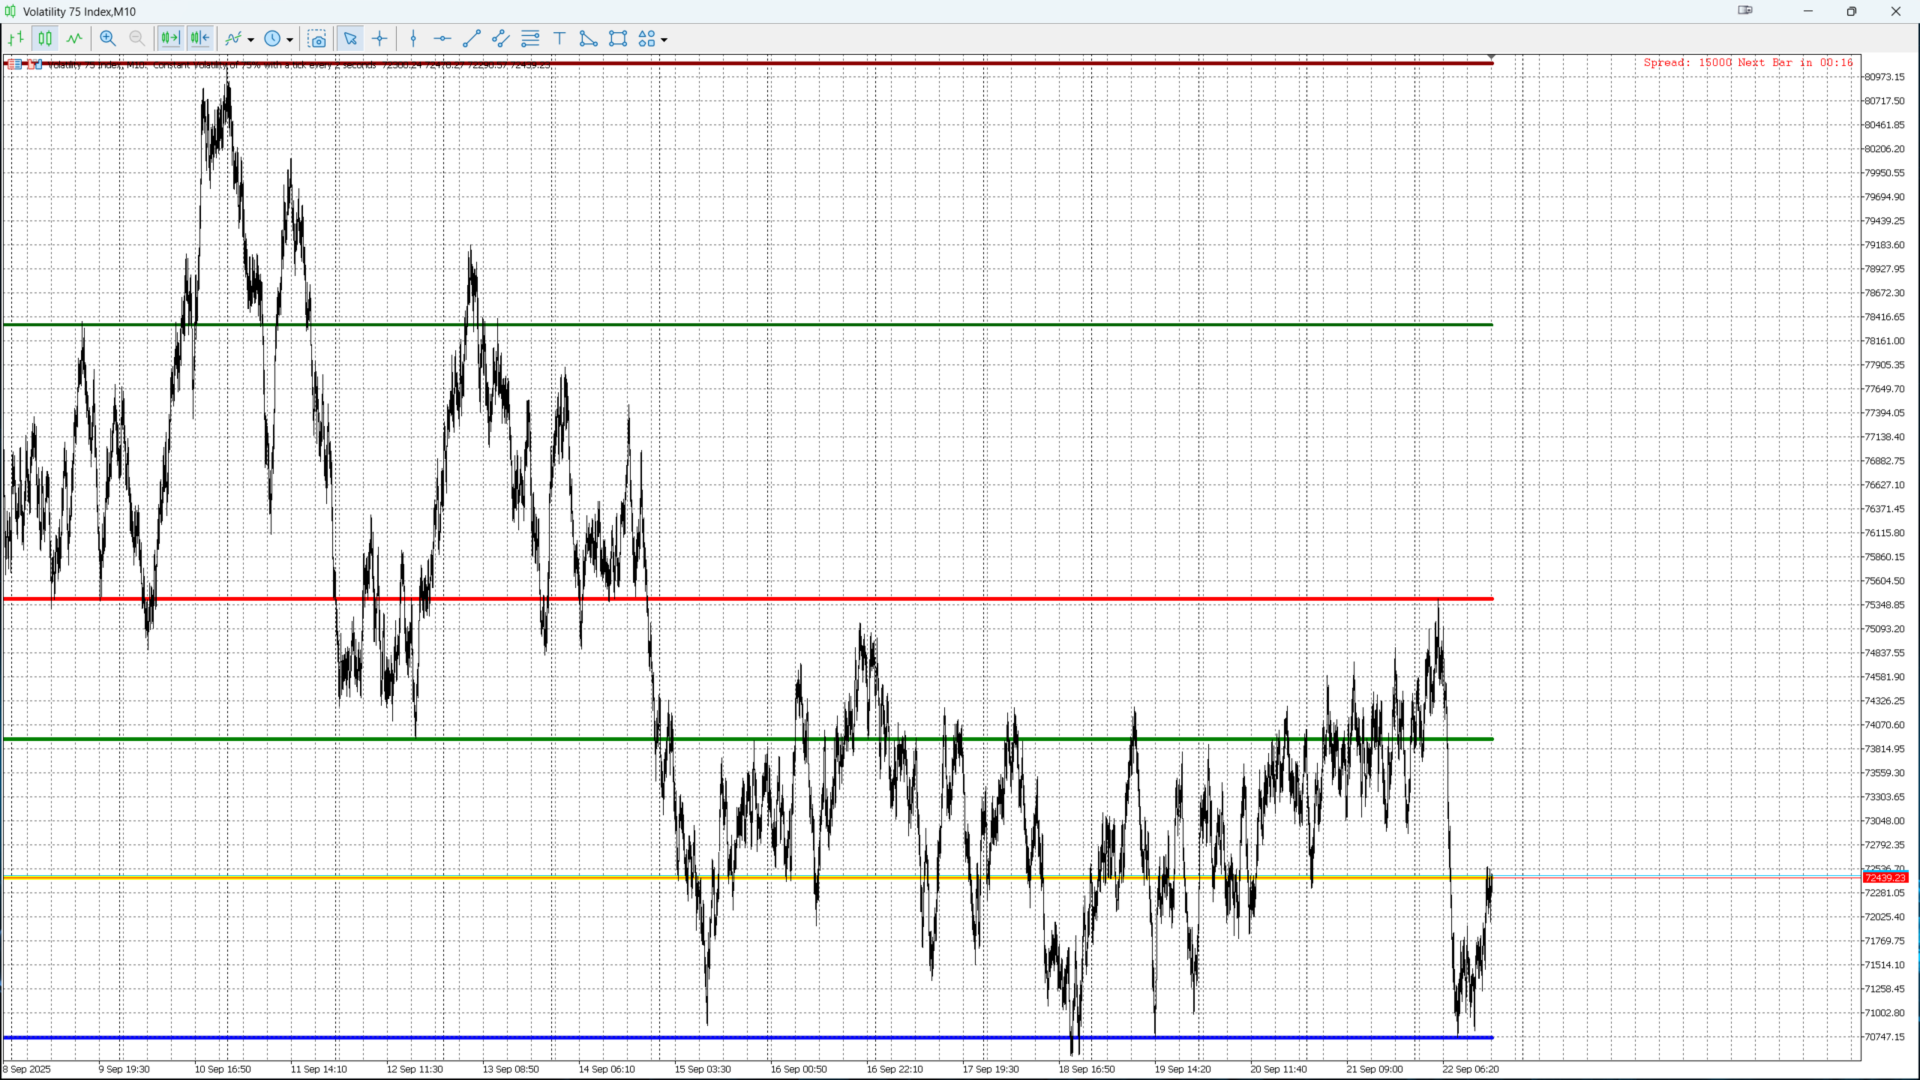
Multi-Timeframe Levels Pro v1.0 은 차트에 자동으로 일간, 월간, 분기, 연간 고점, 저점, 시가, 종가를 표시합니다.
주요 지지/저항 구역 및 돌파 지점을 확인하는 데 이상적입니다.

주요 기능

  • 자동 표시: Daily / Monthly / Quarterly / Yearly 레벨

  • 고점/저점/시가/종가 색상 구분

  • 이전 기간 분석을 위한 Shift 설정

  • 모든 시장 지원: 외환, 지수, 원자재, 주식, 암호화폐

  • 가볍고 빠른 동작, 프라이스 액션, 스윙, 스캘핑 최적화

파라미터

  • DailyShift → 현재 또는 이전 일

  • MonthlyShift → 현재 또는 이전 월

  • QuarterlyShift → 현재 또는 이전 분기

  • YearlyShift → 현재 또는 이전 년도

추천 사용법

연간/분기 레벨은 주요 지지/저항 확인, 일간/월간은 단타 및 인트라데이 매매에 활용하세요.


추천 제품
Delta Profile Volume
Teresinha Moraes Correia
기술 설명 – MetaTrader 5용 Delta Profile Delta Profile 은 MetaTrader 5에서 정의된 캔들 범위 내의 거래량 흐름을 세부적으로 분석하기 위해 설계된 지표입니다. 이 도구는 각 가격 수준에서 양의 거래량(상승과 관련) 과 음의 거래량(하락과 관련) 간의 불균형을 구조화하고 시각화합니다. 이를 통해 사용자는 실제로 거래가 집중되는 가격 영역과 시장 불균형이 형성되는 구간을 명확하게 파악할 수 있습니다. 핵심 개념 지표는 가격 레벨 을 인식하고 이를 양의 거래량, 음의 거래량 및 순 델타(양-음 차이)로 분류합니다. 각 가격 레벨은 수평 막대 로 차트에 표시되며, 거래가 집중되는 구간을 직관적으로 보여줍니다. 사용자는 분석할 캔들의 개수 , 가격 반올림 정밀도 , 최대 표시 레벨 수 , 표시 옵션 등을 직접 설정할 수 있습니다. 주요 기능 가격 레벨 매핑 : 사용자가 지정한 자릿수에 맞게 가격을 반올림하여 거래량을 집계합니다. 순 델타 계산 : 양
The "MR Volume Profile Rectangles 5" indicator is a charting tool that displays trading volume at different price levels rather than time intervals. A key concept in volume profile is the point of control (POC) —the price level with the highest volume traded during the session or time range. While tools like VWAP or OBV provide volume trends, the "MR Volume Profile Rectangles 5" indicator offers granular detail about where the most market activity occurs at specific price levels. This makes it a
Volume Profile V6
Andrey Kolesnik
4.67 (3)
시장 매물대 지표(Volume Profile) + 스마트 오실레이터. 통화 쌍, 주식, 선물, 암호화폐 등 거의 모든 종목에서 작동하며, 실제 거래량(Real Volume)과 틱 거래량(Tick Volume)을 모두 지원합니다. 프로파일 생성 범위를 일주일이나 한 달 등으로 자동 설정할 수 있을 뿐만 아니라, 두 개의 수직선(빨간색과 파란색)을 이동하여 수동으로 범위를 설정할 수도 있습니다. 히스트그램 형태로 표시되며, 특정 가격 수준의 히스토그램 너비는 해당 가격대에서 발생한 거래량을 의미합니다. Mode level line color 파라미터를 사용하면 가격이 반등할 가능성이 높은 주요 매물대 수준을 자동으로 표시할 수 있으며, Maximum color 파라미터는 설정된 전체 범위에서 거래가장 많이 발생한 최대 거래량 수준을 별도로 보여줍니다. 스마트 오실레이터는 과매수 및 과매도 구간을 표시합니다. 여러 지표로부터 오는 정보를 분석하고, 처리된 데이터를 바탕으로 과매수 및 과매
Trade smarter, not harder: Empower your trading with Harmonacci Patterns This is arguably the most complete harmonic price formation auto-recognition indicator you can find for the MetaTrader Platform. It detects 19 different patterns, takes fibonacci projections as seriously as you do, displays the Potential Reversal Zone (PRZ) and finds suitable stop-loss and take-profit levels. [ Installation Guide | Update Guide | Troubleshooting | FAQ | All Products ] It detects 19 different harmonic pri
Harmonic Pattern Structure Harmonic Pattern Structure is a professional MetaTrader 5 indicator that automatically detects classic harmonic patterns using strict Fibonacci ratio validation and XABCD price structure. Designed for traders who value precision, clean visuals, and structured analysis, the indicator highlights potential reversal zones based on price geometry, supporting consistent and objective decision-making. SUPPORTED HARMONIC PATTERNS Gartley (222) Butterfly Bat Crab Shark Cy
SMC Venom Model BPR 지표는 Smart Money(SMC) 개념 내에서 일하는 트레이더를 위한 전문 도구입니다. 가격 차트에서 두 가지 주요 패턴을 자동으로 식별합니다. FVG (공정 가치 갭)는 3개의 캔들의 조합으로, 첫 번째와 세 번째 캔들 사이에 갭이 있습니다. 이는 볼륨 지원이 없는 레벨 사이에 구역을 형성하여 종종 가격 수정으로 이어집니다. BPR (균형 가격 범위)은 두 개의 FVG 패턴의 조합으로, "브리지"를 형성합니다. 이는 가격이 낮은 볼륨 활동으로 움직일 때 브레이크아웃과 레벨로의 복귀 구역으로, 캔들 사이에 갭을 생성합니다. 이러한 패턴은 거래자가 차트에서 거래량과 가격 역학을 분석하여 주요 지지/저항 수준, 돌파 구역 및 진입 지점을 식별하는 데 도움이 되며, 여기서 대형 시장 참여자와 일반 참여자 간의 상호 작용이 발생합니다. 이 지표는 사각형과 화살표 형태로 패턴을 시각화하며 유연한 경고 설정도 지원합니다. 주요 특징: 패턴 표시 모드
Prizmal Logic
Vladimir Lekhovitser
5 (1)
실시간 거래 신호 거래 활동의 공개 실시간 모니터링: https://www.mql5.com/ko/signals/2353471 공식 정보 판매자 프로필 공식 채널 사용자 매뉴얼 설정 안내 및 사용 지침: 사용자 매뉴얼 열기 이 전문가 어드바이저는 규칙 기반 거래 전략에 기반하여 설계되었습니다. 이 전략은 시장에 지속적으로 노출되기보다는 특정 시장 조건을 식별하는 데 초점을 둡니다. 시스템은 가격 움직임, 변동성 특성 및 시간 요소를 분석합니다. 이 요소들은 현재 시장 환경이 거래 참여에 적합한지 판단하는 데 사용됩니다. 여러 사전 정의된 기준이 동시에 충족될 때만 거래가 실행됩니다. 조건이 충족되지 않으면 전문가 어드바이저는 비활성 상태를 유지합니다. 그 결과 거래 활동은 일정하지 않습니다. 거래가 전혀 발생하지 않는 기간이 있을 수 있습니다. 이는 포지션이 전혀 없는 하루 전체를 포함할 수 있습니다. 반대로 적절한 시장 국면에서는 비교적 짧은 시간에 여러 거
Blahtech Market Profile MT5
Blahtech Limited
5 (10)
Was: $249  Now: $99   Market Profile defines a number of day types that can help the trader to determine market behaviour. A key feature is the Value Area, representing the range of price action where 70% of trading took place. Understanding the Value Area can give traders valuable insight into market direction and establish the higher odds trade. It is an excellent addition to any system you may be using. Inspired by Jim Dalton’s book “Mind Over Markets”, this indicator is designed to suit the
ProEngulfing For MT5
Ashkan Hazegh Nikrou
ProEngulfing 무료 버전은 QualifiedEngulfing으로, 하루에 하나의 신호로 제한되며 기능이 적습니다. 모든 Koala 제품에 대한 최신 정보를 확인하려면 mql5 커뮤니티에서 Koala Trading Solution 채널에 가입하세요. 가입 링크는 아래와 같습니다: https ://www .mql5 .com /en /channels /koalatradingsolution 이 제품의 MT4 버전은 아래 링크에서 다운로드 가능합니다: https ://www .mql5 .com /en /market /product /52023 ProEngulfing 소개 – MT4용 전문가 수준의 Engulf 패턴 지표 정확성을 극대화한 ProEngulfing을 소개합니다. 이 최신 지표는 포렉스 시장에서 신뢰할 수 있는 Engulf 패턴을 식별하고 강조하는 데 중점을 둔 제품입니다. MetaTrader 4에 맞게 개발된 ProEngulfing은 신뢰도 높은 신호를 제공하기 위해
Noize Absorption Index
Ekaterina Saltykova
Noize Absorption Index - is the manual trading system that measures the difference of pressure between bears forces and bulls forces. Green line - is a noize free index that showing curent situation. Zero value of index shows totally choppy/flat market.Values above zero level shows how powerfull bullish wave is and values below zero measures bearish forces.Up arrow appears on bearish market when it's ready to reverse, dn arrow appears on weak bullish market, as a result of reverse expectation.
RBreaker
Zhong Long Wu
RBreaker Gold Indicators는 금 선물을 위한 단기 데이 트레이딩 전략으로, 추세 추종과 데이 내 반전의 두 가지 거래 방식을 결합합니다. 추세 장에서 수익을 포착할 수 있을 뿐만 아니라, 시장이 반전될 때 적시에 이익을 확정하고 추세에 맞춰 반대 포지션을 잡을 수 있습니다. 이 전략은 미국 잡지 Futures Truth에서 15년 연속으로 가장 수익성 높은 트레이딩 전략 상위 10위 안에 선정되었습니다. 긴 라이프사이클을 자랑하며, 현재까지 국내외에서 널리 사용되고 연구되고 있습니다. 본 지표는 2026년 금 선물의 움직임을 반영하여 14일 ATR 지표를 기반으로 돌파 계수 A, 관찰 계수 B, 반전 계수 R을 보다 합리적인 값으로 정의했습니다. 매우 훌륭한 지표이며, 안정적인 연간 수익성을 달성했습니다. 강력히 추천합니다~ 위 지표는 변동성이 높은 상품에 적합하며, 매개변수는 금 선물, 주가 지수 선물 등에 적합합니다. 다른 상품이 필요한 경우 돌파 계수 A
Price Magnet — Price Density and Attraction Levels Indicator Price Magnet is a professional analytical tool designed to identify key support and resistance levels based on statistical Price Density. The indicator analyzes a specified historical period and detects price levels where the market spent the most time. These zones act as “magnets,” attracting price action or forming a structural base for potential reversals. Unlike traditional Volume Profile tools, Price Magnet focuses on price-time d
Mine Farm
Maryna Kauzova
Mine Farm is one of the most classic and time-tested scalping strategies based on the breakdown of strong price levels. Mine Farm is the author's modification of the system for determining entry and exit points into the market... Mine Farm - is the combination of great potential with reliability and safety. Why Mine Farm?! - each order has a short dynamic Stop Loss - the advisor does not use any risky methods (averaging, martingale, grid, locking, etc.) - the advisor tries to get the most
Equinox Gold
Dmitriq Evgenoeviz Ko
Equinox Gold is a high-tech trading expert advisor (EA) specifically designed for the gold market ( XAUUSD ). The system is based on a unique Market Equilibrium algorithm that identifies areas of imbalance between supply and demand during extreme volatility. Unlike most robots that use dangerous sit-and-wait methods, Equinox Gold relies on mathematical momentum confirmation and strict risk control for every trade. MAIN ADVANTAGES VRP Filter (Volatility Range Filter): The robot automatically ada
Phantom Edge SMC
Nattapon Chuekamhod
Phantom Edge SMC — The Ultimate Smart Money Indicator for MT5 Tired of manually drawing structures while trading SMC or ICT concepts? Let Phantom Edge SMC do the heavy lifting for you. Key Features Internal & Swing Structure: Automatically detects BOS and CHoCH across two structural levels. Order Blocks (OB): Identifies Internal and Swing OBs with automated mitigation tracking. Equal Highs / Lows: Highlights EQH / EQL to pinpoint Liquidity pools. Fair Value Gaps (FVG): Displays FVGs with
Overview Mirror Signals Service EA (Text only)   is a powerful monitoring Expert Advisor that automatically sends   real-time Telegram notifications   for all important trade events on your MetaTrader 5 account. It is engineered specifically for   signal providers ,   trade-copier operators ,   auditors ,   educators , and   professional trading services   that require immediate, detailed, and reliable reporting. Everything from   entries, exits, SL/TP changes, comment changes, trailing sto
Premium level Pro
Dmitriy Kashevich
Premium level is a unique indicator with more than 80% accuracy of correct predictions! This indicator has been tested for more than two months by the best Trading Specialists! The author's indicator you will not find anywhere else! From the screenshots you can see for yourself the accuracy of this tool! 1 is great for trading binary options with an expiration time of 1 candle. 2 works on all currency pairs, stocks, commodities, cryptocurrencies Instructions: As soon as the red arrow app
Your Trend Friend
Luigi Nunes Labigalini
5 (1)
The trend is your friend! Look at the color of the indicator and trade on that direction. It does not  repaint. After each candle is closed, that's the color of the trend. You can focus on shorter faster trends or major trends, just test what's most suitable for the symbol and timeframe you trade. Simply change the "Length" parameter and the indicator will automatically adapt. You can also change the color, thickness and style of the lines. Download and give it a try! There are big movements w
표시기는 현재 시세를 작성하여 과거 시세와 비교할 수 있으며 이를 바탕으로 가격 변동을 예측합니다. 표시기에는 원하는 날짜로 빠르게 이동할 수 있는 텍스트 필드가 있습니다. 옵션: 기호 - 표시기가 표시할 기호 선택. SymbolPeriod - 지표가 데이터를 가져올 기간 선택. IndicatorColor - 표시기 색상. HorisontalShift - 지시자가 그린 따옴표를 지정된 막대 수만큼 이동합니다. Inverse - true는 인용 부호를 반대로, false - 원래 보기를 반전합니다. ChartVerticalShiftStep - 차트를 수직으로 이동합니다(키보드의 위/아래 화살표). 다음은 날짜를 입력할 수 있는 텍스트 필드의 설정으로, '엔터'를 누르면 즉시 이동할 수 있습니다.
Advanced Volume Profile Analysis Tool for MetaTrader 5 The Kecia Volume Profile Order Finder provides traders with volume profile analysis capabilities. This MT5 indicator combines volume profile visualization with statistical calculations to help identify potential trading opportunities and suggests entry, stop loss, and take profit levels based on market structure. Market Profile Visualization Transform your chart with customizable volume profile visualizations: Multiple visualization options
"Impulses and Corrections 5" is created to help traders navigate the market situation. The indicator shows multi-time frame upward and downward "Impulses" of price movements. These impulses are the basis for determining the "Base" , which is composed of zones of corrections of price movements, as well as "Potential" zones for possible scenarios of price movement. Up and down impulses are determined based on a modified formula of Bill Williams' "Fractals" indicator. The last impulse is always "U
##   ONLY GOLD ##   Тiльки Золото ## **Mercaria Professional Trading Zones - Complete Guide** ## **Mercaria Professional Trading Zones - Повний посібник** ### **How Mercaria Zones Work / Як працюють зони Mercaria** **English:** Mercaria Zones is an advanced trading indicator that identifies high-probability support and resistance areas using ZigZag extremes combined with mathematical zone calculations. The indicator works on multiple timeframes simultaneously, providing a comprehensive view
Overview Harmonic Patterns MT5 is a technical analysis indicator designed for the MetaTrader 5 platform. It identifies and displays harmonic price patterns, such as Butterfly, Cypher, Crab, Bat, Shark, and Gartley, in both bullish and bearish directions. The indicator calculates key price levels, including entry, stop loss, and three take-profit levels, to assist traders in analyzing market movements. Visual elements and customizable alerts enhance usability on the chart. Features Detects six ha
Triangle Pattern Gann v3.1 - Complete Feature Documentation Core Functionality OverviewTriangle Pattern Gann v3.1 is a sophisticated MetaTrader 5 indicator that combines W.D. Gann's geometric trading principles with advanced triangle pattern recognition to deliver actionable trading signals. Primary Features1. Triangle Pattern Detection SystemAscending Triangle Recognition Function: Automatically identifies bullish continuation patterns Detection Criteria: Flat horizontal resistance line
WAPV Weis Wave Chart Forex
Eduardo Da Costa Custodio Santos
The Weis Wave Chart Forex for MT5 is a Price and Volume indicator. The Price and Volume reading was widely disseminated through Richard Demille Wyckoff based on the three laws created by him: Supply and Demand, Cause and Effect and Effort vs. Result. In 1900 R.Wyckoff already used the wave chart in his analyses. Many years later, around 1990, David Weis Automated R. Wyckoff's wave chart and today we bring you the evolution of David Weis' wave chart. It shows the amount of Volume and the amount o
KT Double Top Bottom MT5
KEENBASE SOFTWARE SOLUTIONS
1 (1)
The double top bottom pattern is arguably one of the technical analysis's most popular chart patterns. These patterns are used to capitalize on recurring patterns and identify trend reversal patterns, thereby creating well-placed entry and exit levels. The KT Double Top Bottom is based on these patterns and fine-tunes the trade signal development process for traders. Features It's based on one of the most reliable trading patterns and brings some fine-tuning and automation to the process. Also
Order Book, known also as Market Book, market depth, Level 2, - is a dynamically updated table with current volumes of orders to buy and to sell specific financial instument at price levels near Bid and Ask. MetaTrader 5 provides the means for receiving market book from your broker, but in real time only, without access to its history. The indicator OrderBook Cumulative Indicator accumulates market book data online and visualizes them on the chart. In addition, the indicator can show the market
CvdDeltaVolumes
Parasbhai N Patel
Delta + CVD & CVD Candles Order-flow indicator combining Delta (Ask–Bid), Cumulative Volume Delta (CVD), and a unique CVD-based synthetic candle system. Shows buy/sell pressure, volume aggressiveness, and momentum shifts with optional Delta histogram, CVD line, and CVD+Delta combined candles. Useful for scalping, intraday trading, divergence detection, and understanding buyer/seller dominance. Overview The Delta + CVD & CVD Candles Indicator combines multiple order-flow tools into one clean
# DRAWDOWN INDICATOR V4.0 - The Essential Tool to Master Your Trading ## Transform Your Trading with a Complete Real-Time Performance Overview In the demanding world of Forex and CFD trading, **knowing your real-time performance** isn't a luxury—it's an **absolute necessity**. The **Drawdown Indicator V4.0** is much more than a simple indicator: it's your **professional dashboard** that gives you a clear, precise, and instant view of your trading account status. --- ## Why This Indicator
이 제품의 구매자들이 또한 구매함
AriX
Temirlan Kdyrkhan
1 (4)
AriX Indicator for MT5 A powerful trend-following and signal-evaluation tool AriX is a custom MT5 indicator that combines Moving Averages and ATR-based risk/reward logic to generate clear buy/sell signals. It visualizes dynamic SL/TP levels, evaluates past trade outcomes, and displays win/loss statistics in a clean on-chart panel. Key features include: Buy/Sell signals based on MA crossovers ATR-based SL/TP1/TP2/TP3 levels with visual lines and labels Signal outcome tracking with real-time stat
ARIPoint
Temirlan Kdyrkhan
ARIPoint is a powerful trading companion designed to generate high-probability entry signals with dynamic TP/SL/DP levels based on volatility. Built-in performance tracking shows win/loss stats, PP1/PP2 hits, and success rates all updated live. Key Features: Buy/Sell signals with adaptive volatility bands Real-time TP/SL/DP levels based on ATR Built-in MA Filter with optional ATR/StdDev volatility Performance stats panel (Success, Profit/Loss, PP1/PP2) Alerts via popup, sound, push, or email Cu
CGE Trading Suite
Carl Gustav Johan Ekstrom
5 (1)
CGE Trading Suite delivers the analytical edge typically reserved for professional trading desks. The platform integrates a full suite of analytical tools into one seamless workflow: dynamic grid mapping, liquidity behavior analysis, ECM, trend lines, MIDAS, trade cycles, and directional channel projections. Together, these provide a unified view of market structure and momentum. Directional clarity is further enhanced by the capital flow index, which measures currency basket strength to identif
ARIScalping
Temirlan Kdyrkhan
ARIScalp is a powerful trading companion designed to generate high-probability entry signals with dynamic TP/SL/DP levels based on volatility. Built-in performance tracking shows win/loss stats, PP1/PP2 hits, and success rates all updated live. Key Features: Buy/Sell signals with adaptive volatility bands Real-time TP/SL/DP levels based on ATR Built-in MA Filter with optional ATR/StdDev volatility Performance stats panel (Success, Profit/Loss, PP1/PP2) Alerts via popup, sound, push, or email Cus
TrendMaestro5
Stefano Frisetti
note: this indicator is for METATRADER4, if you want the version for METATRADER5 this is the link:  https://www.mql5.com/it/market/product/108106 TRENDMAESTRO ver 2.5 TRENDMAESTRO recognizes a new TREND from the start, he never makes mistakes. The certainty of identifying a new TREND is priceless. DESCRIPTION TRENDMAESTRO identifies a new TREND in the bud, this indicator examines the volatility, volumes and momentum to identify the moment in which there is an explosion of one or more of these da
Rtc ML Ai Predictor
Muhammad Faisal Sagala
Rtc ML Ai | Predictor CORE MACHINE LEARNING ENGINE Adaptive ML Market Predictor – Multi-Bar Trend & Candle Forecast What This Indicator Does This indicator is a  real-time market prediction engine  designed to analyze price behavior and estimate  future market tendencies . Unlike conventional indicators, this system  does not rely on static parameters or historical curve-fitting , but adapts its internal state dynamically during live market operation. Instead of using static rules, the indic
Max Ribbon Mt5
Stefano Frisetti
WARNING: This indicator is distributed EXCLUSIVELY on MQL5.com MT4 version:   https://www.mql5.com/it/market/product/160363 MT5 version:   https://www.mql5.com/it/market/product/160410 ============================================================================================= MAX RIBBON ver 1.00 The indicator that shows you the TREND clearly and unambiguously! ============================================================================================= DESCRIPTION MAX RIBBON is an advanced tre
IVISTscalp5
Vadym Zhukovskyi
5 (6)
당신에게 소개하는 iVISTscalp5 지표는 독특하면서도 거래 작업에서 효과적입니다. 이 지표는 시간 데이터를 기반으로 하며 금융 시장의 많은 경험과 깊은 분석의 결과입니다. iVISTscalp5 지표는 수동 거래에 뛰어난 도구입니다. 편리성, 간단함 및 시각화 - 모든 복잡성은 숨겨져 있습니다. 우리는 iVISTscalp5 지표의 설정과 사용을 최대한 단순화했습니다. 이 지표는 MT5 터미널에서 가지고 있는 모든 금융 상품에 적합합니다. 시간 기준으로 작동하는 시간은 4am에서 8pm (UTC+3)입니다. iVISTscalp5 지표 메뉴 (스크린샷 1 참조): History - 표시할 주간 수 계산 dT_min - 시간 설정 간격 선택 (분) TFline - 수평 볼륨 생성 (타임프레임) BARSline - 수평 볼륨 생성 (바 수) TFtrend1 - 매일 채널 생성 (타임프레임) BARStrend1 - 매일 채널 생성 (바 수) TFtrend2 - 주간 채널 생성 (타임프레임
VTrende Pro
Andrii Diachenko
5 (1)
VTrende Pro - MTF indicator for trend trading with a display panel for MT5 *** Videos can be translated into any language using subtitles (video language - Russian) Although the signals of the VTrende Pro indicator can be used as signals of a full-fledged trading system, it is recommended to use them in conjunction with the Bill Williams TS. VTrende Pro is an extended version of the VTrende indicator. Difference between Pro version and VTrende: - Time zones - Signal V - signal 1-2 waves -    S
Recommended TimeFrame >= H1. 100% Non Repainted at any moment.  Use it carefully, only with Trend Direction. Trading Usage: 2 Variants: as Range System or as BreakOut System (Both Only With Trend Direction)::: (Always use StopLoss for minimise Risk); [1] as Range System: (Recommended) in UP TREND:  - BUY in Blue Line , then if price goes down by 50 points (on H1) open Second BUY.   Close in any Profit you wish: TrailingStop(45 points) or Close when Price touches upper Gold Line. in DOWN TREND
FXLAND Smart Reversal Indicator (MT5) FXLAND Smart Reversal Indicator is a professional technical analysis tool designed to help traders identify potential price reversal zones and key market turning points with clarity and precision. The best reversal indicator and price return by choosing only one ceiling or floor in each time frame A masterpiece of combining mathematics and Gann, fractal matrix, Fibonacci, movement angle and time. Completely intelligent Key Features Detects potenti
Pantera Indicator
Temirlan Kdyrkhan
5 (1)
A tool for on-chart strategy backtesting and performance analysis. A utility for developing, debugging, and testing custom trading ideas and indicator functions. An indicator designed to quickly test trading concepts and visualize the effectiveness of different input parameters. An all-in-one sandbox for testing everything from simple crossovers to complex, multi-condition trading systems.
WanaScalper
Isaac Wanasolo
1 (1)
A scalping indicator based on mathematical patterns, which on average gives signals with relatively small SL, and also occasionally helps to catch big moves in the markets (more information in the video) This indicator has three main types of notifications: The first type warns of a possible/upcoming signal on the next bar The second type indicates the presence of a ready signal to enter the market/open a position The third type is for SL and TP levels - you will be notified every time price re
Pan PrizMA CD Phase
Aleksey Panfilov
The Expert Advisor and the video are attached in the Discussion tab . The robot applies only one order and strictly follows the signals to evaluate the indicator efficiency. Pan PrizMA CD Phase is an option based on the Pan PrizMA indicator. Details (in Russian). Averaging by a quadric-quartic polynomial increases the smoothness of lines, adds momentum and rhythm. Extrapolation by the sinusoid function near a constant allows adjusting the delay or lead of signals. The value of the phase - wave s
Классификатор силы тренда. Показания на истории не меняет. Изменяется классификация только незакрытого бара. По идее подобен полной системе ASCTrend, сигнальный модуль которой, точнее его аппроксимация в несколько "урезанном" виде, есть в свободном доступе, а также в терминале как сигнальный индикатор SilverTrend . Точной копией системы ASCTrend не является. Работает на всех инструментах и всех временных диапазонах. Индикатор использует несколько некоррелируемых между собой алгоритмов для класси
FFx Universal Strength Meter PRO is more than a basic strength meter. Instead of limiting the calculation to price, it can be based on any of the 19 integrated strength modes + 9 timeframes. With the FFx USM, you are able to define any period for any combination of timeframes. For example, you can set the dashboard for the last 10 candles for M15-H1-H4… Full flexibility! Very easy to interpret... It gives a great idea about which currency is weak and which is strong, so you can find the best pai
The FFx Universal MTF alerter shows on a single chart all the timeframes (M1 to Monthly) with their own status for the chosen indicator. 9 indicators mode (MACD-RSI-Stochastic-MA-ADX-Ichimoku-Candles-CCI-PSAR). Each can be applied multiple times on the same chart with different settings. Very easy to interpret. Confirm your BUY entries when most of the timeframes are showing green color. And confirm your SELL entries when most of the timeframes are showing red color. 2 Alert Options : input to s
FFx Watcher Pro MT5
Eric Venturi-Bloxs
The FFx Watcher PRO is a dashboard displaying on a single chart the current direction of up to 15 standard indicators and up to 21 timeframes. It has 2 different modes: Watcher mode: Multi Indicators User is able to select up to 15 indicators to be displayed User is able to select up to 21 timeframes to be displayed Watcher mode: Multi Pairs User is able to select any number of pairs/symbols User is able to select up to 21 timeframes to be displayed This mode uses one of the standard indicators
FFx Patterns Alerter gives trade suggestions with Entry, Target 1, Target 2 and StopLoss .... for any of the selected patterns (PinBar, Engulfing, InsideBar, OutsideBar) Below are the different options available: Multiple instances can be applied on the same chart to monitor different patterns Entry suggestion - pips to be added over the break for the entry 3 different options to calculate the SL - by pips, by ATR multiplier or at the pattern High/Low 3 different options to calculate the 2 TPs -
FFx Basket Scanner MT5
Eric Venturi-Bloxs
MetaTrader 4 version available here : https://www.mql5.com/en/market/product/24881 FFx Basket Scanner is a global tool scanning all pairs and all timeframes over up to five indicators among the 16 available. You will clearly see which currencies to avoid trading and which ones to focus on. Once a currency goes into an extreme zone (e.g. 20/80%), you can trade the whole basket with great confidence. Another way to use it is to look at two currencies (weak vs strong) to find the best single pairs
MetaTrader 4 version available here: https://www.mql5.com/en/market/product/25793 FFx Pivot SR Suite PRO is a complete suite for support and resistance levels. Support and Resistance are the most used levels in all kinds of trading. Can be used to find reversal trend, to set targets and stop, etc. The indicator is fully flexible directly from the chart 4 periods to choose for the calculation: 4Hours, Daily, Weekly and Monthly 4 formulas to choose for the calculation: Classic, Camarilla, Fibonac
ClassicSBA
Umri Azkia Zulkarnaen
this indicator very simple and easy if you understand and agree with setup and rule basic teknical sba you can cek in link : please cek my youtube channel for detail chanel : an for detail info  contact me  basicly setup buy (long) for this indicator is Magenta- blue and green candle or magenta - green  and green candlestik and for setup sell (short) is Black - yellow - and red candle or black - red  and red candlestik
Pendiente de Precio
Cesar Juan Flores Navarro
Indicador en base a la pendiente de la linea de precio, dibuja una línea de color cuando sube a base de los precios que previamente has sido procesados o linealizados, y cuando baja la pendiente la linea linealizada toma otro color. En este caso se a considerado 6 lineas de diferentes procesos desde pendientes largas hacia las cortas, observándose que cuando coincidan las pendientes se produce un máximo o mínimo, lo que a simple vista nos permitirá hacer una COMPRA O VENTA.
Индикатор Coefficient Of Determination (COD) представляет собой значение коэффициента детерминации или квадрат коэффициента корреляции между зависимой переменной — ценой и объясняющей переменной — тиковым объемом. Что это дает нам на практике? COD отлично распознает кульминацию трендовых движений, что позволяет подбирать оптимальные точки и ловить развороты рынка. Как использовать индикатор: Наиболее популярная торговая стратегия строится совместно с трендовым индикатором Moving Average (MA), пе
Fibonacci Multiple 12
Cesar Juan Flores Navarro
Fibonacci Múltiple 12, utiliza la serie fibonacci plasmado en el indicador fibonacci, aumentadolo 12 veces según su secuencia. El indicador fibonacci normalmente muestra una vez, el presente indicador se mostrara 12 veces empezando el numero que le indique siguiendo la secuencia. Se puede utilizar para ver la tendencia en periodos cortos y largos, de minutos a meses, solo aumentado el numero MULTIPLICA.
Linea Horizontal Inteligente
Cesar Juan Flores Navarro
En base a cálculos matemáticos de determino una linea Horizontal que cruza a todas las señales de trading, mostrando los máximos y mínimos. La linea horizontal parte en dos las subidas y bajadas de las señales de trading, de tan manera que es fácil identificar los máximos y mínimos, y es inteligente por que es sensible a las subidas y bajadas, afín de no quedarse en un solo lado por siempre, trabaja excelentemente con otros indicadores suavizadores ya que les garantiza que en un intervalo de tie
Spike Detector
Tete Adate Adjete
this indicator is a Spike detector indicator, it is specially designed to trade Boom 1000, Boom 500, Crash 1000 and Crash 500 We recommend using it on Deriv Boom and Crash indices only Its setting is intuitive, familiar, easy to use it has notification functions; audible notifications and push notifications. this tool is simple to use, easy to handle This update is based on different strategies for spikes
Limitless MT5
Dmitriy Kashevich
Limitless MT5 is a universal indicator suitable for every beginner and experienced trader. works on all currency pairs, cryptocurrencies, raw stocks Limitless MT5 - already configured and does not require additional configuration And now the main thing Why Limitless MT5? 1 complete lack of redrawing 2 two years of testing by the best specialists in trading 3 the accuracy of correct signals exceeds 80% 4 performed well in trading during news releases Trading rules 1 buy signal - the ap
Escalera Inteligente
Cesar Juan Flores Navarro
Indicador en MQL5, recibe la información del precio SUAVIZADO, lo procesa anulando los picos inteligentemente, y el resultado lo envía al desarrollo de la escalera que iniciara y subirá o bajara según el peldaño o INTERVALO ingresado Ingreso PERIODO = 50 (variar segun uso) Ingreso MULTIPLICA AL PERIODO = 1 (variar segun uso) Segun la configuración la escalera puede pegarse o separarse de los precios,, Se aplica toda la linea de tiempo, y a todas las divisas, etc.  
Fibonacci Suavizado
Cesar Juan Flores Navarro
Indicador en MQL5, que obtiene el promedio de 10 EMAS, que son alineadas según Fibonacci, obteniendo un promedio, que sera suavizado.  Se puede ingresar un numero desde 2 a N, que multiplica a los EMA-Fibonacci. Funciona en cualquier criptomoneda, etc. etc... pudiendo calcular el futuro segun la tendencia de las EMAS. Funciona excelentemente en tramos largos, determinando exactamente el mejor inicio/salida. El precio inicial por apertura sera por un periodo de tiempo, luego aumentará.
제작자의 제품 더 보기
Order Block Pro MT5
N'da Lemissa Kouame
Order Block Pro (MQL5) – 버전 1.0 작성자: KOUAME N'DA LEMISSA 플랫폼: MetaTrader 5 설명: Order Block Pro 는 차트에서 **강세 및 약세 오더 블록(Order Blocks)**을 자동으로 감지하는 고급 지표입니다. 횡보 캔들 이후 강한 상승/하락 캔들을 분석하여 가격이 급격히 움직일 가능성이 있는 주요 구간을 표시합니다. 트레이더에게 적합: 정확한 진입 및 청산 지점을 찾고 싶은 경우 동적 지지 및 저항 구간을 파악하고 싶은 경우 리스크 관리 및 거래 전략을 향상시키고 싶은 경우 주요 기능: 강세 OB 감지: 횡보 캔들 후 강한 상승이 발생하면 차트에 녹색 화살표 표시 약세 OB 감지: 횡보 캔들 후 강한 하락이 발생하면 차트에 빨간 화살표 표시 완전한 사용자 정의 가능: 횡보 캔들의 최대 실체 비율 ( BodyMaxRatio ) 다음 캔들의 최소 비율로 움직임 확인 ( NextCandleMinPct ) 차트 화살표
Canal H Pro
N'da Lemissa Kouame
NuageTrend Pro
N'da Lemissa Kouame
Nuage Trend Pro – 추세 추적 및 Kijun 신호 Nuage Trend Pro 는 MetaTrader 5 용 고급 지표로, 강력한 시장 추세 를 빠르게 파악하고 Kijun 교차를 통해 최적의 진입 지점 을 찾아줍니다. 차트를 명확한 시각적 지도 로 변환하여 정확하고 자신감 있는 트레이딩 을 지원합니다. 주요 기능 자동 Kijun 교차 감지 : 가격이 기준선을 넘는 중요한 순간을 즉시 표시. 동적 추세 구름 : 시장 방향에 따라 차트 색상이 변경됩니다 – 상승은 녹색, 하락은 빨강. 명확한 매수/매도 신호 : 거래 기회를 빠르게 식별 가능. 사용자 설정 가능 : Kijun 기간, 구름 색상, 표시 스타일을 전략에 맞게 조정 가능. Nuage Trend Pro를 선택해야 하는 이유 간단하고 직관적인 시장 추세 시각화 다용도 : 모든 타임프레임과 거래 상품(Forex, 지수, 원자재)에서 사용 가능 초보자부터 전문가까지 진입 및 청산 최적화 가능 다른 지표나
Pin Bar Pro v1
N'da Lemissa Kouame
Pin Bar Pro v1.0 – MQL5 지표 설명: Pin Bar Pro는 MetaTrader 5용 전문 지표로, 핀바(Pin Bar) 를 자동 감지하여 시장 반전을 예측합니다. 파란 화살표 → 매수 신호 빨간 화살표 → 매도 신호 특징: Pin Bar 자동 감지 화살표 커스터마이징 ( Arrow_Up_Code , Arrow_Down_Code ) 수직 오프셋 조정 ( Arrow_Offset_Pts ) 모든 심볼과 타임프레임 지원 매개변수: 매개변수 설명 기본값 Arrow_Up_Code 매수 화살표 코드 233 Arrow_Down_Code 매도 화살표 코드 234 Arrow_Offset_Pts 수직 오프셋 (포인트) 10 저자: KOUAME N’DA LEMISSA 버전: 1.0 – MQL5용
Monthly Levels Pro
N'da Lemissa Kouame
ENGLISH – Monthly Levels Pro v1.0 The Ultimate Monthly Market Levels Indicator Master key market zones at a glance. Monthly Levels Pro helps you analyze long-term trends and spot essential support and resistance levels by automatically displaying the High, Low, Open, and Close of a monthly candle. Why Choose Monthly Levels Pro? Instant Analysis – See monthly levels immediately without checking candles manually. Smarter Trading – Spot reversal or breakout zones at a glance. Clear Visuals –
지표 Monthly Levels + Pin Bar Pro 설명 Monthly Levels + Pin Bar Pro 지표는 월간 주요 레벨 (고가, 저가, 시가, 종가) 과 가격 행동 반전 패턴 (Pin Bar) 의 자동 감지를 결합합니다. 기술적 트레이더와 기관 투자자를 위해 설계되었으며, 시장 반응 구역을 예측하고 차트에 명확한 시그널을 표시합니다. 주요 기능 자동 월간 레벨 : 고가, 저가, 시가, 종가. 실시간 Pin Bar 탐지 (강세 & 약세). 시각적으로 명확한 표시 : 수평선 + 신호 화살표. ️ 사용자 정의 가능 : 타임프레임, 화살표 코드, 크기, 오프셋. 최적화됨 : 낮은 리소스 사용, 스캘핑 & 스윙에 적합. ️ EA 호환 : 자동매매 전략에 통합 가능. ️ 사용 방법 원하는 차트에 지표를 추가합니다. 월간 고가, 저가, 시가, 종가 가 자동으로 표시됩니다. 화살표 확인: 파란색 화살표 → 강세 Pin Bar (월간 지지선
Yearly Levels Pro
N'da Lemissa Kouame
8️⃣ 한국어 (Korean) 버전: 1.0 개발자: KOUAME N'DA LEMISSA 플랫폼: MetaTrader 5 (MT5) 종류: 기술 지표 / 연간 가격 수준 설명: Yearly Levels Pro v1.0는 KOUAME N'DA LEMISSA가 개발한 강력한 지표로, 연간 주요 가격 수준을 빠르게 식별할 수 있습니다. 특정 연도의 시가, 고가, 저가, 종가 를 자동으로 계산하여 차트에 색상 수평선으로 표시합니다. 주요 기능: High(빨강), Low(파랑), Open(녹색), Close(주황) Year_Shift 로 연도 선택 가능 모든 상품과 시간 프레임 호환 실시간 자동 업데이트 매개변수: Year_Shift : 0 = 올해, 1 = 작년, 등 특징: 간단하고 직관적 연간 지지/저항 수준 확인 가능 장기 트레이딩 분석에 최적 사용 팁: High/Low 라인으로 지지/저항 영역 확인 현재 가격과 Open/Close 비교로 추세 분석 캔들 패턴 또는 다른 지표와 결합
Quarterly Levels Pro
N'da Lemissa Kouame
Korean Version (한국어) Quarterly Levels Pro v1.0 – 상업 공지 제품명: Quarterly Levels Pro v1.0 개발자: KOUAME N'DA LEMISSA 버전: 1.0 설명: Quarterly Levels Pro 는 KOUAME N'DA LEMISSA 가 개발한 MetaTrader 5 용 전문 지표로, 분기별 High, Low, Open, Close 레벨을 자동으로 표시합니다. 트레이더는 차트에서 주요 지지 및 저항 구간을 명확히 시각화하여 중기 거래 의사결정을 용이하게 할 수 있습니다. 주요 기능: 분기별 High, Low, Open, Close 레벨 자동 표시 각 레벨 색상 사용자 지정 가능: High: 빨강 Low: 파랑 Open: 초록 Close: 주황 시각적 구분을 위한 선 굵기 조절 가능 Quarter_Shift 파라미터를 사용하여 현재, 이전 또는 이전 분기 레벨 표시 가능 MT5의 모든 통화쌍 및 금융상품과 호환 파라
Marubozu Pro MT5
N'da Lemissa Kouame
Commercial Description – Marubozu Pro (MT5) Description Marubozu Pro is a professional indicator for MetaTrader 5 that automatically detects Marubozu candles (bullish and bearish) directly on your chart. It helps traders identify strong market momentum where buyers or sellers take full control, by displaying clear visual arrows for buy and sell signals. This tool is designed to be simple, effective, and fast , perfect for manual trading or as a filter in automated strategies. Key Features
ETE Detector – Head & Shoulders Indicator Turn your charts into clear and actionable trading opportunities! About the Indicator The ETE Detector automatically identifies Head & Shoulders (H&S) and Inverse Head & Shoulders (IH&S) patterns — classic trend reversal formations. No more spending hours searching manually: your analysis becomes fast, accurate, and visual . What You Get Automatic detection of trend reversal patterns Colored arrows : green for buys (Inverse H&S), red for sell
Fusion Monthly Levels + PinBar + Marubozu 설명 이 독특한 지표는 세 가지 강력한 기술 분석 도구를 하나로 결합합니다: 월간 레벨 (High, Low, Open, Close) – 주요 지지 및 저항 구간을 식별하기 위해. PinBar 감지 – 가격 반전을 신호하는 신뢰할 수 있는 캔들 패턴. Marubozu 감지 – 강한 추세 캔들로 방향성 모멘텀을 나타냅니다. 이 결합을 통해 시각적이고, 종합적이며 반응 속도가 빠른 시장 예측 도구를 사용할 수 있습니다. 장점 기관 레벨 + 가격 행동(Price Action) 결합. 명확한 시각 신호: PinBar는 파랑/빨강 화살표, Marubozu는 파랑/빨강 사각형. 모든 자산에 사용 가능 (외환, 지수, 암호화폐, 원자재, 주식). 사용자 정의 가능한 매개변수 (참조 기간, 꼬리 길이, 화살표 스타일). 최적화된 코드, 여러 차트에서도 지연 없음. MetaTrader 5 완전 호환. 신호 강
ABCD Lemissa + 월간 레벨 + 핀바 + 마루보즈 지표 설명 이 지표는 여러 강력한 도구를 통합 하여 시장 전체를 시각적으로 분석할 수 있도록 설계되었습니다. ABCD Lemissa – ABCD 패턴 을 자동으로 감지하고 A, B, C, D 지점, 지지/저항 구역 및 매수/매도 화살표를 표시합니다. 월간 레벨 (Monthly Levels) – 월간 캔들의 High, Low, Open, Close 레벨을 표시하여 중요한 구역을 식별합니다. 핀바 & 마루보즈 – 핀바 캔들 (반전 신호)과 마루보즈 캔들 (강력한 추세 캔들)을 자동으로 감지하며, 커스터마이즈 가능한 화살표 및 심볼을 제공합니다. 이 지표는 완전히 시각적 이며, 라인, 화살표, 사각형을 결합하여 시장 분석과 거래 결정을 지원합니다. 주요 기능 ABCD Lemissa A, B, C, D 포인트 자동 감지 BUY 및 SELL 신호 화살표 표시 X1 / X2 사각형으로 지지 및 저항 구역 강조 월간 레벨 월간
ETE Detector v4.0 (Head & Shoulders) Author: KOUAME N’DA LEMISSA Version: 4.0 Platform: MetaTrader 5 Indicator Type: Chart / Visual Trading Signals Overview The ETE Detector v4.0 is a technical indicator designed to automatically detect classic and inverse Head & Shoulders patterns (H&S) on MT5 charts. These patterns are widely used to anticipate trend reversals. With this tool, traders can: Detect sell signals (classic H&S) and buy signals (inverse H&S) with accuracy. Easily visualize patterns
ETE Detector puissant
N'da Lemissa Kouame
Aperçu – ETE DETECTOR POWER v5.0 (pour plus d'informations) "헤드 앤 숄더" 패턴 자동 감지 ETE DETECTOR POWER v5.0 est maintenant disponible en ligne . 도구입니다. Il s'agit d'une question de santé et de sécurité . 최적화된 객체 관리 시스템(MaxObjects) 덕분에, 바쁜 차트나 다중 시간 프레임에서도 지표가 C'est vrai. 주요 기능 Nom du produit :  H&S(매도) et H&S(매수) 어깨, 머리, 넥라인 명확하게 표시 반전 구간 자동 표시 (빨강=매도, 초록=매수) ACHETER/VENDRE 화살표 로 즉시 기회 표시 순환 객체 풀 로 스마트 관리 완전 사용자 설정 가능: 분석 캔들 수, 최소 거리, 대칭 허용 범위, 최대 패턴 수, 직사각형 스타일, 마커 크기 및 색상 트레이더 장점 시간 절약:
Dynamique mensuelle des plages hautes et basses v1.0 Auteur : KOUAME N'DA LEMISSA Description : L' indicateur dynamique mensuel de fourchette haute et basse affiche les niveaux mensuels clés sur votre graphique grâce à des fonctionnalités avancées de suivi dynamique. Il permet aux traders de visualiser facilement les zones de support et de résistance mensuelles, ainsi que les zones où le prix tend à dépasser ou à tester ces niveaux, offrant ainsi des opportunités de trading précises. P
Monthly High & Low Dynamic Range + Liquidity Zones v1.2 Author: KOUAME N'DA LEMISSA Description: Transform your market analysis with this powerful indicator that combines: Key Monthly Levels: High, Low, Open, and Close to identify the most important support and resistance zones. Dynamic High/Low Range: Automatically tracks extreme price movements to detect significant market shifts. Liquidity Zones: Visual rectangles showing areas where liquidity is concentrated (Buy/Sell). The thickness and c
Booster Trading Pro V
N'da Lemissa Kouame
한국어 (coréen / 한국어) Booster Trading Pro Modèle  : KOUAME N'DA LEMISSA Modèle : MetaTrader 5 Modèle : 다기능 기술 지표 설명 Booster Trading Pro est également disponible en ligne. Il s'agit d'un sujet d'intérêt général : 월간 주요 레벨: 최고가, 최저가, 시가, 종가로 지지 및 저항 구역을 빠르게 식별. 동적 고저 범위: 월간 레벨 상하에서 가격의 극단적 움직임을 추적. 동적 시가 범위: 월간 시가 기준으로 중요한 가격 수준을 탐지. 자동 유동성 영역: 동적 색상 직사각형으로 잠재적 매수/매도 영역 시각화. 주요 특징 C'est vrai, c'est vrai. Je suis en train de le faire. Il s'agit d'une personne qui s'est occupée de lui. Il s'agit d'
StructureBlocksAuto + MensuelOU La puissance de la structure rencontre la précision mensuelle Description Fusion StructureBlocksAuto + MonthlyOR est un indicateur tout-en-un avancé combinant la détection de la structure du marché (swings automatiques, plus hauts/plus bas et blocs de structure) avec le système Monthly Open Range (MOR) . Il offre une combinaison professionnelle d'analyse de la structure institutionnelle et de niveaux clés mensuels pour vous aider à détecter les zones de tradi
Channel Ultima
N'da Lemissa Kouame
Channel Ultima – Indicateur Multi-Canal Dynamique Description courte Channel Ultima est un indicateur avancé qui trace automatiquement trois canaux dynamiques du marché. Il offre une lecture claire des zones de support, de résistance et d'équilibre , idéale pour les traders techniques et structurels. Présentation détaillée Channel Ultima détecte et affiche trois canaux indépendants associés sur les pivots majeurs et mineurs du marché. Chaque canal représente une zone de pression sur le p
Carte de liquidité institutionnelle Pro Voyez ce que voient les institutions — avant tout le monde Aperçu Institutional Liquidity Map Pro est un indicateur professionnel conçu pour cartographier les zones de liquidité institutionnelle à l'aide des niveaux mensuels les plus hauts et les plus bas . Il détecte automatiquement les zones de stop-hunt , les zones de retournement potentiel et les zones d'accumulation/distribution institutionnelles . L'indicateur suit dynamiquement jusqu'à trois ni
SMXZones
N'da Lemissa Kouame
SMXZones – Zones de liquidité pour investisseurs avertis Liquidités institutionnelles • Biais de marché • Signaux PinBar Auteur : KOUAME N'DA LEMISSA Investissez comme un investisseur avisé SMXZones est un indicateur de trading puissant conçu pour révéler les zones de liquidité institutionnelle, la structure du marché et la tendance directionnelle du marché . Cet outil aide les traders à voir clairement où les institutions accumulent des liquidités et où les mouvements de prix importants sont su
ICT Smart Pro
N'da Lemissa Kouame
ICT Smart Pro Argent intelligent – ​​Déséquilibre des TIC – Limites de temps institutionnelles – Structure du marché 설명 ICT Smart Pro propose Smart Money et ICT (Inner Circle Trader) pour votre entreprise . C'est vrai. 이 지표는 여러 기관용 도구를 하나로 통합하여, 대형 금융 기관이 시장에 진입하는 Il s'agit d'une personne qui s'est occupée de lui . ICT Smart Pro est actuellement disponible en ligne : TIC 불균형 영역 (BISI / SIBI) 기관 시간 사이클 월별 주요 가격 수준 시장 구조 영역 Il s'agit d'une personne qui s'est retrouvée dans une situation
Time Box Pro
N'da Lemissa Kouame
Logiciel MQL5 – TIME BOX PRO v2.0 개요 TIME BOX PRO v2.0 et MetaTrader 5 sont également disponibles en ligne . C'est vrai . Nombre de personnes : ANNÉE, SEMESTRE, TRIMESTRE , MOIS , SEMAINE, JOUR Les valeurs (HB 90 %, 50 %, 10 %) sont définies comme étant les mêmes que celles des autres. 전략 테스터, 모든 핵심 기간을 빠르고 C'est vrai. 주요 기능 멀티 타임프레임 : ANNÉE, SEMESTRE, TRIMESTRE, MOIS, SEMAINE, JOUR ️ 타임프레임별 컬러 박스 로 가격 범위 시각화 사용자 정의 HB 레벨 (90%, 50%, 10%) ️ 동적 레이블 로 기간 표시 (ANNÉE, S1, Q1, M1, SEMAINE,
필터:
리뷰 없음
리뷰 답변