YouTube'dan Mağaza ile ilgili eğitici videoları izleyin
Bir alım-satım robotu veya gösterge nasıl satın alınır?
Uzman Danışmanınızı
sanal sunucuda çalıştırın
sanal sunucuda çalıştırın
Satın almadan önce göstergeyi/alım-satım robotunu test edin
Mağazada kazanç sağlamak ister misiniz?
Satış için bir ürün nasıl sunulur?
MetaTrader 5 için teknik göstergeler - 26

Bu gösterge, fiyat ve göstergeler arasındaki farklılığı tespit etmek için klasik MACD ve Zigzag göstergelerini birleştirir. Ayrıca sapmanın geçerliliğini tespit etmek için gelişmiş yapay zeka (AI) teknolojisini de kullanır.
MACD "göstergelerin kralı" olarak bilinir ve Zigzag da çok faydalı bir göstergedir. Bu iki göstergeyi birleştiren bu gösterge, her ikisinin de güçlü yanlarından yararlanır.
Farklılığın tespiti olasılıksal bir problemdir. Çoğu zaman, farklılıklar yalnızca aynı yönde daha fa

Market Trading Sessions is an indicator that identifies major market sessions such as:
London (09:00 - 18:00 UTC+2) New York (15:00 - 00:00 UTC+2) Sydney (23:00 - 8:00 UTC+2) Tokyo (02:00 - 11:00 UTC+2)
It displays each session’s start and end times, along with its high and low, providing traders with a clearer view of price volatility throughout the day. The indicator offers high customizability, allowing you to adjust session times and modify the plotting style to match your preference.
If yo
FREE

Momentum Reversal, fiyat hareketlerinin yoğunluğunun ve çubuk oluşumlarının analizine dayanan olası ters noktaları tespit etmek ve düzeltmeye başlamak için güçlü bir araçtır.
_________________________________
Gösterge sinyalleri nasıl kullanılır:
Gösterge, yeni bir fiyat çubuğunun ortaya çıkmasından sonra bir sinyal oluşturur. Oluşturulan sinyalin, belirtilen yönde kritik bir noktaya çarptıktan sonra kullanılması önerilir. Gösterge sinyallerini yeniden çizmiyor.
____________________________
FREE
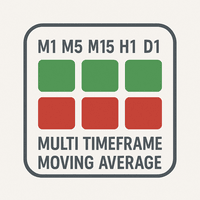
The "MultiTF Moving Average Panel" indicator is more of a helping tool than an indicator, it serves to help know the trend direction for the current currency pair of all timeframes in one place. It is best used with other indicators and signals, to help filter the signals according the trend based on multiple timeframes.
Indicator inputs : - Moving Average period : Default is set to 34. - Moving Average method : The method of calculation of the Moving Average. Default is set to Exponent
FREE

Price and Spread Indicator
Version: 1.0 Developer: Creative Tech Solutions Website: https://www.creativetechsolutions.co.uk
Overview The Price and Spread Indicator is a great tool for MetaTrader 5 that displays the Ask and Bid prices along with the spread directly on the chart. This indicator provides real-time updates and allows traders to make informed decisions based on accurate price information.
Features - Real-time Price Updates: Continuously updates Ask and Bid prices. - Spread Disp
FREE

The Market Momentum indicator is based on the Volume Zone Oscillator (VZO), presented by Waleed Aly Khalil in the 2009 edition of the International Federation of Technical Analysts journal, and presents a fresh view of this market valuable data that is oftenly misunderstood and neglected: VOLUME. With this new approach of "seeing" Volume data, traders can infer more properly market behavior and increase their odds in a winning trade.
"The VZO is a leading volume oscillator; its basic usefulness
FREE
FULL VERSION https://www.mql5.com/en/market/product/145203?source=Site https://www.mql5.com/en/users/gedeegi/seller
GEN TurboTrend Signals is an adaptive volatility-based trend indicator designed to help traders identify dominant trend directions, key momentum transition points, and projected profit-taking zones in a visual and intuitive manner. The indicator utilizes a temporally-weighted moving average combined with statistical dispersion via standard deviation to construct a dynamic volati
FREE

It is the very same classic Stochastic indicator, but with a little twist: we changed the Signal Line with a 2-color line, so we can use it with EAs as a filtering system. And that's it! I know it could seem stupid but I needed that, so I created it. The original formula is right from Metaquote's chest, no additions, no subtractions, it is Stochastics in its core.
So I will not publish here the Stochastics parameters as they are all the same as always... Enjoy!
If you like this indicator, all I
FREE

UT Bot Alerts is a technical indicator for MetaTrader 5 that highlights potential directional changes based on momentum conditions.
The indicator marks signal points directly on the chart and can generate optional notifications for convenience. The signal generation logic can operate in two modes: Closed-bar mode: signals are confirmed only after the bar closes. Live-bar mode: signals are displayed during the formation of the current bar. Both modes are available depending on the user's preferr

Zone Alerts by iXOpay - MT5 Indicator What it is Indicator that marks price zones and sends alerts when the price touches, breaks, exits, or retests those zones. Neutral, informative tool. No promises of profit. How to use Attach to any symbol and timeframe. Set the zone boundaries and enable the desired events. Optionally enable trend/volatility filters. Receive alerts and manage your plan. Inputs EMA_Period (20/50/100/200) - optional trend filter Stoch_K , Stoch_D , Stoch_Smooth - confirmation
FREE

We at Minions Labs love to study, challenge and discover new facts about Price Behavior in current markets. We would NOT call it Price Action because today this is a word totally overused and means, thanks to the False Prophets out there, absolutely NOTHING.
The study hypothesis we propose is this: Some Assets, in certain Timeframes, present a behavior of Price continuity when the candlesticks close without a Wick on them... So the purpose of this indicator is to "color" those candlesticks who
FREE

FusionAlert StochRSI Master is an indicator available for MT4/MT5 platforms, it is a combination of RSI & Stochastic indicator which provide "alerts" when the market is inside "overbought and oversold" regions combined for both indicators, results in more precise and accurate signals to be used as a wonderful tool, in the form of "buy or sell" signals. This indicator comes with many customization options mentioned in the parameter section below, user can customise these parameters as needful. Jo
FREE
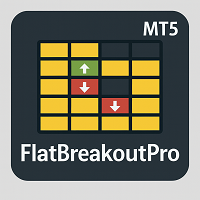
FlatBreakoutPro MT5 Multi-Symbol Flat Panel and Breakout Detector for MT5 FlatBreakoutPro MT5 is a professional tool for modern traders, designed to detect and monitor flat (sideways) zones and instantly react to breakouts across multiple instruments and timeframes. The indicator uses transparent fractal logic, guarantees clear non-repainting signals, and provides full visual control of the market situation. Who Is This Product For? Active traders who prefer breakout trading strategies (range br

Bollinger Bands Stop Indicator holds significant importance for traders navigating the complex world of financial markets. Its relevance lies in several key aspects. Firstly, it aids in trend identification. By analyzing price movements relative to the Bollinger Bands, traders can discern whether the market is in an uptrend, downtrend, or ranging phase. Secondly, the indicator provides valuable insights into market volatility. Wider bands indicate higher volatility, while narrower bands suggest
FREE
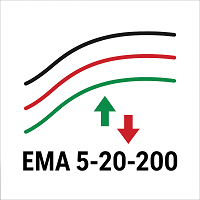
Description (English) EMA 5-20-200 Cross Alerts (Fixed Alerts, No Repaint) This indicator combines three popular EMAs (5, 20, and 200) to help traders identify short-term, mid-term, and long-term trends.
With visual arrows on the chart and automatic alerts (popup & push notification) , it allows traders to catch entries and trend confirmations without constantly monitoring the screen. Key Features: Plots EMA 5, EMA 20, and EMA 200 directly on the chart. Generates Buy/Sell signals (EMA5 vs
FREE
The Sessions and Bar Time indicator is a professional utility tool designed to enhance your trading awareness and timing precision on any chart. It combines two key features every trader needs — market session visualization and real-time bar countdown — in one clean, efficient display. Key Features: Candle Countdown Timer – Shows the remaining time before the current candle closes, helping you anticipate new bar formations. Market Session Display – Automatically highlights the four main trading
FREE
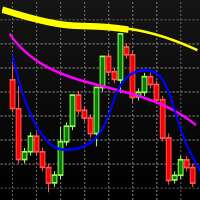
Baseado no indicador MIMA SAR, que é uma combinação dos indicadores MIMA Consolidação e MIMA Tendência, da metodologia Phicube. O indicador é composto pelos 8 fractais, 17,34.72.144.305,610.1292,2554. Sendo a tendência indicada pelas linhas finas e a consolidação pelas linhas mais espessas. Para usar o indicador de maneira adequada deve-se partir do princípio de que tudo na natureza segue o caminho que oferece menor resistência. Isso significa que para uma reversão da tendência ocorrer nesse mod
FREE

RiskKILLER_AI Navigator, AI tabanlı, Çok-Zamanlı Pazar Yönü ve Strateji Asistanıdır. İşlem performansı, piyasayı profesyoneller gibi anlamakla ilgilidir. RiskKILLER_AI Navigator tam olarak bunu sunar: MQL5'in dışında çalışan AI destekli trend, sentiman ve makro analiz ile işlem tarzınıza uygun kurumsal seviyede içgörüler elde edin. Satın alma sonrası, Kullanım Kılavuzu'nu almak için: 1. bir yorum yayınlayarak isteyin 2. bana doğrudan mesaj gönderin. [ Özel grup | Sürüm MT5 - MT4 ]
Temel Faydala

Dünyanın ana pazarlarında geçerli saati gösteren gösterge. Ayrıca geçerli oturumu da görüntüler. Kullanımı çok kolay. Grafikte fazla yer kaplamaz. Expert Advisors ve VirtualTradePad gibi diğer panellerle birlikte kullanılabilir. Klasik tarz versiyonu. Sevgili dostlarımız ve EA'larımızın kullanıcıları, lütfen değerlendirmelerinizi Yorumlar bölümüne ekleyin. Forex yazılımımızdaki tüm güncellemeler ücretsizdir ! Bu ücretsiz bir ticaret aracıdır! Diğer özellikler: Giriş parametrelerinde
FREE

Volume Weighted Average Price (VWAP) is a trading benchmark commonly used by Big Players that gives the average price a Symbol has traded throughout the day. It is based on both Volume and price. This indicator contains Daily VWAP and MIDAS' VWAP, which means you are able to anchor the beggining of MIDAS' calculations and, therefore you will be able to use this methodology to study price versus volume moves after anchor point. You will be able to anchor up to 3 HIGH MIDAS VWAP's and 3 LOW.
Wish
FREE

Introduction
The SuperBands Indicator is a sophisticated technical analysis tool designed to provide traders with a clear visual representation of price movements within well-defined bands. This indicator is specifically engineered to filter out minor price fluctuations and market noise, offering traders a more accurate and reliable view of price trends and potential reversal points.
Signal
Buy when price breaks below the "Extremely oversold" band (darker red color) and then closes abo
FREE

What are Donchian Channels? Donchian Channels are three lines generated by moving average calculations that comprise an indicator formed by upper and lower bands around a mid-range or median band. The upper band marks the highest price of a security over N periods while the lower band marks the lowest price of a security over N periods. The area between the upper and lower bands represents the Donchian Channel. Career futures trader Richard Donchian developed the indicator in the mid-twentieth c
FREE
TW Volume Signal Pro MT5 , gelişmiş yapay zeka teknolojileri ve özel akıllı algoritmalar kullanarak altın piyasasında daha güvenli işlem yapmanıza olanak tanır ve size benzersiz ve eşi benzeri olmayan bir işlem deneyimi sunar.
Altın piyasasında yüksek doğrulukta ve olağanüstü işlem sinyalleri mi arıyorsunuz? TW Volume Signal Pro MT5 ile profesyonel bir yatırımcı olabilir ve altın piyasasında büyük başarı elde edebilirsiniz. Öyleyse, ücretsiz deneyin!
TW Volume Signal Pro MT5'in Temel Özellikl

The Color Candles Indicator uses custom colors to highlight candles that follow the main market trend, based on the Moving Average. This simplifies the analysis of price movements, making it clearer and more direct. When the price is above the rising Moving Average, candles are highlighted indicating a BUY opportunity. When the price is below the declining Moving Average, candles are highlighted indicating a SELL opportunity.
Input Parameters : Period Method Applied Price
The moving averages
FREE

Introducing the Professional Arka STM Signal Indicator
With Arka Candle Close Time – 100% Free Version Fast, Accurate, and Unmatched in Identifying Trading Opportunities
This indicator is the result of combining advanced price action analysis with specialized market algorithms, delivering clear, timely, and profitable signals. Completely Free – No Installation or Usage Limits
️ An automated trading bot, fully synchronized with it, is also ready to run. The Power of ARKA STM Signa
FREE

Pivot Points Classic – L’indicatore essenziale per ogni trader tecnico Questo indicatore disegna automaticamente i livelli di Pivot Point più utilizzati dai trader professionisti, con supporto completo a 4 metodi di calcolo: Metodi supportati :
• Traditional
• Fibonacci
• Woodie
• Camarilla Caratteristiche principali :
Calcolo su timeframe superiore (multi-timeframe)
Visualizzazione chiara dei livelli P, R1, R2, R3, S1, S2, S3
Etichette dinamiche con nome e valore del livello
Colori per
FREE

Basic Support and Resistance Göstergimiz, teknik analizinizi artırmak için ihtiyacınız olan çözümdür.Bu gösterge, destek ve direnç seviyelerini grafikte yansıtmanıza olanak tanır/ MT4 sürümü
Özellikler
Fibonacci seviyelerinin entegrasyonu: Fibonacci seviyelerini destek ve direnç seviyelerinin yanı sıra görüntüleme seçeneğiyle, göstergemiz size piyasa davranışı ve olası tersine dönme alanları hakkında daha derin bir fikir verir.
Performans Optimizasyonu: Genişletilmiş satırları yalnızca her ç

If you love this indicator, please leave a positive rating and comment, it will be a source of motivation to help me create more products <3 How to use SuperTrend? When the price crosses above the supertrend line it signals a buy signal and when the price crosses below the supertrend line it signals a sell signal. The supertrend indicator which acts as a dynamic level of support or resistance and helps traders make informed decisions about entry and exit points. When prices are above s upertre
FREE
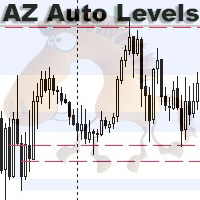
AZ Auto Levels builder ATR edition Indicator of automatic level drawing. For different instruments you need to play with the parameters to find the right ones. So, what is its idea - the indicator searches for levels of interest on the timeframe selected in the settings (by default H1). The search occurs only on candles that are 30% greater than the standard daily ATR of similar candles (you can change this in the settings). ATR is calculated for 20 days ago (also can be changed in the settings)
FREE

Market Sessionsync** is a cutting-edge trading session indicator designed to enhance your trading experience by visually breaking down the market's daily rhythm. With a compact window overlaid on your chart, this indicator provides a split-second understanding of the current trading session through: Basic setup: Set Difference between your local time and your broker time , set DST(Daylight Saving Time) ON or OFF , set timescale sync you want to use (Local, Broker, CET) - A vertical time marker
FREE

Indicator Name: CM EMA Trend Bars Overview: The CM EMA Trend Bars indicator is a straightforward yet effective tool that changes the color of price bars based on their relationship to the Exponential Moving Average (EMA). This visual cue helps traders quickly identify trend direction and potential trading opportunities. Key Features: Dynamic Bar Coloring: The indicator changes the color of the bars depending on whether they are above or below the EMA, providing a clear visual representation of t
FREE

This indicator is a volume indicator it changes the color of the candles according to a certain number of ticks, and this number of ticks can be informed by the user both the number of ticks and the color of the candles, this indicator works in any graphical time or any asset, provided that the asset has a ticker number to be informed.
This indicator seeks to facilitate user viewing when analyzing candles with a certain number of ticks.
FREE

The Supertrend etradro indicator is volatility based and is more of a trend following indicator in function. The ATR indicator, which is integrated into the calculation of the super trend, also calculates course gaps (gaps) and does not overlook them. This allows more accurate values to be calculated. When measuring volatility, the mean value of the current price serves as the basis. Since the Supertrend indicator features sliding stop and reversal lines, it is quite similar in function to the P
FREE

If you like this project, leave a 5 star review. Often times we are using brokers that are outside of the GMT-0 timezone, this
not only complicates things, but, it can make seeing when a trading session starts
a bit more difficult than it should. This indicator allows you to set a timezone offset it will draw a vertical line for the: Day. Week. Month. Quarter. year.
FREE

Colored Moving Average – Visual Trend Clarity Made Simple The Colored Moving Average is a clean and effective trend visualization tool that enhances any trading strategy. Unlike standard moving averages, this indicator dynamically changes color based on the direction of the trend—green when rising, red when falling—making it easy to spot shifts in momentum at a glance. Perfect for scalping, day trading, or swing trading, this indicator helps you: Instantly identify bullish and bearish phases Fi
FREE

[ How to use the Demo version ] [ MT4 Version ] AO unpaid divergences MT5 AO unpaid divergences is the first indicator developed to detailed analyze Regular and Hidden Divergences. It uses this analysis to find out possible entry points and targets. Below some of the characteristics of this indicator: Time saving Highly customizable Working for all pairs (Crypto, Forex, Stocks, Indices, Commodities...) Suitable for Scalping or Swing trading Possible reversal swings Alerts and Notifications on M
FOTSI – Forex Gerçek Güç Endeksi Her dövizin gerçek gücünü keşfedin ve avantajla işlem yapın. FOTSI Göstergesi , tüm ana dövizlerin (USD, EUR, GBP, JPY, CHF, AUD, CAD, NZD) momentumunu tüm paralar üzerinden ölçen bir çoklu döviz osilatörüdür . Tek bir grafiği analiz etmek yerine, FOTSI birden fazla paranın verilerini birleştirir, hareketleri düzeltir ve her dövizin göreli gücünü net, stabil ve gecikmesiz göstermek için True Strength Index (TSI) algoritmasını uygular. Temel Özellikler Çoklu döviz

English
VWAP Daily (Clean) is a simple and lightweight indicator that plots the classic Daily VWAP (Volume Weighted Average Price) directly on your MT5 chart. Features: Classic Daily VWAP calculation Supports real volume (if available) or tick volume Timezone offset option to match your broker’s server time Weekend merge option (merge Saturday/Sunday data into Friday) Clean version → no arrows, no alerts, only VWAP line VWAP is widely used by institutional traders to identify fair value, su
FREE
Multi-Period EMA is a convenient indicator that displays multiple Exponential Moving Averages (EMAs) on a single chart. It is designed to help traders easily identify market trends and key crossover points without the need to add multiple individual EMA indicators. Key Features: Multiple EMAs in one: Simplifies chart analysis by combining several EMA lines into one indicator. Fully customizable: Easily change the period (default 20, 50, 100, 200), color, and thickness of each EMA line. Clean in
FREE
Hi Traders, The Volume Spike Alert Indicator is a lightweight, non-lagging tool designed to help traders identify unusual volume activity in real time . This indicator calculates the average tick volume over a user-defined number of previous bars and compares it with the current candle’s volume . When the current volume exceeds the average by a specified percentage, the indicator triggers alerts, allowing traders to quickly spot potential breakouts, institutional activity, or strong market inter
FREE

BU GÖSTERGE, EA'NİN BİR PARÇASIDIR: HIPERCUBE PRO GALE BTC Darwinex Zero için %20 indirim kodu: DWZ2328770MGM_20
Donchian Göstergesinin Yeni Sürümünü Tanıtıyoruz
Donchian göstergesinin yeni sürümünü sunmaktan heyecan duyuyoruz. En son geliştirmeler ve artırılmış hassasiyetle tasarlandı. Artık tamamen HiperCube Pro Gale için uyarlanmış olan bu güncellenmiş araç, daha etkili ticaret için sorunsuz bir deneyim sunuyor.
Bu sürüm neden bir dönüm noktasıdır:
HiperCube Pro Gale için uyarlanmıştı
FREE

HiLo Ladder , klasik HiLo göstergesinin yeniden yorumlanmış bir versiyonudur ve trader’lar tarafından piyasa trendlerini ve olası dönüş noktalarını belirlemek için yaygın olarak kullanılmaktadır. Geleneksel versiyonun aksine, HiLo Ladder adım formatında — popüler “merdiven çizgileri” ile — gösterilir, bu da fiyat hareketlerinin çok daha net ve anlaşılır bir şekilde okunmasını sağlar. Başlıca avantajlar: Yükseliş (yeşil) ve düşüş (kırmızı) evrelerinin sadeleştirilmiş görselleştirilmesi. Klasik
FREE
Advanced UT BOT ALERTS for MT5 Profesyonel Çok Katmanlı Trend Tespit Sistemi | Geliştirilmiş UT BOT Motoru Yalnızca yüksek kaliteli göstergeler sunuyoruz. Advanced UT BOT , profesyonel kullanım için tasarlanmıştır.
Kararlı sinyal mantığı ve güvenli hesaplama yapısı sayesinde gecikme veya hatalı güncelleme olmaz.
Geçmiş sinyalleri yeniden çizmez, değiştirmez veya silmez.
Tüm BUY ve SELL sinyalleri mum kapanışı gerçekleştikten sonra oluşturulur ve sabitlenir.
Canlı işlem sırasında repaint yoktur
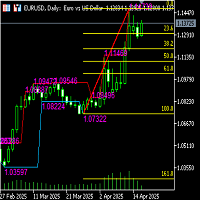
Functional description of automatic Fibonacci line indicator (including high and low channel lines) Indicator name Automatic Fibonacci retracement line + high and low channel auxiliary
Functional introduction This indicator combines the automatically identified high and low points of the band, automatically draws the Fibonacci retracement/extension line, and draws the highest and lowest price channel lines of the current analysis interval to provide traders with clearer support/resistance refe
FREE
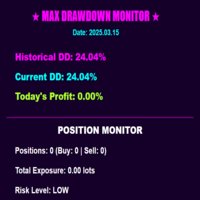
Monitor MaxDD Pro MaxDD Monitor Pro, profesyonel yatırımcılar için kapsamlı bir drawdown izleme aracıdır. Hem bakiye tabanlı hem de mevduat tabanlı drawdown metriklerini gerçek zamanlı olarak takip ederek riski etkili bir şekilde yönetmenize yardımcı olur. Özellikler arasında tarihi maksimum drawdown takibi, sembole özgü drawdown analizi, pozisyon izleme ve pozisyon hesaplama bulunur. Temel özellikler: Renkle kodlanmış uyarılarla gerçek zamanlı drawdown izleme Tarihi ve mevduat tabanlı drawdown'
FREE
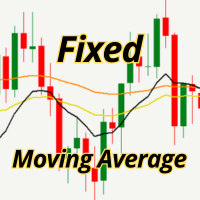
Display any moving average at its original timeframe, regardless of the chart’s timeframe.
What does it do?
This indicator allows you to view a moving average from any timeframe (M5, H1, H4, D1, etc.) directly on your current chart, preserving its original values from the timeframe you selected.
Practical example:
You are trading on the M5 timeframe.
You activate the H1 MA with this indicator.
You see exactly the same line you would see if you switched to H1.
Without changing the timefra
FREE

AP VWAP Bands Pro (MT5) Volume-weighted average price with ±σ bands for clear intraday bias, mean-reversion zones, and dynamic support/resistance. Works on crypto (incl. BTC) , FX , indices , and metals . Uses tick-volume when real volume isn’t available. What it shows VWAP line (volume-weighted mean price). Two envelopes around VWAP (default ±1σ and ±2σ) to highlight balance vs. extension. Reset modes : Day , Week , or Anchor Time (HH:MM) to start VWAP where you need it (e.g., exchange open).
FREE

Candle Detector By Mahefa R. General Description Candle Detector is an advanced technical indicator for MetaTrader 5 , designed to automatically detect and highlight the most important Japanese candlestick patterns directly on the price chart .
It allows traders to quickly identify market reversal and continuation setups without visual clutter. The indicator recolors only the candles that match the selected pattern , ensuring a clear, accurate, and professional chart analysis . ️ How It Work
FREE

In this indicator, Heiken Ashi candles are calculated with the most optimal method. You can also customize the results by adjusting the amount of period and method input. But the most important advantage of this indicator is the adjustment of the time frame value. You can use this to calculate the Heiken Ashi chandels to See in time frames with lottery in the lower time chart. In this case, you get the best signal to buy or sell using two or more Heiken Ashi indicators with different timeframes
FREE
RSI Bollinger DualStrike Signals offers a clear and structured approach to identifying areas that may be favorable for potential trend reversals. By combining the RSI with Bollinger Bands, the indicator highlights moments when price shows signs of pressure or loss of momentum. The BUY/SELL signals help traders make more organized and disciplined decisions. It is a useful tool for scalping, day trading, or swing trading not to predict the market, but to improve the reading and understanding of pr
FREE

Mouse Calculation, farenin işaret ettiği fiyat seviyesinde kapatırsanız her bir emrin kâr/zararını hızlıca hesaplar. Grid, martingale ve kademeli giriş gibi çoklu emir yönetiminde hızlı karar vermek için idealdir. Break-even ve hedef fiyat seviyeleri bir bakışta. Temel Özellikler Mouse PnL (M) : Emir bazında ve toplam P/L önizlemesi (swap dahil). Break even Price (B) : Sepetin break-even fiyatını / break-even çizgisini gösterir. Time_Sync_Lines (T) : Son N günün aynı saatini hizalayarak karşılaş
FREE

The POC_Levels indicator calculates and displays the 3 most frequently occurring price levels (Points of Control – POC) based on historical candles. It is useful for identifying areas of high market interest (like support/resistance zones) across any timeframe. How It Works
The indicator analyzes the last LookbackBars candles. It counts how many times each price level (based on the selected price type) appears. Then it selects the top 3 most frequent prices and draws horizontal lines at those l
FREE

The Stochastic Momentum Index (SMI), developed by William Blau and featured in the January 1993 edition of Technical Analysis of Stocks & Commodities magazine, introduces a unique perspective to trading analysis. Distinguished from the conventional Stochastic Oscillator, which evaluates the current close in relation to the recent x-period high/low range, the SMI assesses the close's position relative to the midpoint of this range. This innovation yields an oscillator with a range of +/- 100, re
FREE

Introduction To Time Box Indicator Time Box Indicator is a must have indicator for any trader. It will display daily, weekly and Monthly box according to your preferences. Yet, you can extend any important price levels in your chart automatically. You can use them as the significant support and resistance levels. It is very simple but effective tool for your trading.
Graphic Setting Use White Chart Line Style for Current Open price
Daily Setting Update Timeframe for daily box Number of days to
FREE
The WaveTrend Oscillator indicator is an enhanced version of the classic WaveTrend Oscillator, a momentum indicator. It is designed to identify overbought/oversold conditions and provide potential trend reversal signals. The core difference in this version is the application of a data "normalization" algorithm. This ensures the indicator's oscillation lines remain balanced around the zero line, causing the indicator window to always stay naturally centered. This is especially useful when trading
FREE
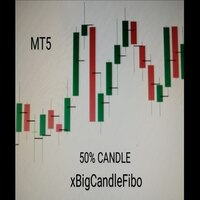
This indicator marks the 50% mark of each candle. It will help you make profitable scalping trades. If the next candle opens above the 50% mark of the previous candle, you should open a BUY position, and if the next candle opens below the 50% mark of the previous candle, you should open a SELL position. This strategy is very profitable. To make the most of it, keep an eye on the candle contexts on the left. Good luck!
FREE

The indicator shows your profit and loss (PnL) for the current day right on your trading chart. Anchored at the top-right corner, it displays "PnL: [amount]"—green if you’re up, red if you’re down, white if it’s zero. Every time you close a trade, it updates instantly, adding up your profits, commissions, and swaps from all buys and sells trades since midnight. No fuss, no extra charts—just real-time feedback on how your day’s going.
FREE
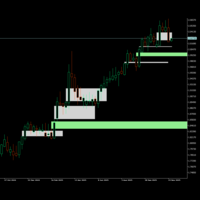
If you like this product, please give it a 5 star rating as a token of appreciation.
This indicator identifies and displays Fair Value Gaps (FVG) on price charts.
Fair Value Gaps are price zones where there's a significant imbalance between buying and selling pressure, creating "gaps" in price action. The indicator detects two types and when they are mitigated(touched):
Bullish FVG: When a candle's low is above the high of a candle two periods earlier.
Bearish FVG: When a candle's high is bel
FREE

If you love this indicator, please leave a positive rating and comment, it will be a source of motivation to help me create more products <3 How to use Slope Direction Line Uptrend: When the SDL line slopes up and turns from red to green, it shows that the price is trending up. This is also considered a buy signal. Downtrend: When the SDL line slopes down and turns from green to red, it shows that the price is trending down. This is also considered a sell signal. Sideways: When the SDL line mo
FREE

DailyHiLo Indicator
Master the daily range like a pro. This indicator automatically plots the previous day’s high and low levels —a core element in the (Beat The Market Maker) trading approach—directly on your chart. These levels act as natural boundaries for intraday price action, helping traders identify potential reversal zones, breakout points, and liquidity targets. Key Features Accurate plotting of yesterday’s high and low for any symbol and timeframe. Works seamlessly with BTMM-inspired
FREE
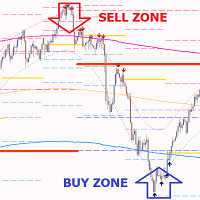
Gold PL MTF - bu iyi bir hisse senedi teknik göstergesidir. Gösterge algoritması varlık fiyatının hareketini analiz eder ve Fibonacci yöntemini (altın bölüm) kullanarak belirtilen zaman diliminin (TF) önemli Pivot Seviyelerini otomatik olarak yansıtır.
Gösterge, seçilen zaman diliminin (gün, hafta, ay, yıl) fiyat yörüngesini mükemmel bir şekilde tanımlar, bir trendin başlangıcını ve ters bir trende dönüşebilecek bir düzeltmenin başlangıcını belirler.
Gösterge ayrıca, fiyat mıknatısı görevi gö

Bir uyarı sistemi (açılır pencere, ses, e-posta, Telegram, WhatsApp) eklemek istiyorsanız, lütfen yorumlarda talep edin.
TrendPicoeur — Gösterge Açıklaması ve Kullanımı TrendPicoeur Göstergesi — Parabolic SAR (Parabolik SAR) algoritmasını uygular; gösterge yeniden çizilmez ( non-repainting ). Koşullar: SuperTrend algoritması ve bir volatilite algoritmasını birleştirir. Bu gösterge, iz sürücü stop ( trailing stop ), sinyal üreteci veya trend göstergesi olarak kullanılabilir. Bir Uzman Danışman
FREE
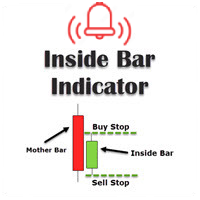
This inside bar indicator MT5 is suitable if you are doing inside bar trading. So what this MT5 inside bar indicator does is identifies inside bars for you as they form on your charts. Inside bar is a famous trading pattern in which the bar carry higher low and lower high compared with the previous bar, also known as mother bar. With, a lesser time frame like the 1 hour chart, daily inside bar chart will sometimes appears to be similar to a triangle pattern.
Inputs Settings for MA; AlertOn
FREE

Investment Castle Indicator has the following features: 1. Dictates the direction of the trend in different Timeframes . 2. Shows the hit rate and winning rate on the chart. 3. This indicator does not repaint the chart. 4. This indicator is built-in the Support & Resistance based Investment Castle EA which works with Psychological Key Levels "Support & Resistance" Indicator.
FREE

MT5 için uyarılar içeren Otomatik Sabit Aralık Hacim Profili
Bu gösterge, fiyatın nerede daha fazla zaman harcadığını gösterir ve ticarette kullanılabilecek önemli seviyeleri vurgular.
ve belirli bir ticaret seansının en önemli fiyat seviyelerini, değer alanını ve kontrol değerini özetleyerek zaman içindeki fiyat yoğunluğunu gösterebilir. Bu gösterge, M1 ile D1 arasındaki zaman dilimlerine eklenebilir ve günlük, haftalık, aylık ve hatta gün içi oturumlar için Piyasa Profilini gösterir. Daha d
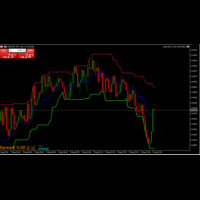
The Donchian Channel Indicator I created is a powerful tool for analyzing price trends and volatility. By plotting the highest high and lowest low over a specified period, it helps identify potential breakout opportunities and trend reversals. This indicator is valuable for traders seeking to understand market dynamics and make informed decisions based on price movements. Its simplicity and effectiveness make it an essential addition to any trading strategy.
FREE

This is a FREE Trend Direction Indicator for MetaTrader 5.
Features:
Identifies market trend direction
Uses EMA 50 and EMA 200
Non-repainting logic
Clear visual display
Suitable for manual trading
Free version includes:
- Single timeframe
- Trend direction only
- No alerts
If you need:
Alerts
Multi-timeframe version
EA automation
Custom modifications
My Name is Khalaf Hamza , You can contact me for freelance work --> khalaf.hamza.hi@gmail.com
FREE
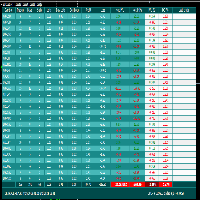
FCK Trade Report This indicator was developed by Fx Candle King. BEFORE CHOOSE CUSTOM PERIOD, GO TO TERMINAL WINDOW (ctrl+T), right click on ACCOUNT HISTORY and CHOOSE ALL HISTORY. This report searches the filtered data in your ACCOUNT CURRENT & HISTORY TRADE, Select your timespan for the report open and closed trades etc... Chose the report type - List only OPEN orders / List only CLOSED orders / List both OPEN and CLOSED orders
FREE

The MP Andean Oscillator is used to estimate the direction and also the degree of variations of trends. It contains 3 components: Bull component, Bear component and Signal component. A rising Bull component indicates that the market is up-trending while a rising Bear component indicates the presence of down-trending market. Settings: Oscillator period: Specifies the importance of the trends degree of variations measured by the indicator. Signal line per: Moving average period of the Signal line
FREE

Bu, tahmin etmeyi bırakıp stratejinizi anlama şansınız. 281 işlem takip edildi | %64 kazanma oranı | Geçmiş verilerde %70 risk-ödül oranı Bunlar sadece sayılar değil — bu stratejinin nasıl çalıştığını gösteren gerçek istatistikler. Daha akıllıca işlem yapmanın bir yolunu arıyorsanız, bu sizi oraya götürecek araçtır. Engulfing stratejisinin gerçeğini görmek hoşunuza gitti mi? Satın aldıktan sonra bize ulaşın , diğer ürünlerimizden birini ücretsiz olarak size sağlayalım.
Diğer ürünlerimize göz at
MetaTrader mağazası, geçmiş verilerini kullanarak test ve optimizasyon için alım-satım robotunun ücretsiz demosunu indirebileceğiniz tek mağazadır.
Uygulamaya genel bakışı ve diğer müşterilerin incelemelerini okuyun, doğrudan terminalinize indirin ve satın almadan önce alım-satım robotunu test edin. Yalnızca MetaTrader mağazasında bir uygulamayı tamamen ücretsiz olarak test edebilirsiniz.
Alım-satım fırsatlarını kaçırıyorsunuz:
- Ücretsiz alım-satım uygulamaları
- İşlem kopyalama için 8.000'den fazla sinyal
- Finansal piyasaları keşfetmek için ekonomik haberler
Kayıt
Giriş yap
Gizlilik ve Veri Koruma Politikasını ve MQL5.com Kullanım Şartlarını kabul edersiniz
Hesabınız yoksa, lütfen kaydolun
MQL5.com web sitesine giriş yapmak için çerezlerin kullanımına izin vermelisiniz.
Lütfen tarayıcınızda gerekli ayarı etkinleştirin, aksi takdirde giriş yapamazsınız.