Pivot Points Levels

2
Pivot Points Levels

Description

The Pivot Points Levels indicator is an advanced and comprehensive tool for technical analysis based on support and resistance levels calculated from pivot points. This free indicator combines 6 different calculation methods with support for multiple timeframes, offering a robust solution for identifying key price reversal and continuation areas.

Key Features

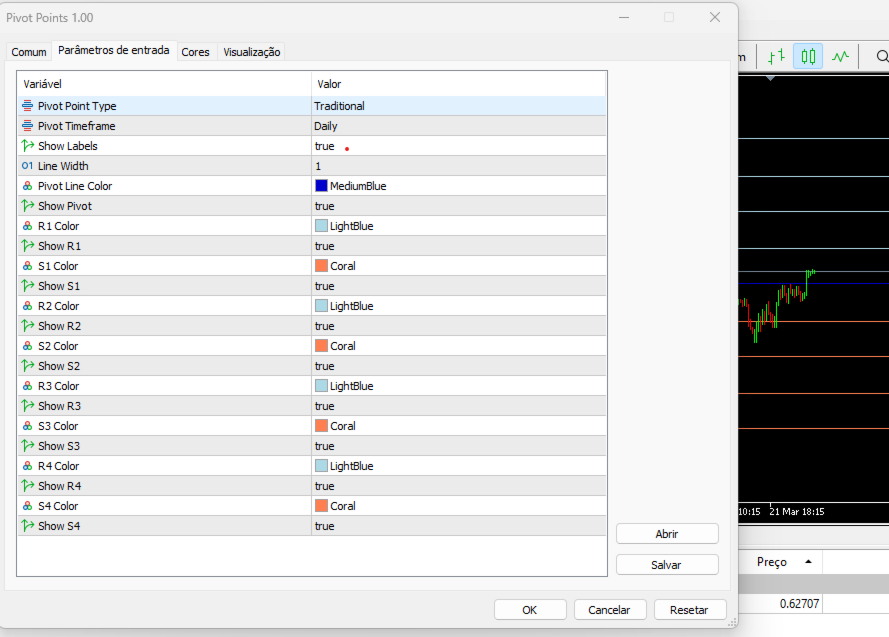
  • 6 Calculation Methods: Traditional, Fibonacci, Woodie, Classic, DeMark (DM), and Camarilla
  • Multi-Timeframe Support: Daily, Weekly, Monthly, Quarterly, and Yearly
  • Intelligent Auto-Adjustment: Automatically selects the most suitable timeframe based on the current chart
  • Complete Visual Customization: Colors, line thickness, and visibility for each level
  • Optional Labels: Clearly displays level names on the chart
  • Optimized Design: Efficient and organized code for fast performance

Practical Applications

  • Precise identification of key support and resistance areas
  • Definition of strategic targets for entries and exits
  • Recognition of potential reversal zones
  • Complement to price action strategies
  • Foundation for setting limit orders and stop losses

How to Use

  1. Install the indicator in MT5
  2. Choose the desired pivot points calculation method
  3. Select the appropriate timeframe (or use automatic mode)
  4. Customize colors and visual aspects according to your preference
  5. Observe the generated levels to identify important support/resistance zones

Technical Details

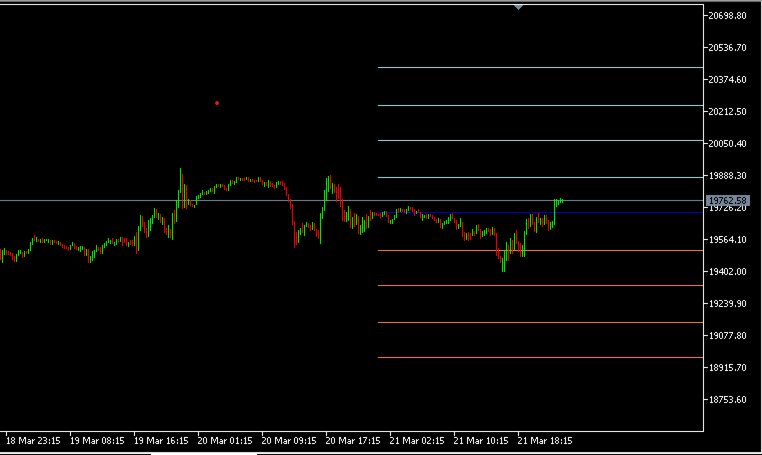
The Pivot Points Levels indicator automatically updates levels when a new period begins (day, week, month, etc.), ensuring that you always have the most recent data. The level lines are clearly visible on the chart and extend to the right, facilitating the planning of future operations.

Compatibility

Compatible with all versions of MetaTrader 5 and all currency pairs, indices, commodities, and other instruments available through your broker.


Önerilen ürünler
The   Pivot Point indicator   automatically calculates and displays the pivot point line and support and resistance levels. Pivot can be calculated according to the Classic, Floor, Fibonacci, Woodie, Camarilla or DeMark formula. It is also possible to select the period for calculating the indicator. A trader can choose from daily, weekly, monthly, or user-defined periods. Types of pivots Classic Floor Fibonacci Woodie Camarilla DeMark Main features The indicator shows the current and historic
FREE
Pivot Points are used by Forex traders to find support and resistance levels based on the previous day's price action. There are various ways to calculate pivot points, including averaging the open, high, low, and close of the previous day's chart price. Forex Traders use a combination of pivot points with moving averages to find trading opportunities in the currency markets. Pivot points are very useful tools that use the previous bars' highs, lows and closings to project support and resist
FREE
KS FX Oturum Uyarısı Göstergesi MetaTrader 5 için Forex piyasası oturumları göstergesi. Dört işlem oturumunu — Londra, New York, Tokyo ve Sidney — görsel olarak vurgular. ICT, SMC ve fiyat hareketi (price action) yatırımcıları için tasarlanan bu gösterge; temel oturum bağlamını sunar, volatilite dönemlerini ve piyasa hareketlerini öne çıkarır. Temel Özellikler Oturum Görselleştirme Dört oturuma kadarını (Londra, New York, Tokyo, Sidney), her biri için ayrı etkinleştirme/devre dışı bırakma seçene
FREE
Pivot Point Fibo RSJ, Fibonacci oranlarını kullanarak günün destek ve direnç çizgilerini izleyen bir göstergedir. Bu muhteşem gösterge, Fibonacci oranlarını kullanarak Pivot Point üzerinden 7 seviyeye kadar destek ve direnç oluşturur. Fiyatların, bir operasyonun olası giriş/çıkış noktalarını algılamanın mümkün olduğu bu destek ve direncin her bir düzeyine uyması harika. Özellikleri 7 seviyeye kadar destek ve 7 seviye direnç Seviyelerin renklerini ayrı ayrı ayarlayın Girişler Pivot Tipi Pivo
FREE
Raymond Cloudy Day Indicator for MT5 – Pivot-Based Reversal and Trend Levels Raymond Cloudy Day Indicator is a pivot-based level indicator for MetaTrader 5 (MT5). It was developed by Ngo The Hung based on Raymond’s original idea and is designed to give a structured view of potential reversal zones, trend extensions and support/resistance levels directly on the chart. The default settings are optimised for XAUUSD on the H1 timeframe, but the indicator can be tested and adjusted for other symbols
FREE
This indicator is a **Pivot-Confluence Zone Identifier** that focuses exclusively on identifying key support and resistance levels where price clusters align with classic pivot points. Here's what it does: ## Core Functionality **Pivot Confluence Detection**:  - Only displays price zones that align with classic pivot point levels (R1, R2, R3, S1, S2, S3) - **Excludes the main pivot point** - focuses only on support and resistance levels - Uses a configurable pip range to detect confluence nea
FREE
Dynamic Pivot Zones
Vincent Jose Proenca
Dynamic Pivot Zones – Your Level Assistant on the Chart This indicator is a bit like a GPS for your trading . It shows you where the price likes to hang out, where it gets nervous, and where it flies through. No more calculating pivots by hand or guessing support and resistance levels. What it does: Automatically plots H1, H4, and D1 pivots . Shows support and resistance zones : R1, R2, S1, S2. Lines are colored and easy to read , so you can instantly see what’s hot or cold. Why you’ll love it:
FREE
ZigZag WaveSize MT4'ün önceki sürümünün geliştirilmesi  ZigZag WaveSize MT4 ZigZag WaveSize -  noktalar cinsinden dalga uzunluğu bilgisi, seviyeler ve farklı uyarı mantığı eklenmiş değiştirilmiş standart ZigZag göstergesi Genel İyileştirmeler: MetaTrader 5 için kod uyarlaması Grafik nesneleriyle çalışmanın optimize edilmesi Yeni Özellikler: Ekstremumlarda yatay seviyeler Seviye tipi seçimi: yatay/ışınlar/bölümler Likid seviyeler filtresi (fiyat tarafından test edilmemiş) Kırılma için tampon: y
FREE
DailySessions
Davide Zunino
4.67 (6)
The indicator represents the session boxes for the Asian, European and American sessions. It is possible to change the time of each session, such as color. It is also possible to disable the display of each session. You will find in input parameters variables to modify in format hh:mm. In Colors tab you can change the color of boxes of each sessions. If you need some implementations please contact me.
FREE
Pivot Points Buy Zones
Nils R M Peleman
4.86 (7)
Detailed Description: The   Pivot Points Indicator   is designed for traders who rely on pivot points, midpoints and support/resistance levels for their trading strategies. By automatically calculating and plotting these levels (based on   the   previous period's high, low, and close prices) , the indicator provides a clear, visual representation of critical price areas where the market may reverse or break out.The tool is particularly useful for day traders and swing traders looking to base th
FREE
This indicator is stand alone version from  MP Pivot Levels  (All in one) containing Woodie Pivots. Woodie’s pivot points are made up of multiple key levels, calculated from past price points, in order to frame trades in a simplistic manner. The key levels include the ‘pivot’ itself, and multiple support and resistance levels (usually up to three each). Traders use these levels as a guide for future price movements when setting up trades. The pivot : (Previous high + previous low + 2 x previous
FREE
Round numbers (or key levels) is an amazing strategy. These numbers are strong support and resistance levels. So what this indicator does is draw horizontal lines on the chart to help you find these levels. Configurations: Key levels in pips - distance between the lines. Color -   lines color. Style -   lines style. Width -  lines width. Display at background -  draw lines in front or back of candles. Selectable -  turn on or off the option to select the lines. Lines identification -  identifica
FREE
Amiguinhos Bar Counter
Eduardo Correia Da Silva
3.67 (3)
Amiguinho's Bar Counter is a price action indicator to display the bar count (candles) with some interesting options. About the "Period of analysis" parameter: if the current timeframe is in minutes, then the analysis period will be considered in days; if the current timeframe is in days, then the analysis period will be considered in months; or  if the period of analysis will be considered in years.
FREE
AliPivot Points is a Meta Trader 5 Indicator that draws you the latest pivot points. You can choose from timeframes ranging from 1 Minute to 1 Month. Calculation methods for pivot points includes: Classic Pivot Points Camarilla Pivot Points Fibonacci Pivot Points Woodie Pivot Points You can personalize the line colors, style, and width to suit your preference. The indicator displays values on the right side of the chart. AliPivot Points values can also be utilized by developers for creating Expe
FREE
Free automatic Fibonacci is an indicator that automatically plots a Fibonacci retracement based on the number of bars you select on the BarsToScan setting in the indicator. The Fibonacci is automatically updated in real time as new highest and lowest values appears amongst the selected bars. You can select which level values to be displayed in the indicator settings. You can also select the color of the levels thus enabling the trader to be able to attach the indicator several times with differe
FREE
SnR Engine
Muhammad Tamimul Huda
SnR Engine Basically, this is a Support and Resistance indicator like most others that use fractals to determine support and resistance levels. The difference is that this indicator determines whether a support or resistance level has been broken based on ATR. Levels that have been broken will become “dead levels” and will be shown with dashed lines. Levels that have many rejections and fail to be broken will have increasingly thicker lines. For effective use, you need to understand the charac
FREE
Detailed Description: The   Pivot Point Classic Indicator   is designed for traders who rely on classic pivot points and midpoints levels for their trading strategies. By automatically calculating and plotting these levels, the indicator provides a clear, visual representation of critical price areas where the market may reverse or break out. Key Features: Automatic Pivot Point Calculations : Automatically calculates pivot points, three support (S1, S2, S3) and resistance (R1, R2, R3) levels bas
FREE
The CPR (Central Pivot Range) Indicator is a powerful technical analysis tool designed to identify key support and resistance levels on your MetaTrader 5 charts. It calculates the Central Pivot (CP) as the average of the previous day's high, low, and close prices, providing a central reference point. Calculates and plots 11 pivot levels (CP, BC, TC, S1-S4, R1-R4) Adjustable lookback period (default: 5 days) Option to show or hide price labels with customizable size and offset Fully customizable
FREE
Forex17 Bollinger Channel
Robinson Alves Lemos
5 (1)
Bu gösterge, Bollinger tarzı bir volatilite kanalının yalnızca üst ve alt bantlarını gösterir; orta hareketli ortalama çizilmez. Temel amacı, kullanıcının fiyatın kanal sınırlarıyla etkileşimine odaklanmasını sağlarken grafik düzeni ve görselliği üzerinde tam kontrol sunan temiz ve esnek bir volatilite zarfı sağlamaktır. Geleneksel Bollinger Bantlarında orta hareketli ortalama her zaman gösterilirken, bu göstergede yalnızca hesaplama amacıyla kullanılır. Orta çizgi, görsel karmaşayı azaltmak ve
FREE
Camarilla Swing Trade Indicator is an Indicator. Support and resistance points are calculated from the High Low Close of the previous TF Week's price. What are Camarilla Pivot Points? 1.Camarilla Pivot Points is a modified version of the classic Pivot Point. 2.Camarilla Pivot Points was launched in 1989 by Nick Scott, a successful bond trader. 3.The basic idea behind Camarilla Pivot Points is that price tends to revert to its mean until it doesn't. 4.Camarilla Pivot Points is a mathematical pr
FREE
Pivots Lines
Abakou Nazaire Ayelenou
5 (1)
Herhangi bir zaman dilimi için Traditionnal, Fibonacci, Woodie, Classic, Demark, Camarilla pivot noktaları çizin Her tür pivot Traditionnal, Fibonacci, Woodie, Classic, Demark, Camarilla desteği Herhangi bir zaman aralığını destekleyin (M1...H1...D1...MN1...Yıllık) Destek sunucusu Yaz Saati Uygulaması Sidney'den ABD'ye açık forex günlük bölümünü destekleyin Kapat Kripto ticaretini destekleyin Pivot ve trend arasındaki boşluğu doldurun, çok faydalı Pivot noktaları, trendin yönünü gösterir ve tale
FREE
Ratio
Radim Kucera
3.67 (3)
This indicator shows ratios between extremes on the chart. You can specify your own ratios (e.g. Fibonacci). Parameters Most important Density - how much in details to search ratios in extremes. Bigger number means less details, smaller number means more details. Base unit is 1 bar on the chart. History - how far to go in history while searching. When you set -1, the indicator processes all bars from history. Base unit is 1 bar on the chart. Range - how far search ratios from given extreme. Bas
FREE
How the day starts
Sergio Antoni Escudero Tirado
This indicator draws the high intraday price and the low intraday price of the first n minutes of the day. The chart shows the days with vertical lines and two horizontal lines to indicate the max and the min close price of the n first minutes of the day. The max/min lines start and end with the day calculated. With this indicator you can see how starts the day compared with the previous days. It is valid for any market inasmuch as the start time is calculated with the data received. Parameter
FREE
Pivot Point Multi-Method with Dashboard This indicator is a technical analysis tool designed to calculate and display horizontal support and resistance levels based on various Pivot Point methodologies. It is built using the MQL5 Canvas library, ensuring efficient performance and a clean visual presentation on the chart. The tool calculates levels using the data from the previous completed candle of a user-defined reference timeframe. This ensures that the levels remain fixed for the duration of
FREE
Auto Fibonacci Retracement Indicator — Flexible and Reliable This isn’t just another Auto Fibonacci Retracement indicator. It’s one of the most flexible and dependable tools available . If you find it useful, please consider leaving a review or comment — your feedback means a lot! Check out my other helpful tools below: Smart Alert Manager   - Set up advanced alerts and send them to Mobile, Telegram, Discord, Webhook... Timeframes Trend Scanner    - Scan the trend of assets in difference timefr
FREE
Pivot Points Apex
Alexandre Silva Diniz
Pivot Points Indicator that calculates essential support and resistance levels for day traders and swing traders. Ideal for identifying reversal points, setting targets, and managing risk on any timeframe. For Day Traders Identifies key levels for entries and exits Defines stop-loss and target levels Recognizes potential intraday reversals For Swing Traders Identifies weekly/monthly support and resistance zones Plans medium-term positions Complements trend analysis For Scalpers Fast reference
FREE
Hunter’s Scope: Volatilite ve Trend Gücü Göstergesi (MT5) Hunter’s Scope; yönsel güç ve volatiliteyi filtreleyerek fiyat genişlemesini belirleyen, MetaTrader 5 için yüksek momentumlu bir göstergedir. Önemli dürtüsel (impulse) mumları tespit etmek için tasarlanmış olup, momentum tabanlı işlemler için net ve objektif sinyaller sağlar. Temel Mantık: Çift Katmanlı Filtre Gecikmeli kesişimler yerine Hunter’s Scope, iki yönlü bir doğrulama modeli kullanır: Trend Gücü (ADX): Sinyaller yalnızca ADX kull
-- Basit ama etkili. Tersine Dönüş Göstergesi - Nedir? SuperTrend mantığını üstel eğri teknolojisiyle birleştiren, trendi takip eden bir üst katman göstergesidir. Trend yönünü algılar, grafikte dinamik bir kanal çizer ve trend tersine döndüğünde gerçek zamanlı uyarılar gönderir. Nasıl çalışır? Gösterge, ATR ve SuperTrend faktörünü kullanarak üstel bir temel çizgi hesaplar. Fiyat bu temel çizginin üzerinde veya altında kapandığında, trendin tersine döndüğü teyit edilir. Yeşil ok, AL trendinin
FREE
The utility draws pivot levels for the selected timefram in classic method. Pivot = (high + close + low) / 3 R1 = ( 2 * Pivot) - low S1 = ( 2 * Pivot) - high R2 = Pivot + ( high - low ) R3 = high + ( 2 * (Pivot - low)) S2 = Pivot - (high - low) S3 = low - ( 2 * (high - Pivot)) you can change the timeframe, colors and fontsize. also you can change the text for the levels. Have fun and give feedback...
FREE
High Low Open Close
Alexandre Borela
4.98 (44)
Bu projeyi seviyorsanız, 5 yıldız incelemesi bırakın. Bu gösterge açık, yüksek, düşük ve belirtilen fiyatlar için çizer Dönem ve belirli bir zaman bölgesi için ayarlanabilir. Bunlar birçok kurumsal ve profesyonel tarafından görünen önemli seviyelerdir. tüccarlar ve daha fazla olabileceği yerleri bilmeniz için yararlı olabilir Aktif. Mevcut dönemler şunlardır: Önceki gün. Önceki Hafta. Önceki Ay. Previous Quarter. Önceki yıl. Veya: Mevcut gün. Hafta. Şimdi Ay. Şimdiki Mahallesi. Bugün yıl.
FREE
Bu ürünün alıcıları ayrıca şunları da satın alıyor
ARIPoint
Temirlan Kdyrkhan
ARIPoint is a powerful trading companion designed to generate high-probability entry signals with dynamic TP/SL/DP levels based on volatility. Built-in performance tracking shows win/loss stats, PP1/PP2 hits, and success rates all updated live. Key Features: Buy/Sell signals with adaptive volatility bands Real-time TP/SL/DP levels based on ATR Built-in MA Filter with optional ATR/StdDev volatility Performance stats panel (Success, Profit/Loss, PP1/PP2) Alerts via popup, sound, push, or email Cu
SuperScalp Pro
Van Minh Nguyen
4.59 (22)
SuperScalp Pro – Gelişmiş Çoklu Filtre Scalping Gösterge Sistemi SuperScalp Pro, işlem fırsatlarını belirlemeye yardımcı olmak için klasik Supertrend ile birden fazla akıllı onay filtresini birleştiren gelişmiş bir scalping göstergesidir. M1’den H4’e kadar farklı zaman dilimlerinde verimli şekilde çalışır ve XAUUSD, BTCUSD ile majör Forex pariteleri için optimize edilmiştir. Gösterge, net Al ve Sat sinyalleri sunar ve ATR tabanlı otomatik giriş fiyatı, stop loss ve take profit seviyeleri hesapla
Entry In The Zone and SMC Multi Timeframe is a real-time 2-in-1 market analysis tool that combines market structure analysis and a No Repaint BUY / SELL signal system into a single indicator, built on Smart Money Concepts (SMC) — a widely adopted framework used by professional traders to understand market structure. This indicator helps you see the market more clearly, make decisions based on structure rather than guesswork, and focus on high-probability zones where price is more likely to react
Divergence Bomber
Ihor Otkydach
4.9 (87)
Bu göstergeyi satın alan herkese aşağıdaki ekstra içerikler ücretsiz olarak sunulmaktadır: Her işlemi otomatik olarak yöneten, Stop Loss ve Take Profit seviyelerini ayarlayan ve işlemleri strateji kurallarına göre kapatan özel yardımcı araç: "Bomber Utility" Göstergenin farklı varlıklar üzerinde kullanılmasına yönelik ayar dosyaları (set dosyaları) Bomber Utility için 3 farklı modda kullanım sunan ayar dosyaları: "Minimum Risk", "Dengeli Risk" ve "Bekle-Gör Stratejisi" Bu ticaret stratejisini hı
Power Candles V3 - Kendi Kendini Optimize Eden Güç Göstergesi Power Candles V3, döviz ve enstrüman gücünü, eklendiği her grafikte eyleme geçirilebilir bir ticaret planına dönüştürür. Sadece mumları renklendirmek yerine, arka planda canlı bir otomatik optimizasyon çalıştırır ve önünüzdeki sembol için en iyi Stop Loss, Take Profit ve sinyal eşiğini size sunar. Tek bir tıklama ile canlı ticarete uyarlanır - giriş, Stop Loss ve Take Profit ışınları grafikte tam fiyatlarla görünür ve uyarılar yön bil
Gold Entry Sniper
Tahir Mehmood
5 (8)
Gold Entry Sniper – Altın Scalping & Swing Trading için Profesyonel Çoklu Zaman Çerçeveli ATR Paneli Gold Entry Sniper , XAUUSD ve diğer enstrümanlar için doğru al/sat sinyalleri veren, ATR Trailing Stop mantığı ve çoklu zaman çerçevesi analizi ile geliştirilmiş gelişmiş bir MetaTrader 5 göstergesidir. Temel Özellikler ve Avantajlar Çoklu Zaman Çerçevesi Analizi – M1, M5, M15 trendlerini tek panelde gösterir. ATR Tabanlı Trailing Stop – Volatiliteye göre dinamik olarak ayarlanır. Profesyonel Gra
Grabber System MT5
Ihor Otkydach
4.83 (23)
Size mükemmel bir teknik gösterge olan Grabber’ı tanıtıyorum. Bu araç, kullanıma hazır bir “her şey dahil” işlem stratejisi olarak çalışır. Tek bir yazılım kodu içinde güçlü piyasa teknik analiz araçları, işlem sinyalleri (oklar), uyarı işlevleri ve push bildirimleri entegre edilmiştir. Bu göstergeyi satın alan herkes aşağıdaki hediyeleri ücretsiz olarak alır: Açık emirleri otomatik yönetmek için Grabber Yardımcı Aracı Kurulum, yapılandırma ve nasıl işlem yapılacağını adım adım anlatan video kıl
SignalTech MT5 is a trading system for EURUSD, USDCHF, USDJPY, AUDUSD, NZDUSD, EURJPY, AUDJPY, NZDJPY, CADJPY H2 and H3 Timeframe.  It can generate signals with Buy/Sell Arrows and Pop-Up/Sound Alerts. Each signal has clear Entry and Stop Loss levels, which should be automatically flagged on the chart, as well as potential Targets 1, 2, and 3. The Entry and TP levels are fixed after the trade is taken. The exit level is dynamic. If there are signs of a potential short-term trend reversal, the
Bu indikatörü satın alırsanız, Profesyonel Trade Manager’ımı  + EA ÜCRETSİZ olarak alacaksınız. Öncelikle, bu Ticaret Sistemi'nin Non-Repainting, Non-Redrawing ve Non-Lagging Göstergesi olduğunu vurgulamak önemlidir, bu da hem manuel hem de robot ticareti için ideal hale getirir. Online kurs, kılavuz ve ön ayarları indir. "Smart Trend Trading System MT5", yeni ve deneyimli tüccarlar için özelleştirilmiş kapsamlı bir ticaret çözümüdür. 10'dan fazla premium göstergeyi birleştiriyor ve 7'den fazla
Gann Made Easy , bay teorisini kullanarak ticaretin en iyi ilkelerine dayanan, profesyonel ve kullanımı kolay bir Forex ticaret sistemidir. WD Gann. Gösterge, Zararı Durdur ve Kâr Al Seviyeleri dahil olmak üzere doğru SATIN AL ve SAT sinyalleri sağlar. PUSH bildirimlerini kullanarak hareket halindeyken bile işlem yapabilirsiniz. Satın alma işleminden sonra, alım satım talimatlarını ve harika ek göstergeleri ücretsiz olarak almak için lütfen benimle iletişime geçin! Muhtemelen Gann ticaret yöntem
Btmm state engine pro
Garry James Goodchild
5 (4)
BTMM State Engine Pro is a MetaTrader 5 indicator for traders who use the Beat The Market Maker approach: Asian session context, kill zone timing, level progression, peak formation detection, and a multi-pair scanner from a single chart. It combines cycle state logic with a built-in scanner dashboard so you do not need the same tool on many charts at once. What it does Draws the Asian session range; session times can follow broker server offset or be set in inputs. Tracks level progression (L
FX Trend MT5 NG
Daniel Stein
5 (4)
FX Trend NG: Yeni Nesil Çoklu Piyasa Trend Zekâsı Genel Bakış FX Trend NG , çoklu zaman dilimlerinde çalışan profesyonel bir trend analiz ve piyasa izleme aracıdır. Piyasanın yapısını saniyeler içinde anlamanızı sağlar. Birden fazla grafik arasında geçiş yapmak yerine, hangi enstrümanların trendde olduğunu, momentumun nerede zayıfladığını ve hangi zaman dilimlerinin uyumlu olduğunu anında görebilirsiniz. Lansman Teklifi – FX Trend NG sadece $30 (6 Ay) veya $80 Ömür Boyu Lisans ile edinin. Zate
Tanıtım       Quantum Breakout PRO   , Breakout Bölgeleri ile ticaret yapma şeklinizi değiştiren çığır açan MQL5 Göstergesi! 13 yılı aşkın ticaret tecrübesine sahip deneyimli tüccarlardan oluşan bir ekip tarafından geliştirilmiştir.       Kuantum Breakout PRO       yenilikçi ve dinamik koparma bölgesi stratejisiyle ticaret yolculuğunuzu yeni zirvelere taşımak için tasarlanmıştır. Kuantum Breakout Göstergesi, size 5 kar hedefi bölgesi ile kırılma bölgelerinde sinyal okları ve kırılma kutusuna da
Quantum TrendPulse
Bogdan Ion Puscasu
5 (23)
SuperTrend   ,   RSI   ve   Stochastic'in   gücünü tek bir kapsamlı göstergede birleştirerek işlem potansiyelinizi en üst düzeye çıkaran nihai işlem aracı olan   Quantum TrendPulse'u   tanıtıyoruz. Hassasiyet ve verimlilik arayan yatırımcılar için tasarlanan bu gösterge, piyasa trendlerini, momentum değişimlerini ve en uygun giriş ve çıkış noktalarını güvenle belirlemenize yardımcı olur. Temel Özellikler: SuperTrend Entegrasyonu:   Güncel piyasa trendlerini kolayca takip edin ve karlılık dalgası
Top indicator for MT5   providing accurate signals to enter a trade without repainting! It can be applied to any financial assets:   forex, cryptocurrencies, metals, stocks, indices .  Watch  the video  (6:22) with an example of processing only one signal that paid off the indicator! MT4 version is here It will provide pretty accurate trading signals and tell you when it's best to open a trade and close it. Most traders improve their trading results during the first trading week with the help of
Atomic Analyst MT5
Issam Kassas
3.94 (31)
Öncelikle belirtmek gerekir ki bu Ticaret Göstergesi Yeniden Çizim Yapmaz, Gecikmez ve Gecikme Göstermez, bu da hem manuel hem de robot ticareti için ideal hale getirir. Kullanıcı kılavuzu: ayarlar, girişler ve strateji. Atom Analisti, Piyasada Daha İyi Bir Avantaj Bulmak İçin Fiyatın Gücünü ve Momentumunu Kullanan PA Fiyat Hareketi Göstergesidir. Gürültüleri ve Yanlış Sinyalleri Kaldırmaya ve Ticaret Potansiyelini Artırmaya Yardımcı Olan Gelişmiş Filtrelerle Donatılmıştır. Birden fazla katmanl
Trend Screener Pro MT5
STE S.S.COMPANY
4.85 (104)
Trend Göstergesi, Trend Alım Satım ve Filtreleme için Çığır Açan Benzersiz Çözüm, Tüm Önemli Trend Özellikleriyle Tek Bir Araç İçinde Yerleştirildi! Forex, emtialar, kripto para birimleri, endeksler ve hisse senetleri gibi tüm sembollerde/araçlarda kullanılabilen %100 yeniden boyamayan çoklu zaman çerçevesi ve Çoklu para birimi göstergesidir. Trend Screener, grafikte noktalarla ok trend sinyalleri sağlayan etkili bir trend trend göstergesidir. Trend analizörü göstergesinde bulunan özellikler: 1.
OmniSync Projection
Antonio-alin Teculescu
5 (1)
Chronos Fractal Engine is an innovative price projection indicator for MetaTrader 5, designed to transform your technical analysis by intelligently identifying and projecting historical price patterns. Built upon an advanced correlation algorithm and the fractal principles of the market, this powerful tool visualizes potential future price movements, giving you a unique edge in your trading decisions. What is Chronos Fractal Engine? At its core, the Chronos Fractal Engine employs a sophisticat
Bu gösterge paneli, seçilen semboller için mevcut en son   harmonik kalıpları   gösterir, böylece zamandan tasarruf edersiniz ve daha verimli olursunuz /   MT4 sürümü . Ücretsiz Gösterge:   Basic Harmonic Pattern Gösterge sütunları Symbol :   seçilen semboller görünecektir Trend:   yükseliş veya düşüş Pattern :   desen türü (gartley, kelebek, yarasa, yengeç, köpekbalığı, cypher veya ABCD) Entry :   giriş fiyatı SL:   zararı durdur fiyatı TP1:   1. kar alma fiyatı TP2:   2. kar alma fiyatı TP
Azimuth Pro
Ottaviano De Cicco
5 (7)
Azimuth Pro V2: Synthetic Fractal Structure and Confirmed Entries for MT5 Overview Azimuth Pro is a multi-level swing structure indicator by Merkava Labs . Four nested swing layers, swing-anchored VWAP, ABC pattern detection, three-timeframe structural filtering, and closed-bar confirmed entries — one chart, one workflow from micro-swings to macro-cycles. This is not a blind signal product. It is a structure-first workflow for traders who care about location, context, and timing. V2 Launch Offe
FX Levels MT5
Daniel Stein
5 (13)
FX Levels: Tüm Piyasalar İçin Son Derece Hassas Destek ve Direnç Hızlı Bakış Döviz kurları, endeksler, hisseler veya emtialar gibi herhangi bir piyasada güvenilir destek ve direnç seviyeleri belirlemek mi istiyorsunuz? FX Levels geleneksel “Lighthouse” yöntemini ileri düzey bir dinamik yaklaşımla birleştirerek neredeyse evrensel bir doğruluk sağlar. Gerçek broker deneyimimize ve otomatik günlük güncellemeler ile gerçek zamanlı güncellemelerin birleşimine dayalı olarak, FX Levels size dönüş nok
Öncelikle, bu Ticaret Aracının Non-Repainting, Non-Redrawing ve Non-Lagging Gösterge olduğunu vurgulamakta fayda var, bu da onu profesyonel ticaret için ideal hale getiriyor. Çevrimiçi kurs, kullanıcı kılavuzu ve demo. Akıllı Fiyat Hareketi Kavramları Göstergesi, hem yeni hem de deneyimli tüccarlar için çok güçlü bir araçtır. İleri ticaret fikirlerini, Inner Circle Trader Analizi ve Smart Money Concepts Ticaret Stratejileri gibi 20'den fazla kullanışlı göstergeyi bir araya getirerek bir araya
RelicusRoad Pro: Kantitatif Piyasa İşletim Sistemi ÖMÜR BOYU ERİŞİMDE %70 İNDİRİM (SINIRLI SÜRE) - 2.000+ TRADER'A KATILIN Neden çoğu trader "mükemmel" indikatörlere rağmen başarısız olur? Çünkü tekil kavramları boşlukta trade ederler. Bağlamı olmayan bir sinyal kumardır. Sürekli kazanmak için KONFLÜANS (UYUM) gerekir. RelicusRoad Pro basit bir ok indikatörü değildir. Tam bir Kantitatif Piyasa Ekosistemi dir. Tescilli volatilite modellemesini kullanarak fiyatın ilerlediği "Adil Değer Yolu"nu har
Trend indicator AI mt5
Ramil Minniakhmetov
5 (17)
Trend Ai göstergesi, trend tanımlamasını işlem yapılabilir giriş noktaları ve geri dönüş uyarılarıyla birleştirerek bir yatırımcının piyasa analizini geliştirecek harika bir araçtır. Bu gösterge, kullanıcıların forex piyasasının karmaşıklıklarında güvenle ve hassasiyetle yol almalarını sağlar. Birincil sinyallerin ötesinde, Trend Ai göstergesi geri çekilmeler veya düzeltmeler sırasında ortaya çıkan ikincil giriş noktalarını belirleyerek, yatırımcıların belirlenen trend içindeki fiyat düzeltmele
Önce dürüst olalım. Hiçbir gösterge tek başına sizi kârlı yapmaz. Eğer biri size aksini söylüyorsa, size bir hayal satıyordur. Mükemmel al/sat okları gösteren her gösterge, kusursuzmuş gibi görünecek şekilde yapılabilir — sadece geçmişin doğru bir bölümünü yakınlaştırıp kazanan işlemleri ekran görüntüsü almanız yeterlidir. Biz bunu yapmıyoruz.  SMC Intraday Formula bir araçtır. Piyasa yapısını sizin için okur, en yüksek olasılıklı fiyat bölgelerini belirler ve şu anda akıllı paranın izinin nası
Crystal Heikin Ashi Signals
Muhammad Jawad Shabir
5 (2)
Crystal Heikin Ashi Signals - Professional Trend & Signal Detection Indicator Advanced Heikin Ashi Visualization with Intelligent Signal System for Manual & Automated Trading Final Price: $149 ---------> Price goes up $10 after every 10 sales . Limited slots available — act fast . Overview Crystal Heikin Ashi Signals is a professional-grade MetaTrader 5 indicator that combines pure Heikin Ashi candle visualization with an advanced momentum-shift detection system. Designed for both manual traders
ARICoins
Temirlan Kdyrkhan
ARICoin is a powerful trading companion designed to generate high-probability entry signals with dynamic TP/SL/DP levels based on volatility. Built-in performance tracking shows win/loss stats, PP1/PP2 hits, and success rates all updated live. Key Features: Buy/Sell signals with adaptive volatility bands Real-time TP/SL/DP levels based on ATR Built-in MA Filter with optional ATR/StdDev volatility Performance stats panel (Success, Profit/Loss, PP1/PP2) Alerts via popup, sound, push, or email Cust
Market Structure Order Block Dashboard MT5, piyasa yapısını ve ana fiyat reaksiyon bölgelerini doğrudan grafikte okumak isteyen traderlar için tasarlanmış bir MT5 göstergesidir. BOS, ChoCH, Order Blocks, Fair Value Gaps (FVG), Likidite, Kill Zones, Volume Profile ve hızlı analiz için kompakt bir paneli bir araya getirir. Bu gösterge, piyasa yapısını, ICT ve Smart Money kavramlarını karar çerçevesi olarak kullanan traderlara yöneliktir. Trend devamlarını, olası tersine dönüşleri, fiyat dengesizli
Smart Stop Indicator – Stop-loss düzeylerini doğrudan grafikte akıllı ve hassas şekilde belirleyin Genel Bakış Smart Stop Indicator, stop-loss seviyesini tahmin ederek veya sezgilere güvenerek değil, net ve sistematik bir şekilde belirlemek isteyen traderlar için özel olarak geliştirilmiştir. Bu araç, klasik price-action mantığını (yükselen tepeler, düşen dipler) modern breakout algılama ile birleştirerek bir sonraki mantıklı stop seviyesini belirler. Trendlerde, yatay piyasalarda veya hızlı k
Meridian Pro
Ottaviano De Cicco
5 (1)
Meridian Pro: Professional Multi-Timeframe Trend Matrix for MT5 Overview Meridian Pro is a multi-timeframe trend matrix by Merkava Labs that compresses directional state, strength, momentum condition and matrix agreement into one compact panel. One adaptive engine, applied consistently from M1 to W1. No per-symbol tuning. No indicator stacking. One structured readout across every asset and every timeframe. Launch Offer — Get Meridian Pro for USD 99 (introductory). Regular price: USD 149. 1. Why
Yazarın diğer ürünleri
Smart OrderBlocks Indicator for MetaTrader 5 A Differentiated Vision and a Bit of Price Action! Smart OrderBlocks is an advanced indicator that reveals market structure from a unique perspective through intelligent supply and demand zone detection. Key Features OrderBlocks Detection Internal OrderBlocks : Capture micro-level market dynamics Swing OrderBlocks : Identify macro market momentum trends Advanced Volatility Intelligence Volatility detection using: Adaptive Average True Range (AT
FREE
SuperTrendAshi
Fillipe Dos Santos
5 (2)
SuperTrendAshi Description SuperTrendAshi is an advanced and optimized version of the SuperTrend indicator that incorporates Heikin Ashi calculation to provide smoother and more reliable signals. This unique combination results in an indicator that reduces false signals and identifies trends with greater precision. Key Features Combines the strength of SuperTrend with Heikin Ashi smoothing More stable signals with less noise Intuitive color system (Aqua for uptrend, Magenta for downtrend) Custo
FREE
An anchored Vwap With Arrows is an indicator that includes a moving average weighted by volume that allows you to plot on a bottom or a top. Usually banks and institutions measure an average price, this average price is a price range where they agree to make a trade. Using the logic of anchored vwap with arrows it is possible to understand that if the price breaks the vwap it means that someone with enough buying and selling power has lost control. You can use vwap anchored with arrows in any ti
MovingRegressionBands - Polynomial Regression Indicator with Adaptive Bands Description MovingRegressionBands is an advanced technical indicator that combines polynomial regression with adaptive bands to identify market trends and reversal points. Using sophisticated mathematical calculations, the indicator provides a more precise view of price movements through a higher-order regression model. Key Features Configurable polynomial regression order for greater accuracy Adaptive bands based on mod
FREE
through this indicator you can make  analysis and also can to distinguish possible weakness or continuous strength  on  price, it is an indicator initially developed by David Weis. This version is for the meta trader 5 platform. The Weis Waves indicator is based on volume and is aligned with the price, being able to find not only possible strenght and weakness, but also possible divergences between price and volume, bringing an interesting analysis between both.
The result as the name explain, displays the result of a swing. Sometimes weis waves show a big effort, but a little result... The weis waves result is a better revelation about the volume, if united with weis waves. it is a volume indicator, but it is different from a conventional volume indicator, this indicator came from the wyckoff method, if you use the result you will have a different view of the market, regardless of which asset is operating.
this indicator is essential when it's necessary to identify  trade locations on  chart. You can initially get an idea of ​​the candlestick's direction with other graphical tools and then identify the best regions with the DMP. The Dash Market Profile is a statistical indicator, that mean it is an indicator that is based on mathematical calculations, identifying the best regions and observing the candles of the best regions to trade. The financial market is not as easy as it seems, it is necessar
CandleVolume
Fillipe Dos Santos
CandleVolume is an indicator that colors bars according to increasing or decreasing volume. You can use it to identify strategic regions of the chart and complete an analysis. White means low volume, yellow means medium volume and red means climax volume. It is a recommended indicator if you like to interpret market contexts and understand how market cycles work.
BetterVolumeTick
Fillipe Dos Santos
BetterVolumeTick it is a volume indicator. It marks the volume regions where there was a great aggression, also shows the volume intensity. Yellow means low volume, normal activity. Orange means activity with a pretty amount of volume. Red means ultra high volume. This indicator combined with the price chart will give you another view of the market context.
Hurst Cycles Diamonds Description This indicator is an alternative version inspired by the pioneering work of David Hickson and the Hurst Cycles Notes indicator developed by Grafton. The main objective is to provide a clear and intuitive view of the Hurst cycles. Credits Original Concept : David Hickson - Hurst Cycles Theory Inspiration : Grafton - Hurst Diamond Notation Pivots Alternative Version : Fillipe dos Santos Main Features Identifies and displays pivots in multiple time cycles Visual t
Moving Regression Bands EA  Description The Moving Regression Bands EA is a robust automated trading system that uses polynomial regression analysis to identify market opportunities. Based on moving regression bands, this EA offers a mathematical and statistical approach to trading. Key Features Advanced Analysis : Uses polynomial regression to calculate trends and volatility bands Operational Flexibility : Normal and Inverse modes for different market strategies Risk Management : Configurable S
SuperTrendAshi EA
Fillipe Dos Santos
SuperTrendAshi EA - Automated Trading System A versatile Expert Advisor based on the SuperTrend indicator adapted for Heikin Ashi candles Key Features: Automated trading system combining SuperTrend precision with Heikin Ashi smoothing Flexible operation with multiple trading modes Advanced risk management with dynamic Trailing Stop Intuitive interface with customizable parameters Detailed Features: Operation Modes Stop Loss and Take Profit Mode: Operates with defined targets Signal-Only Mode: F
Smart Order Blocks EA - Automated Trading with OrderBlocks Description The Smart Order Blocks EA is an advanced Expert Advisor designed to identify, visualize, and automatically trade based on Order Block formations - a powerful concept used by many traders. This tool is quite comprehensive, capable of detecting market opportunities with precision and executing strategies autonomously. What are Order Blocks? Order Blocks are specific areas on the chart that represent zones of support and resista
FootPrintChart
Fillipe Dos Santos
Footprint Chart - Professional Volume Profile Analysis Institutional-grade volume analysis now available on MetaTrader 5! The Footprint Chart is a professional indicator that revolutionizes your market analysis by revealing the true battle between buyers and sellers at each price level. Unlike traditional volume indicators, Footprint shows WHERE volume was traded within each candle, allowing you to identify accumulation zones, distribution patterns, and points of control with surgical precisi
Filtrele:
dizzyhendrix74
14
dizzyhendrix74 2026.02.18 06:25 
 

Not fast enough to load on charts. RAM usage is good, which is what i was looking for, but the slow loading sets it back big time.

jcpnc
24
jcpnc 2025.07.02 07:54 
 

Kullanıcı değerlendirmeye herhangi bir yorum bırakmadı

Fillipe Dos Santos
6017
Geliştiriciden yanıt Fillipe Dos Santos 2025.07.02 13:27
Obrigado pela sua review, espero que este indicador lhe seja muito útil!
Değerlendirmeye yanıt