Volume Zone Analyzer
- Индикаторы
- Версия: 4.10
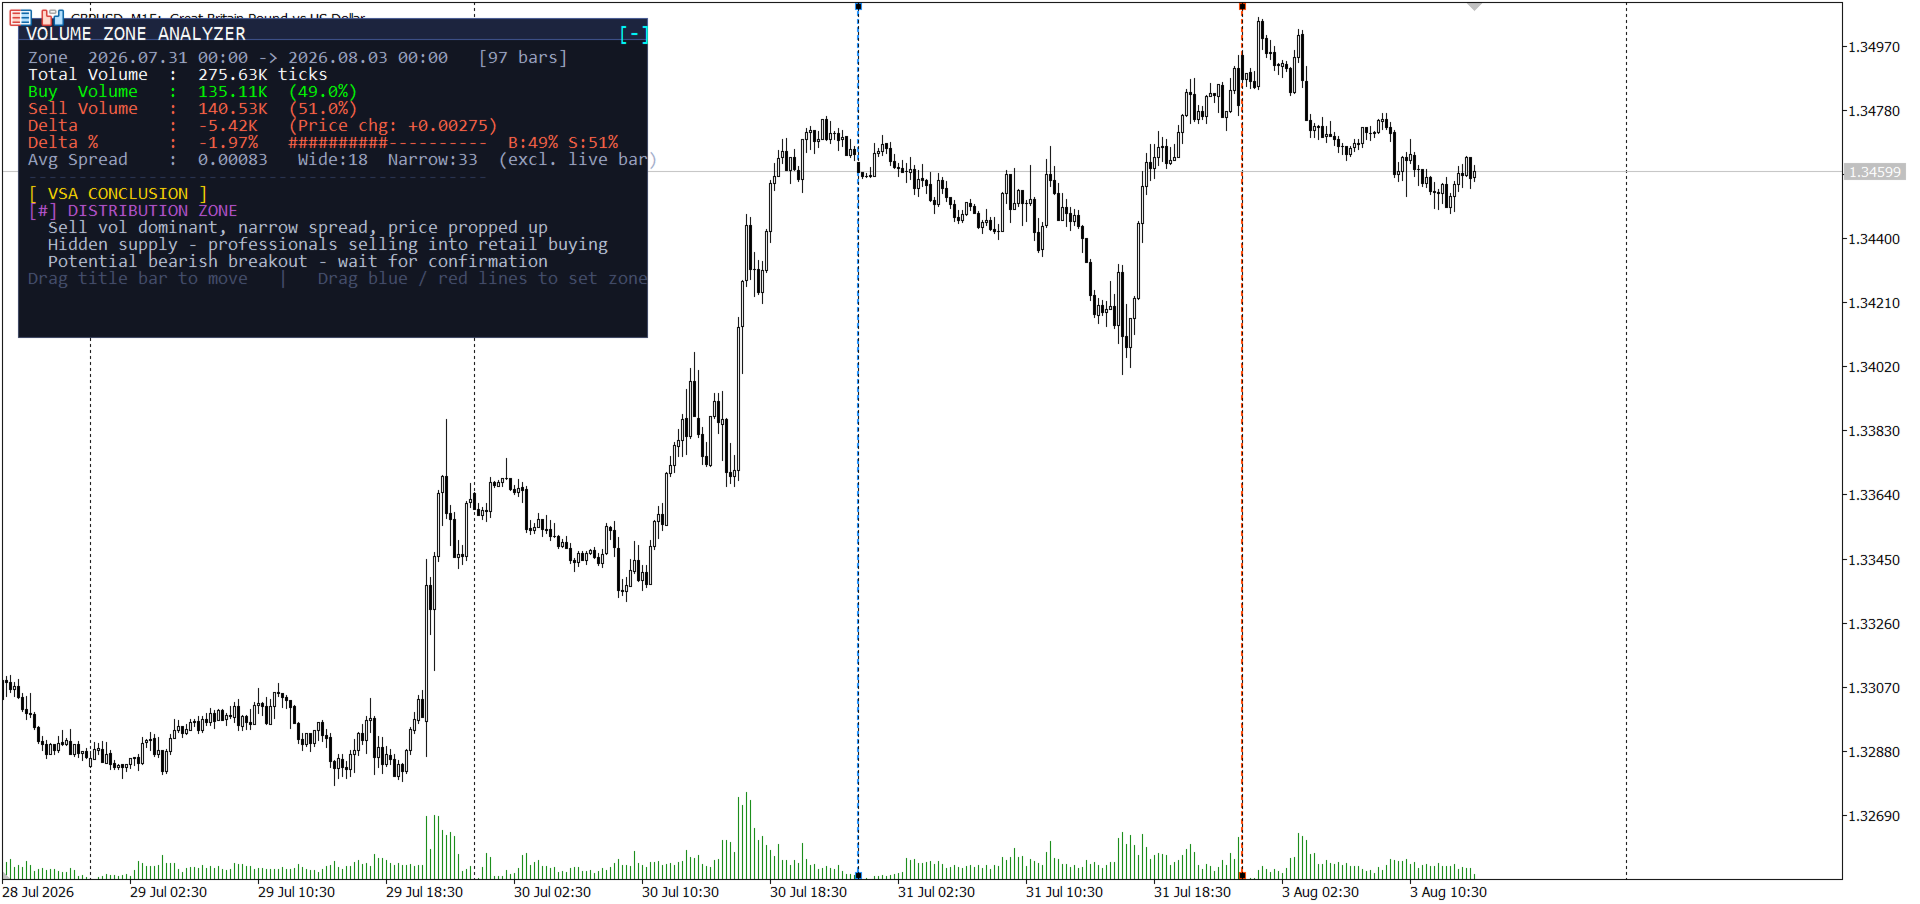
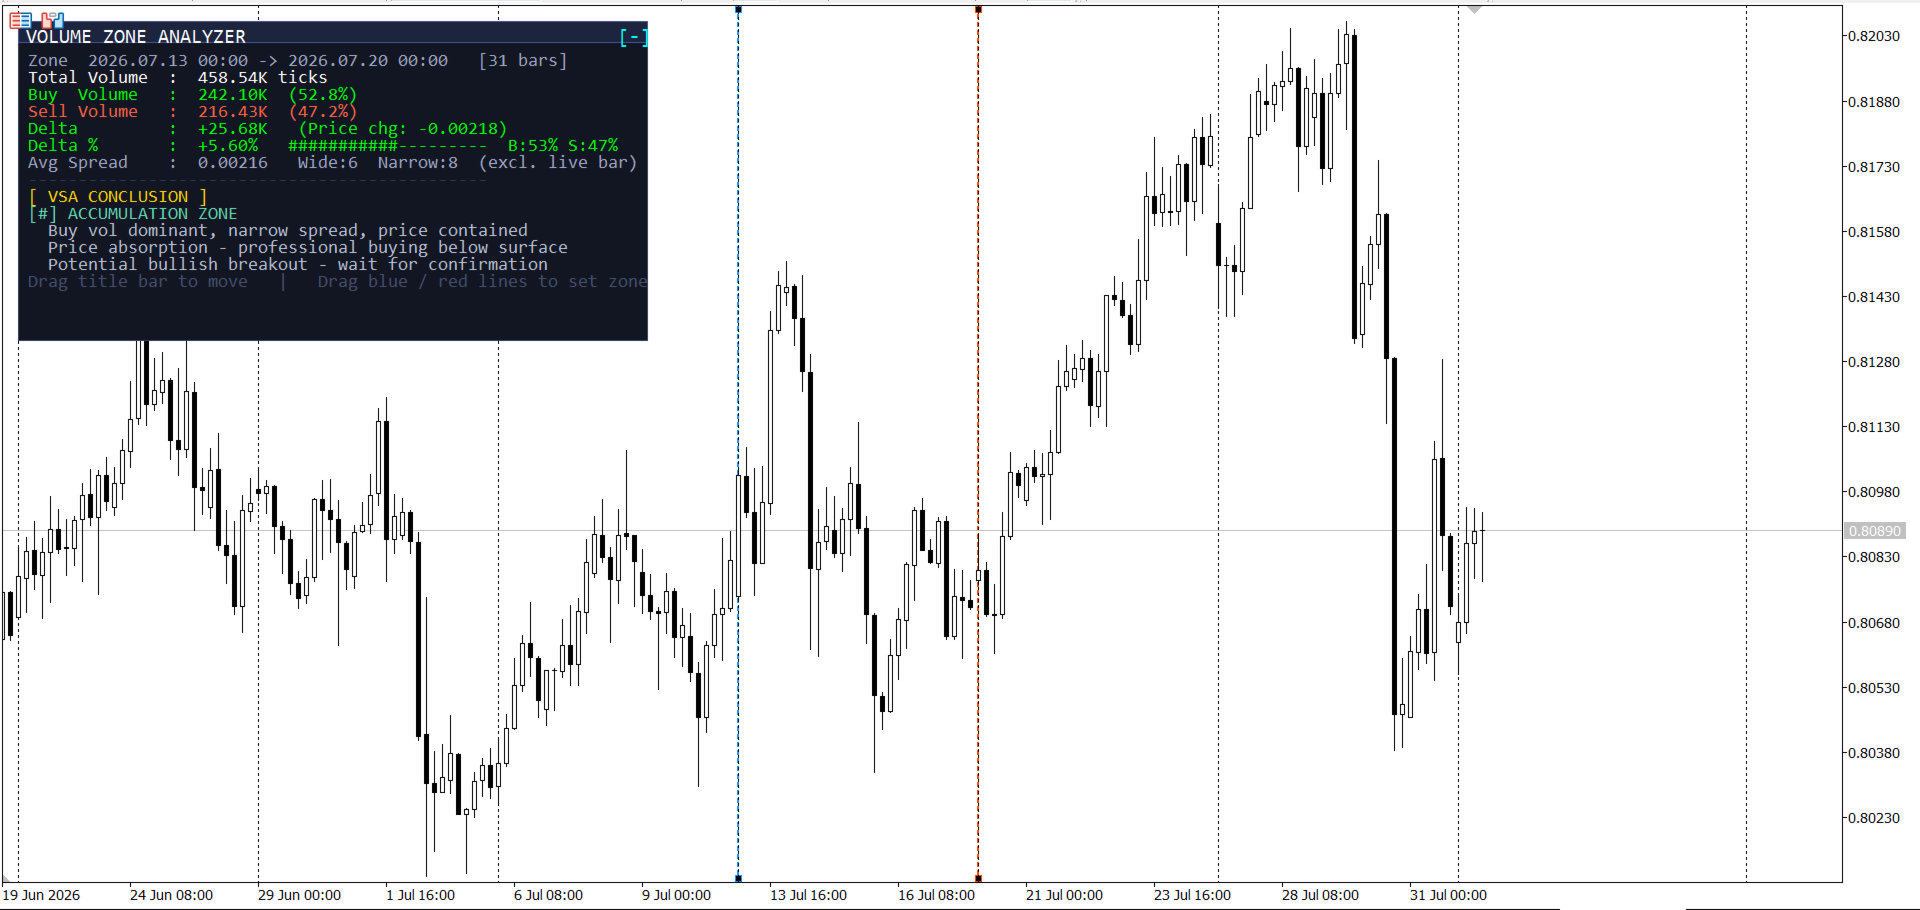
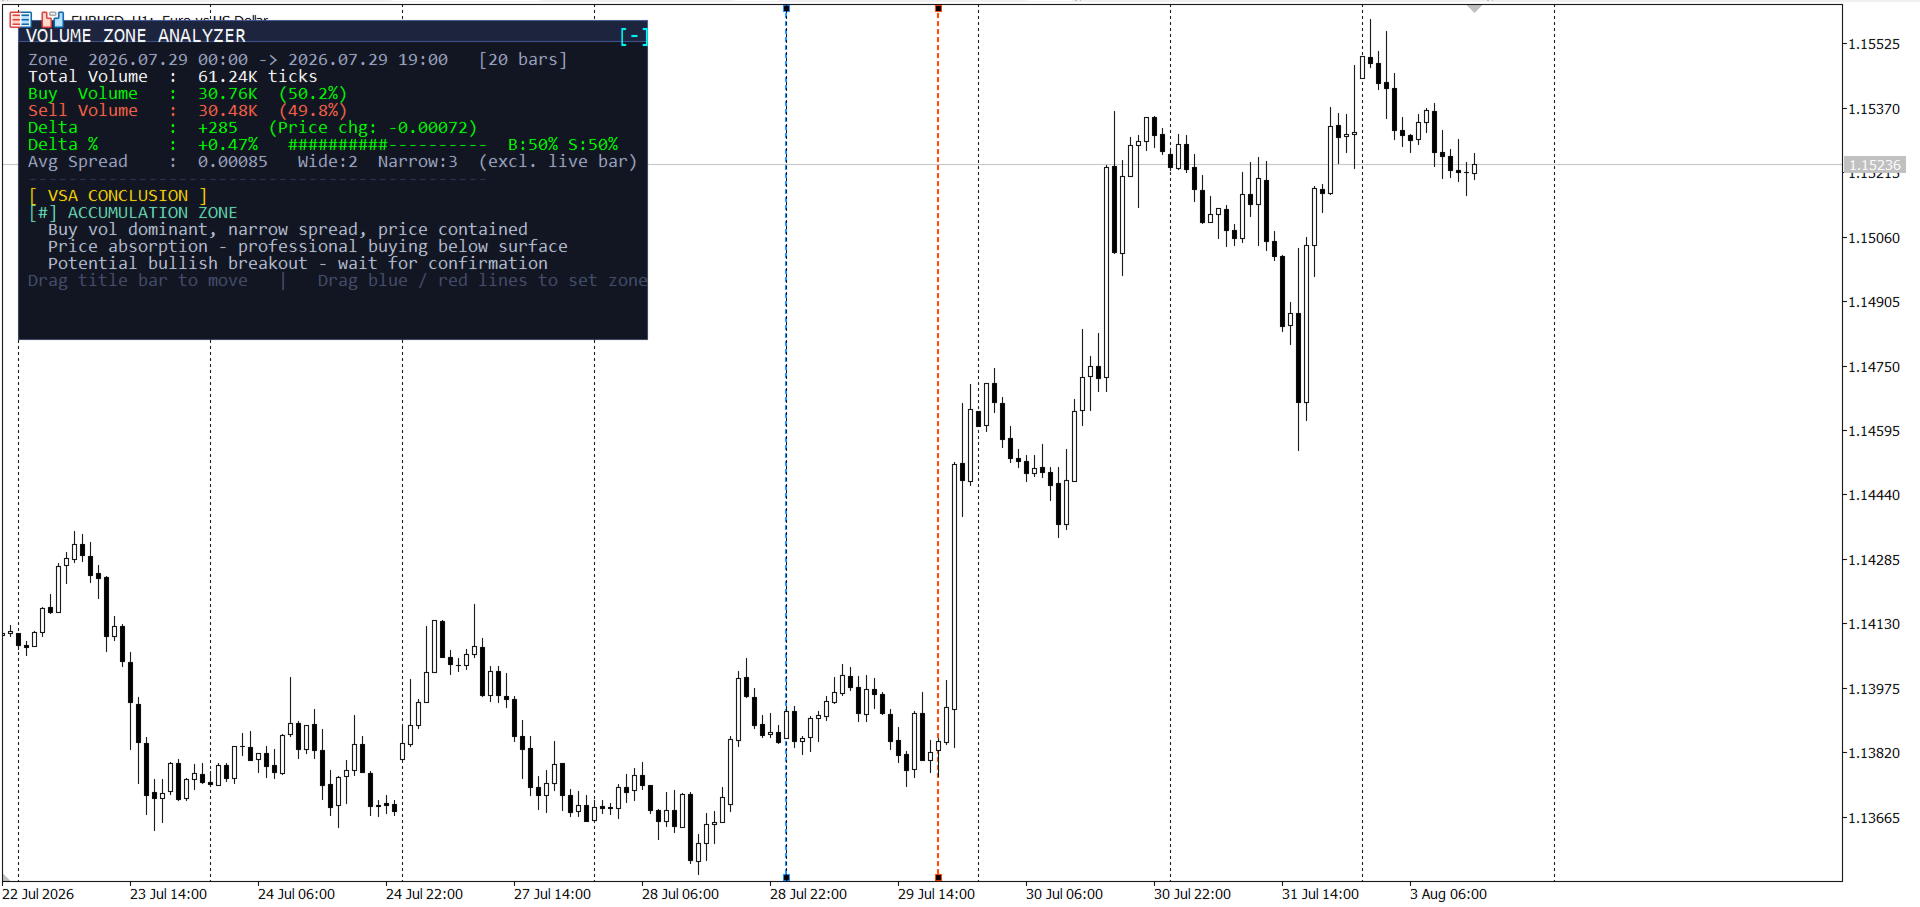
Drop two vertical lines on your chart (Zone Start / Zone End) and drag them anywhere — the panel recalculates live and shows:
- Total volume in the selected zone, plus the buy/sell split (estimated from each candle's close position within its range)
- Delta and Delta % with a simple visual ratio bar
- Average spread with wide/narrow candle counts (excludes the still-forming candle to avoid skewing the average)
- A VSA-style conclusion in plain language — Strong Bullish Demand, Hidden Strength/Absorption, Accumulation/Distribution Zone, Buying/Selling Climax, and more — based on the relationship between volume, price direction, and spread width
The panel is fully draggable (grab the title bar) and collapsible (click the corner button) so it doesn't have to sit in your way while you work.
The drag feature is not working properly, still working on that.
Important note on volume data: Forex tick volume is a synthetic proxy for real trading activity — this is standard for retail OTC forex charts, since true executed-volume data requires a CME futures feed. Buy/sell splits and delta figures here are heuristic estimates derived from candle structure, not a measurement of actual order flow. Use this as a supplementary read on market character, not as a standalone signal.
For informational and educational purposes only — not financial advice.
A reference for turning each VSA conclusion into a concrete next step, using Session Profiles (POC / VAH / VAL) as the confirmation layer. The idea: VZA tells you what the volume/delta/spread character of a zone suggests; Session Profiles tells you where price is likely to react within the current session. Trade the overlap, not either signal alone.
Reversal-risk signals
[!] BUYING CLIMAX — Reversal Risk
What it means: heavy buying in the last few bars, but price is falling — classic exhaustion/distribution into strength. Wait for: price to reject from the session's VAH or fail to reclaim the POC on the next attempt. A single VZA reading isn't enough — you want to see that rejection actually happen at a profile level, not just assume it. Then: look for a short entry on the rejection candle, stop above the VAH, target back toward POC or VAL.
[!] SELLING CLIMAX — Reversal Risk
What it means: heavy selling absorbed, but price is still rising — exhaustion into weakness, mirror of the above. Wait for: price to hold above the session VAL or reclaim the POC after the climax bar. Then: long entry on the reclaim, stop below VAL, target POC or VAH.
Trend-confirmation signals
[+] STRONG BULLISH DEMAND
What it means: wide-spread up candles, rising price, buy delta dominant — a genuine markup move, not just noise. Wait for: a pullback into the session POC or VAL rather than chasing the move. Demand zones tend to get retested once before continuing. Then: long on a POC/VAL bounce that holds, stop below VAL, target new highs or the prior VAH.
[-] STRONG BEARISH SUPPLY
What it means: mirror of the above — markdown phase, supply in control. Wait for: a pullback into POC or VAH. Then: short on rejection there, stop above VAH, target new lows or VAL.
Absorption / hidden-flow signals
[*] HIDDEN STRENGTH (Absorption)
What it means: strong buy volume despite price declining — supply is being absorbed quietly, often before a reversal. Wait for: price to reclaim back above VAL or POC — this is the confirmation that absorption is turning into actual upward acceptance, not just a temporary floor. Then: long on the reclaim, stop below the absorption zone's low.
[*] HIDDEN WEAKNESS (Distribution)
What it means: mirror — strong sell volume despite price rising. Wait for: price to lose VAH or POC support. Then: short on the breakdown, stop above the distribution zone's high.
Zone / consolidation signals
[#] ACCUMULATION ZONE
What it means: buy volume dominant, narrow spread, price contained — professional buying without pushing price yet. Wait for: a breakout above the current session's VAH, ideally with volume expansion on the breakout candle. A narrow-spread accumulation zone that breaks value without volume is more likely a fake move. Then: long on the confirmed breakout, stop back inside the value area.
[#] DISTRIBUTION ZONE
What it means: mirror — sell volume dominant, price propped up. Wait for: a breakdown below the current session's VAL with volume expansion. Then: short on the confirmed breakdown, stop back inside the value area.
Continuation signals (lower conviction — use as context, not a trigger)
[^] MODERATE BULLISH PRESSURE / [v] MODERATE BEARISH PRESSURE
What it means: directional delta and price agree, but without the wide spread or extreme delta of the "Strong" signals — a normal trending condition, not necessarily an entry moment on its own. Wait for: use this to bias which side of the POC you're willing to trade from, rather than as a standalone trigger. If price is above POC and VZA reads Moderate Bullish, favor long setups; if it dips back to POC, that alignment is your entry cue, not the VZA reading alone.
No-edge signals — stand aside
[=] BALANCED — No Clear Edge
What it means: buy/sell volume roughly equal — the market's in equilibrium. Wait for: a delta expansion combined with a break of the session's VAH or VAL. Balanced + inside value area = no trade.
[?] MIXED SIGNALS
What it means: price and volume direction are diverging with no clean pattern — could be a trap, could be indecision. Wait for: the next 1-2 candles to either resolve into a directional VZA reading or approach a POC/VAH/VAL level with volume. Don't force a trade into genuinely mixed conditions — this signal exists specifically to tell you not to act yet.
General rule of thumb
VZA answers "what is volume doing in this zone." Session Profiles answers "where is price likely to react." Treat a VZA signal as a hypothesis and the nearest POC/VAH/VAL as the level where you'll find out if it's right. The strongest setups are where both agree — e.g. Hidden Strength forming right at a session VAL, or a Buying Climax rejecting exactly at VAH. When VZA and the profile level disagree (e.g. Strong Bullish Demand appearing well outside any value area, with no POC nearby), that's a lower quality setup — the volume story has less structure to confirm against.
This workflow is educational context, not a mechanical trading system. Combine with your own risk management and market read.