Institutional ETH Levels

Short description

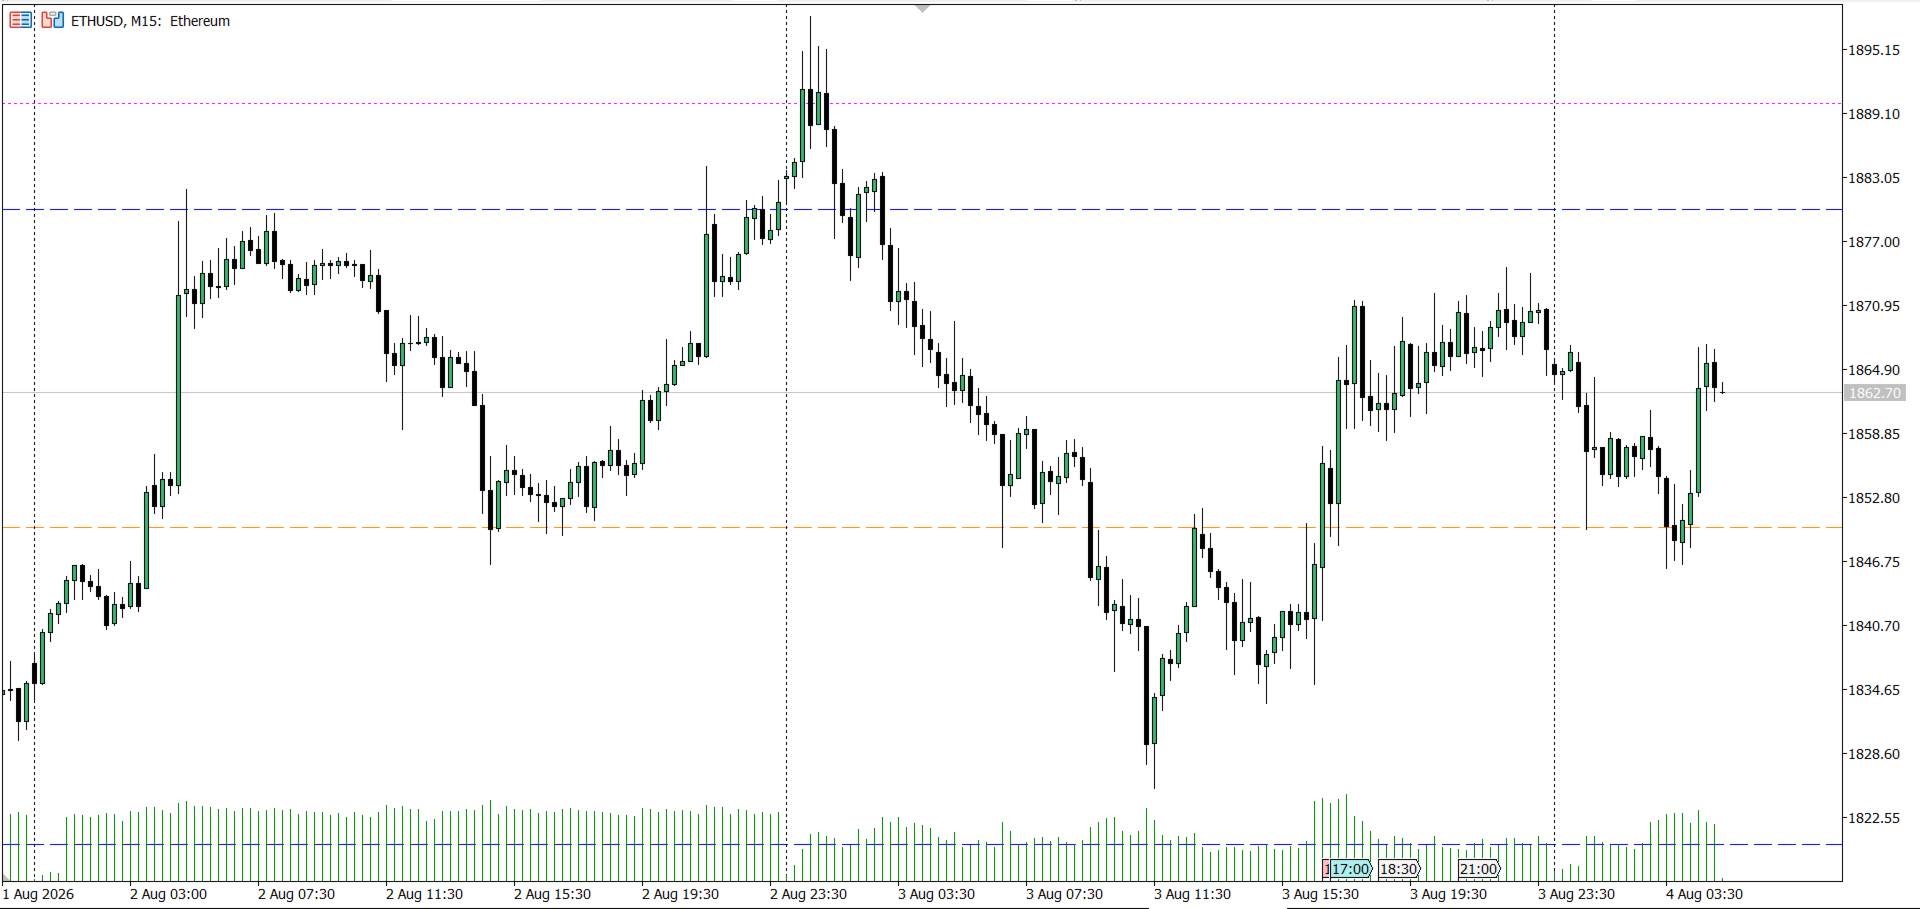
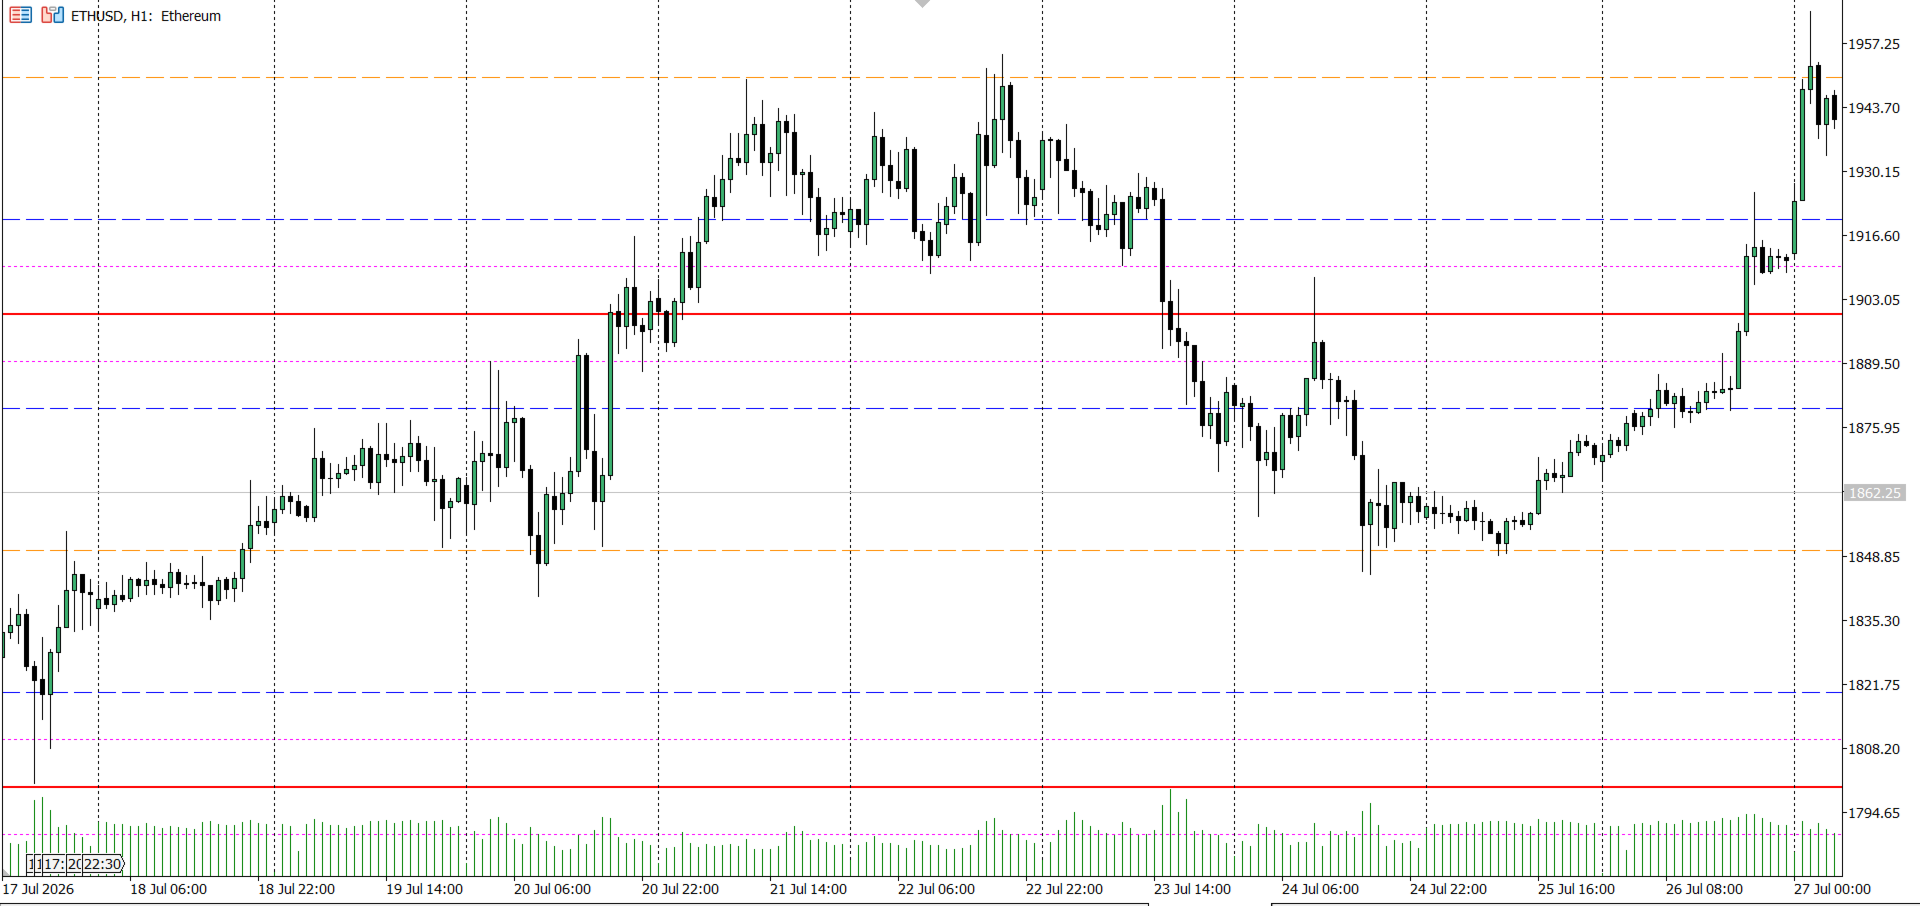
Plots a repeating grid of round-dollar levels on ETHUSD — labeled Wall / Hot Zone / Exit / Trap by their typical institutional role — tuned for lower timeframes (M1 through H1).

Full description

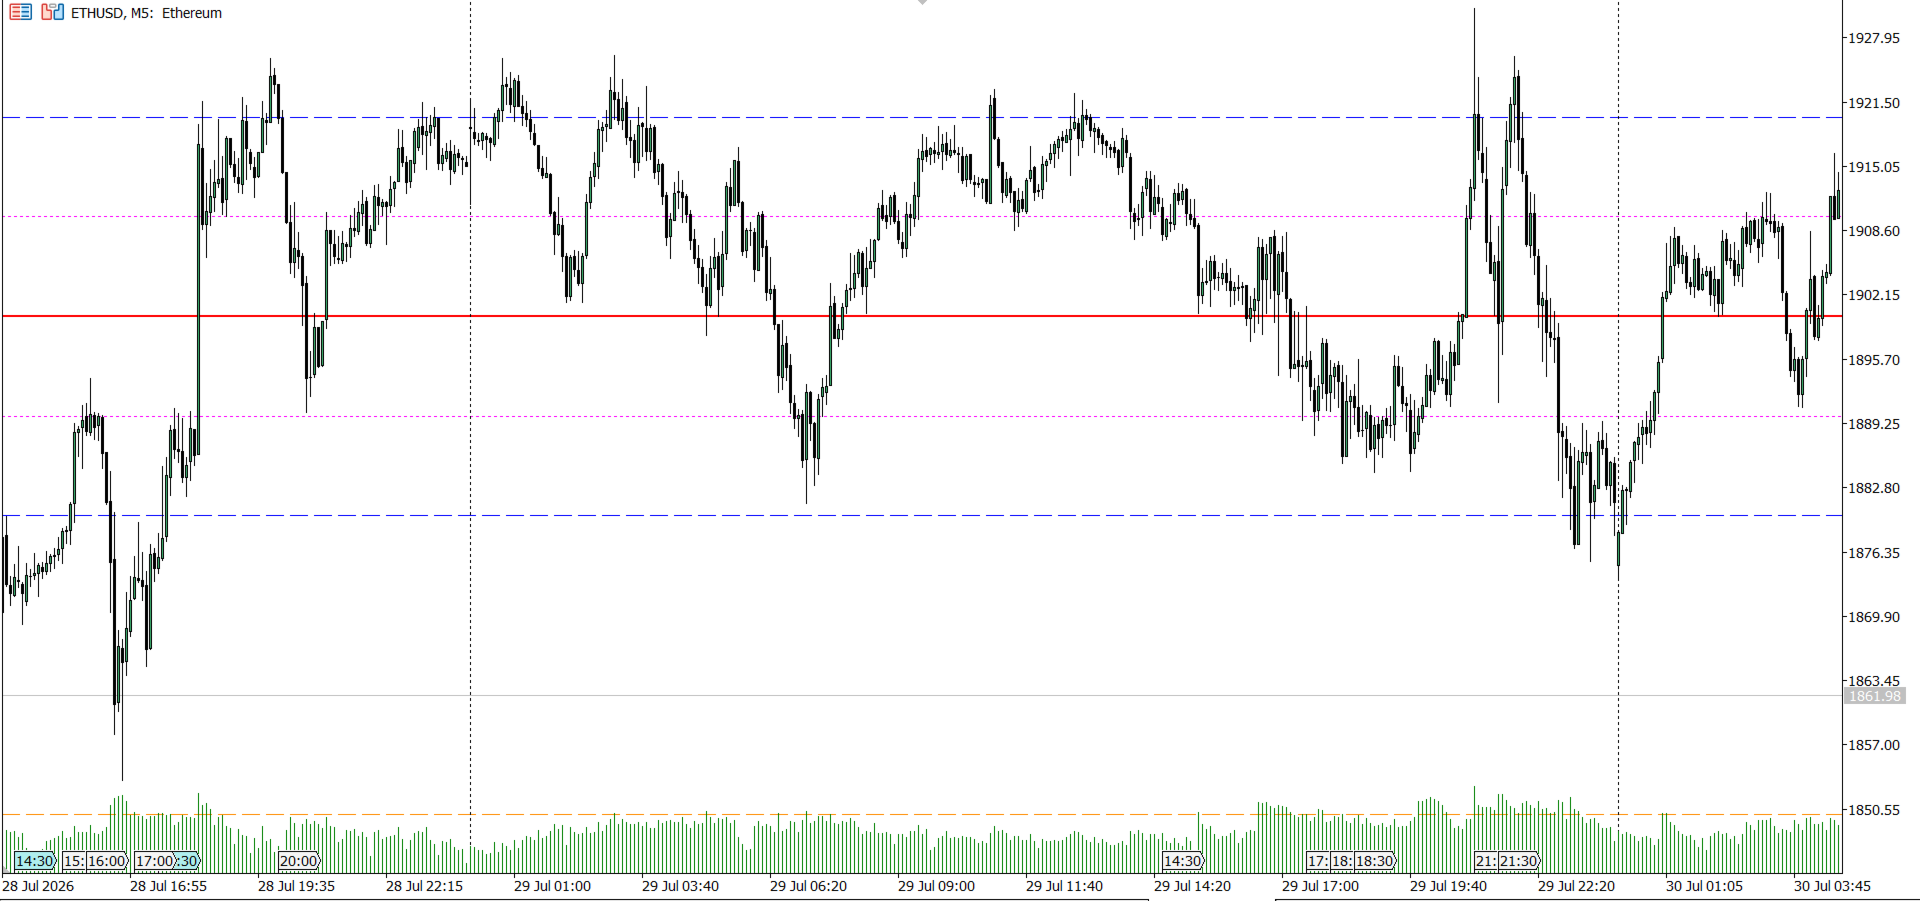
Draws horizontal reference lines at 10 intervals around the current ETHUSD price, based on the idea that round-dollar levels (multiples of $100, and near-round levels like $X20/ X80, $X50, $X10/$X90) tend to act as psychological reaction zones where liquidity and stop-hunts commonly cluster — the same concept used in classic Forex "big figure" analysis, rescaled to ETH's dollar price structure instead of pip fractions.

Each level is labeled by role:

  • $100 Round Level — The Wall: a major psychological level, often a zone of rejection
  • $20 / $80 Sub-Level — The Hot Zone: a common area to watch for entry confirmation via price action or volume
  • $50 Midpoint — The Exit: often used as a partial take-profit reference
  • $10 / $90 Sub-Level — The Trap: prone to fakeouts and stop hunts near the round number — a caution zone, not an entry signal

Built for ETHUSD specifically: the $10 step size is calibrated to ETH's price scale and is most useful on lower timeframes (M1–H1) where price frequently interacts with these levels intraday. An on-screen note fires if you attach it to a non-ETH symbol, since the fixed dollar grid won't make sense at a different price scale (adjust the step-size input if you want to experiment elsewhere).

Behavior: lines update in place with no flicker, refresh automatically on a timer as well as on new bars, and clean up instantly after scrolling or zooming.

This tool is a visual reference only — it does not generate trade signals. For informational and educational purposes only, not financial advice.
Другие продукты этого автора
Short description Draws a rolling Time-Price-Opportunity (TPO) volume profile for the Asia, London, and New York sessions, with POC/VAH/VAL levels, a session histogram, and automatic broker GMT-offset detection. Full description Plots a separate market-profile-style histogram for each of the three major trading sessions (Asia, London, New York), going back a configurable number of days. Each session shows: POC (Point of Control) — the price level with the most time spent VAH/VAL (Value Area High
FREE
Drop two vertical lines on your chart (Zone Start / Zone End) and drag them anywhere — the panel recalculates live and shows: Total volume in the selected zone, plus the buy/sell split (estimated from each candle's close position within its range) Delta and Delta % with a simple visual ratio bar Average spread with wide/narrow candle counts (excludes the still-forming candle to avoid skewing the average) A VSA-style conclusion in plain language — Strong Bullish Demand, Hidden Strength/Absorption
FREE
Short description: Reads a Barchart CME British Pound ( B6 ) options CSV, solves Black-76 implied volatility per strike, and draws a right-anchored dealer GEX profile on GBPUSD with live-calculated Call Wall, Put Wall, and Zero-Gamma flip lines. Full description: Converts a daily CME British Pound options CSV from Barchart ( B6 futures root) into an on-chart Gamma Exposure profile for GBPUSD . It renders a right-anchored bar panel showing net dealer gamma per strike alongside three key levels—C
FREE
Short description: A higher-timeframe round-number grid for major Forex pairs — major whole-number levels, monthly midpoints, and quarter levels (with optional eighths), spanning a wide configurable pip range. Built for H4 and above. Full description: Plots a large-scale psychological-level grid across whole numbers, half-levels, and quarters — the higher-timeframe counterpart to intraday round-number analysis. Designed for swing and position-level context on H4 and above , not for scalping time
FREE
Фильтр:
Нет отзывов
Ответ на отзыв