PriceLevels HTF

Short description: A higher-timeframe round-number grid for major Forex pairs — major whole-number levels, monthly midpoints, and quarter levels (with optional eighths), spanning a wide configurable pip range. Built for H4 and above.

Full description:

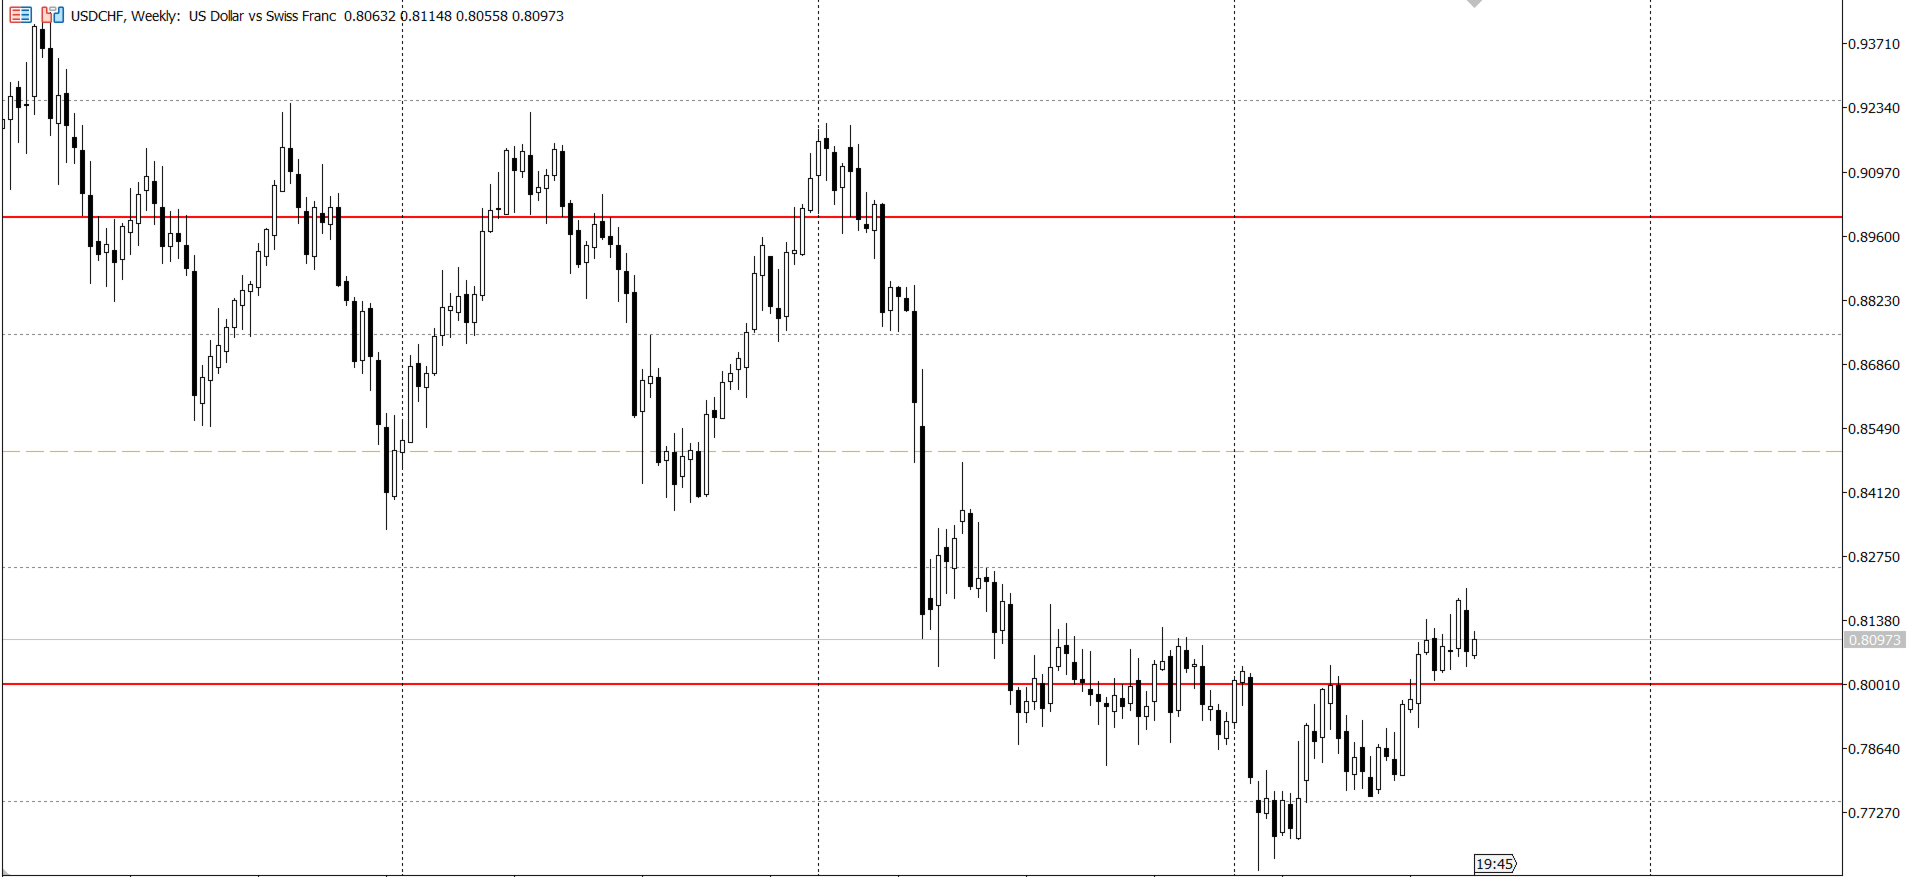
Plots a large-scale psychological-level grid across whole numbers, half-levels, and quarters — the higher-timeframe counterpart to intraday round-number analysis. Designed for swing and position-level context on H4 and above, not for scalping timeframes.

Four tiers of levels:

  • Major Trend (.000) — full round-number levels, the most significant structural levels on the pair
  • Monthly Target (.500) — half-level midpoints
  • Institutional Entry/Exit (.250 / .750) — quarter levels
  • Sub-Quarter (.125 / .375 / .625 / .875) — optional eighths, off by default, for traders who want finer granularity

Works on all major Forex pairs — pip size is read directly from the attached symbol, so spacing is correct on 5-digit and JPY-style 3-digit pairs alike (EURUSD, GBPUSD, USDJPY, AUDUSD, USDCAD, USDCHF, NZDUSD, etc.).

Behavior: lines update in place with no flicker when you change colors/styles, and the grid's visible range extends automatically as price moves, without needing to reload the indicator.

Inputs: full color/style/width control per tier, an eighths toggle, and the total pip range to display above/below price (default 2000 pips, suited to H4+ swing analysis).

This tool is a visual reference only — it does not generate trade signals. For informational and educational purposes only, not financial advice.


Другие продукты этого автора
Short description Draws a rolling Time-Price-Opportunity (TPO) volume profile for the Asia, London, and New York sessions, with POC/VAH/VAL levels, a session histogram, and automatic broker GMT-offset detection. Full description Plots a separate market-profile-style histogram for each of the three major trading sessions (Asia, London, New York), going back a configurable number of days. Each session shows: POC (Point of Control) — the price level with the most time spent VAH/VAL (Value Area High
FREE
Drop two vertical lines on your chart (Zone Start / Zone End) and drag them anywhere — the panel recalculates live and shows: Total volume in the selected zone, plus the buy/sell split (estimated from each candle's close position within its range) Delta and Delta % with a simple visual ratio bar Average spread with wide/narrow candle counts (excludes the still-forming candle to avoid skewing the average) A VSA-style conclusion in plain language — Strong Bullish Demand, Hidden Strength/Absorption
FREE
Short description: Reads a Barchart CME British Pound ( B6 ) options CSV, solves Black-76 implied volatility per strike, and draws a right-anchored dealer GEX profile on GBPUSD with live-calculated Call Wall, Put Wall, and Zero-Gamma flip lines. Full description: Converts a daily CME British Pound options CSV from Barchart ( B6 futures root) into an on-chart Gamma Exposure profile for GBPUSD . It renders a right-anchored bar panel showing net dealer gamma per strike alongside three key levels—C
FREE
Short description Plots a repeating grid of round-dollar levels on ETHUSD — labeled Wall / Hot Zone / Exit / Trap by their typical institutional role — tuned for lower timeframes (M1 through H1). Full description Draws horizontal reference lines at 10 intervals around the current ETHUSD price, based on the idea that round-dollar levels (multiples of $100, and near-round levels like $X20/ X80, $X50, $X10/$X90) tend to act as psychological reaction zones where liquidity and stop-hunts commonly clu
FREE
Фильтр:
Нет отзывов
Ответ на отзыв