Volume Zone Analyzer
- インディケータ
- バージョン: 4.14
- アップデート済み: 31 8月 2026

Volume Zone Analyzer — VSA-Based Volume, Delta & Spread Reader
Turn any price zone into a Volume Spread Analysis.
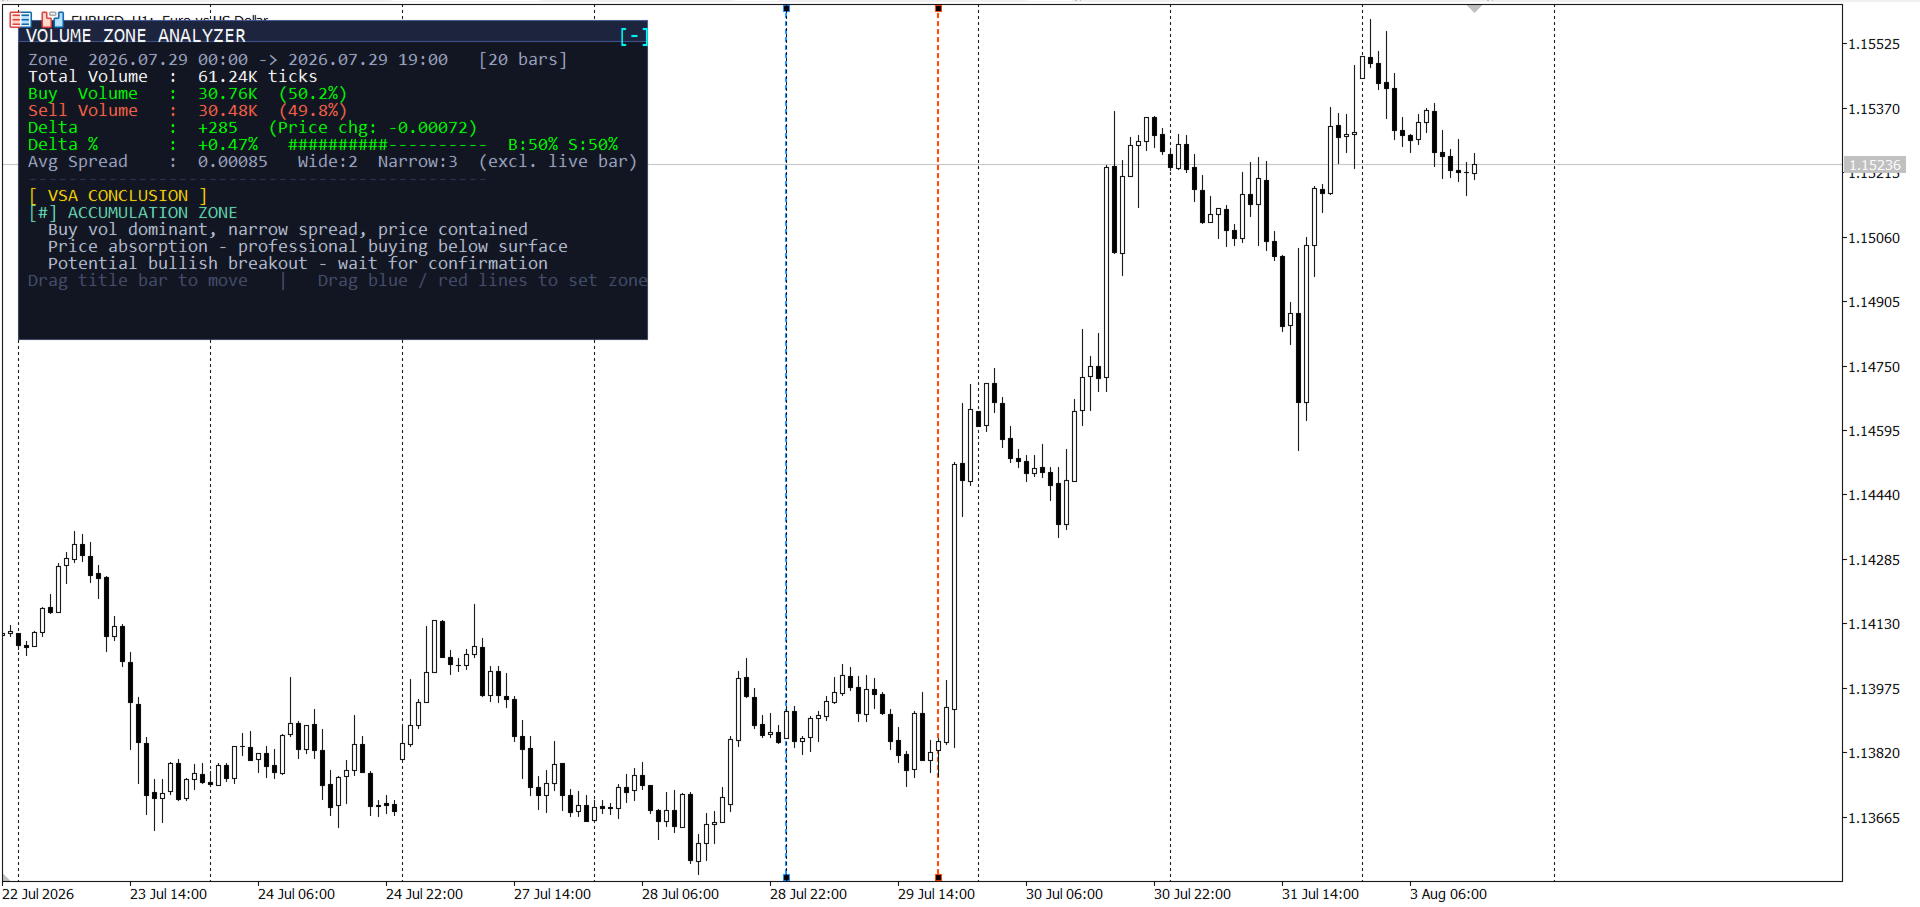
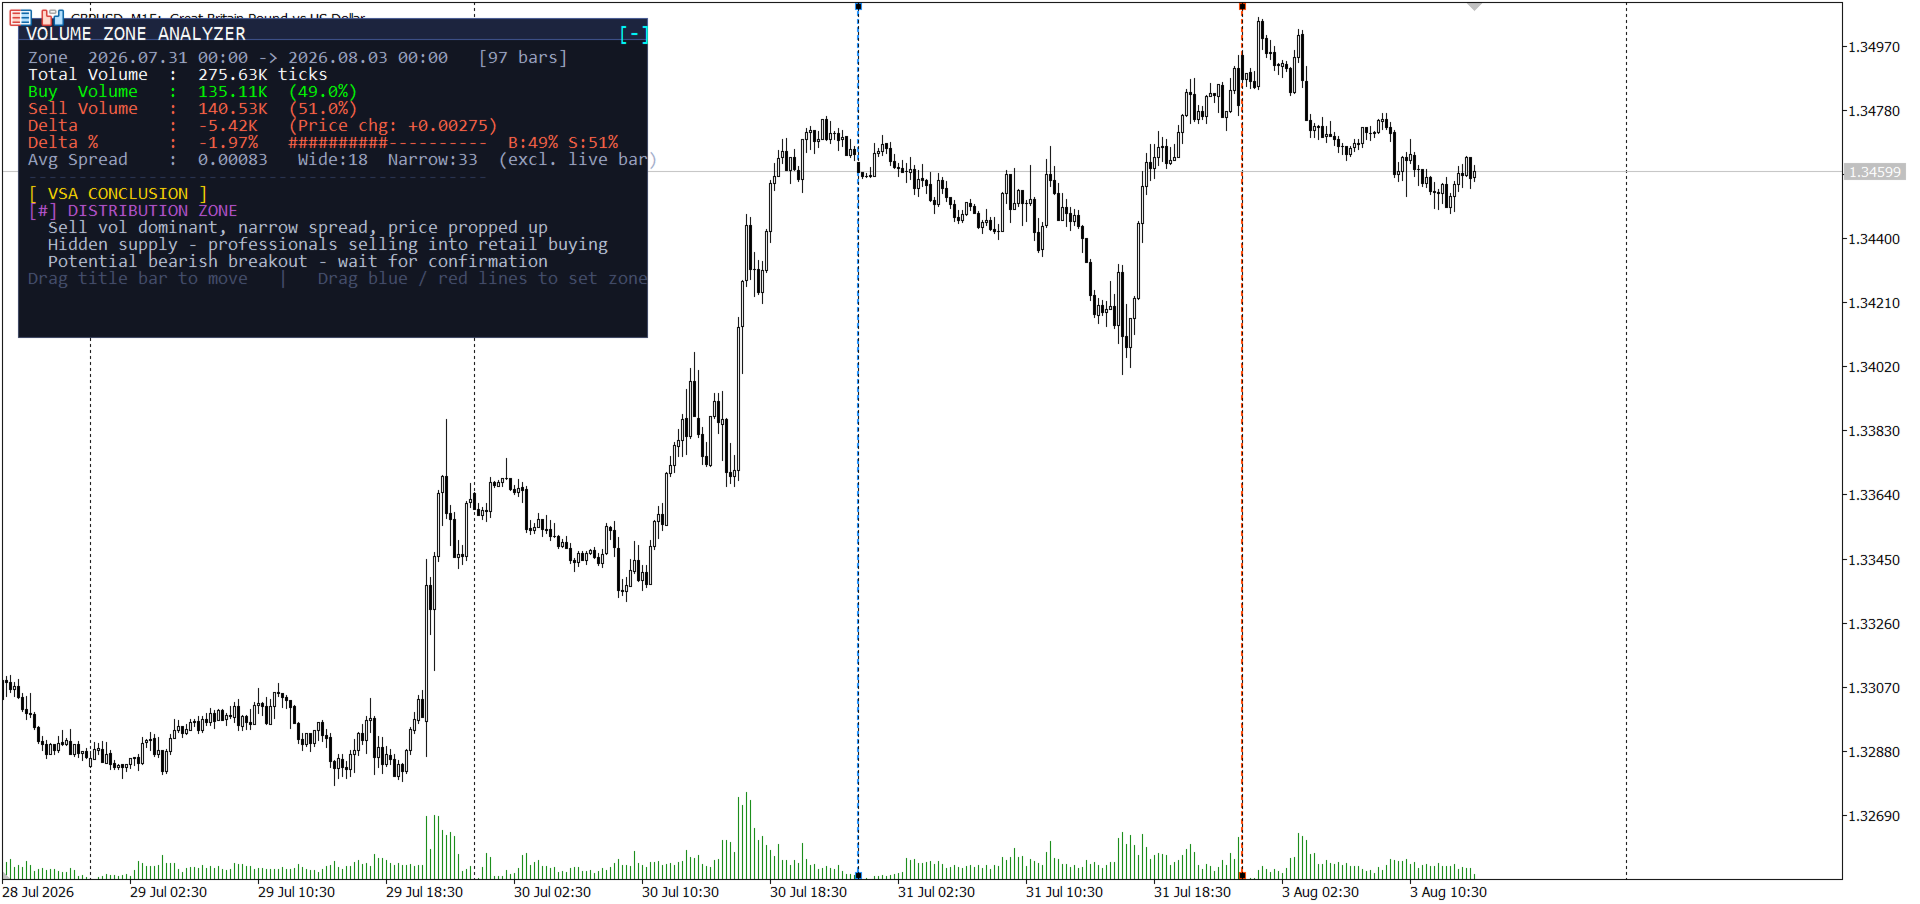
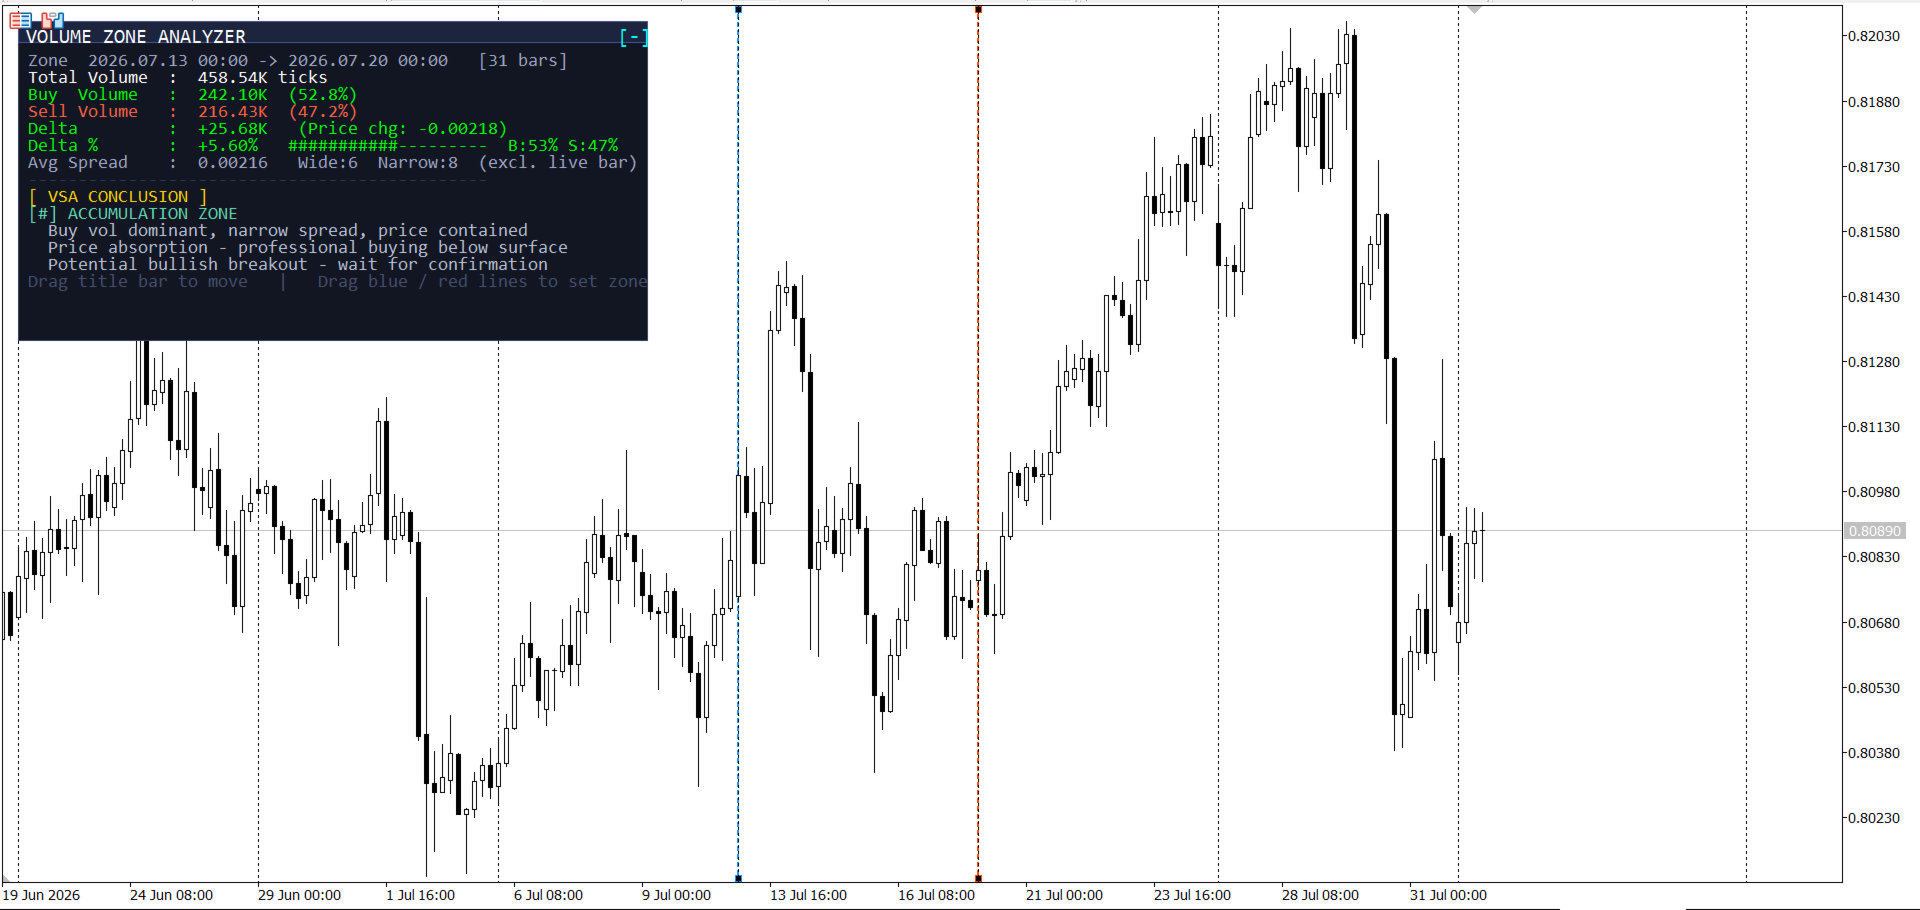
Drop two draggable lines on your chart to mark a Zone Start and Zone End, and Volume Zone Analyzer instantly breaks down what happened inside that zone:
- Total Volume for the selected range
- Buy / Sell Delta — estimated from where each candle closes within its own high-low range
- Delta % with a visual buy/sell ratio bar
- Average Spread, plus a count of wide vs. narrow-spread candles (the still-forming candle is automatically excluded so it doesn't skew the average)
- A VSA-style conclusion in plain language — Strong Bullish Demand, Hidden Strength/Absorption, Accumulation/Distribution Zone, Buying/Selling Climax, Moderate Pressure, Balanced, or Mixed Signals — based on how volume, price direction, and spread width line up
The panel is collapsible and repositionable so it stays out of your way when you don't need it.
Built-in big-figure grid strategy
Volume Zone Analyzer is designed to be dragged across the standard .00 big-figure grid for a structured read on each level type:
| Grid Level | Role | What to check |
|---|---|---|
| .000 The Wall | Major S/R, big-figure liquidity | Drag across the approach — a Buying/Selling Climax signal here (high volume against price direction) means exhaustion, not breakout |
| .100 / .900 The Trap | Stop-hunt / fakeout zone | Hidden Strength/Weakness (Absorption) on a wick-through — strong opposing delta with no follow-through — confirms a trap; don't chase the breakout |
| .200 / .800 The Hot Zone | Entry zone | Your highest-confidence trigger: Strong Bullish Demand / Bearish Supply (wide-spread candles, delta >22%, price confirming) |
| .500 The Exit | Take-profit | A Balanced or Mixed Signals read near .500 after entering from the Hot Zone tells you volume no longer supports continuation — time to take profit |
This gives the indicator a repeatable workflow, not just a number readout: walk the zone across each grid level and let the VSA conclusion tell you whether you're looking at a trap, an entry, or an exhaustion point.
Works well paired with session/market-profile tools — use the VSA read to form a hypothesis about a zone, then use POC/VAH/VAL levels as the trigger that confirms or invalidates it.
Important note on data
Forex tick volume is a synthetic proxy for trading activity, not true executed volume (that requires a CME futures feed) — this is standard across all retail OTC forex charting. The buy/sell splits and delta figures here are heuristic estimates derived from candle structure, not a direct measurement of order flow. Use this as a supplementary read on market character alongside your own analysis — not as a standalone signal.
For informational and educational purposes only — not financial advice.