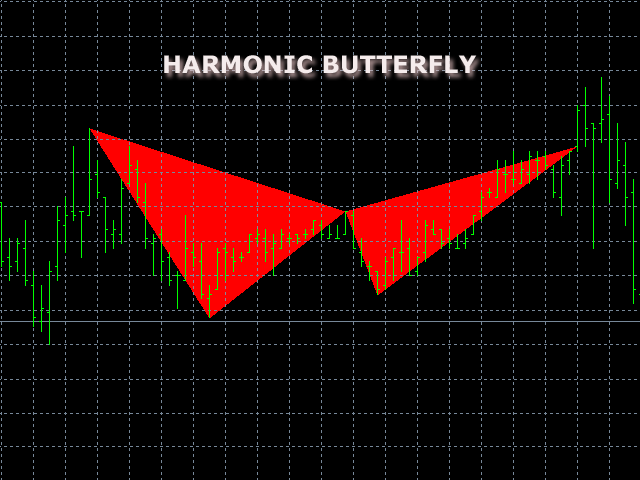
Harmonic Butterfly MT5
- Indicadores
-
Sergey Deev
 I'm implementing your ideas in MQL4: https://www.mql5.com/ru/job/new?prefered=work2it
 - Versão: 1.2
- Atualizado: 25 fevereiro 2022
- Ativações: 5
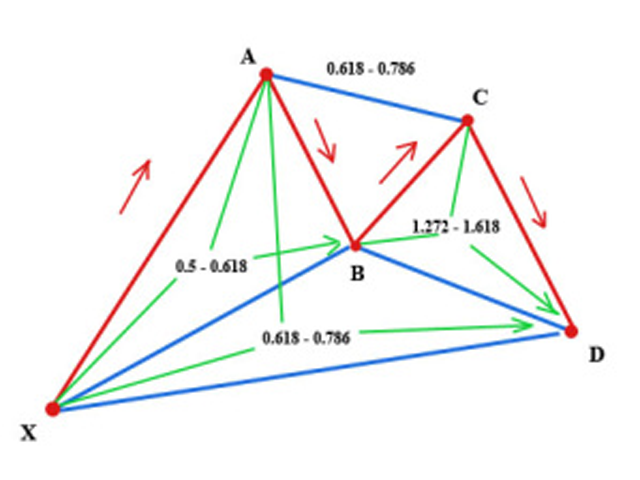
The indicator detects and displays М. Gartley's Butterfly pattern. The pattern is plotted by the extreme values of the ZigZag indicator (included in the resources, no need to install). After detecting the pattern, the indicator notifies of that by the pop-up window, a mobile notification and an email. The pattern and wave parameters are displayed on the screenshots. The default parameters are used for demonstration purposes only in order to increase the amount of detected patterns.
Parameters
- zzDepth, zzDev, zzBack - ZigZag parameters
- factorAB_min, factorAB_max - minimum and maximum ratio of AB and AX levels (see the screenshot)
- factorBC_min, factorBC_max - minimum and maximum ratio of BС and AB levels (see the screenshot)
- factorCD_min, factorCD_max - minimum and maximum ratio of CD and BC (see the screenshot)
- factorAD_min, factorAD_max - minimum and maximum ratio of AD and AX (see the screenshot)
- bearColor - bearish pattern color
- bullColor - bullish pattern color
- CountBars - limit the amount of bars to be processed by the indicator (reduces the initial download time)
- UseAlert - enable pop-up messages
- UseNotification - enable push notifications
- UseMail - enable email notifications


O usuário não deixou nenhum comentário para sua avaliação