FFx Universal MTF Alerter MT5
- Indicadores
- Eric Venturi-Bloxs
- Versão: 1.2
- Atualizado: 16 junho 2021
- Ativações: 20
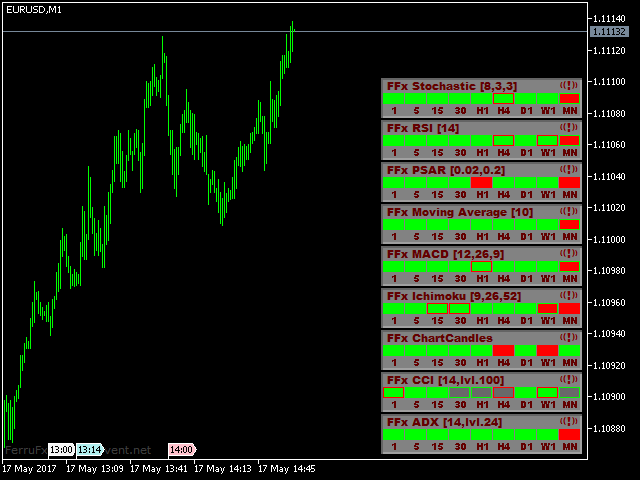
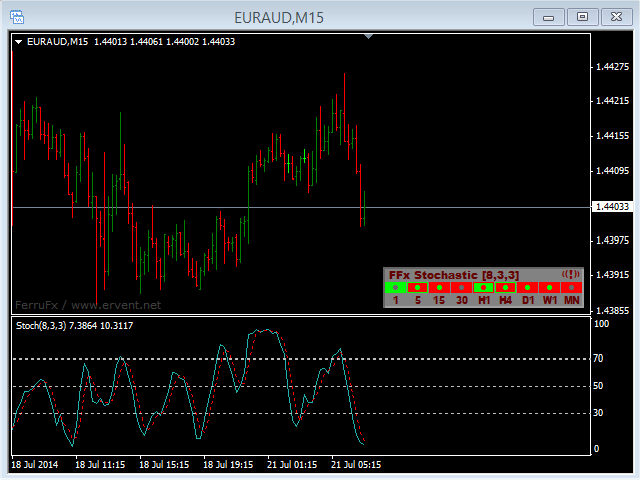
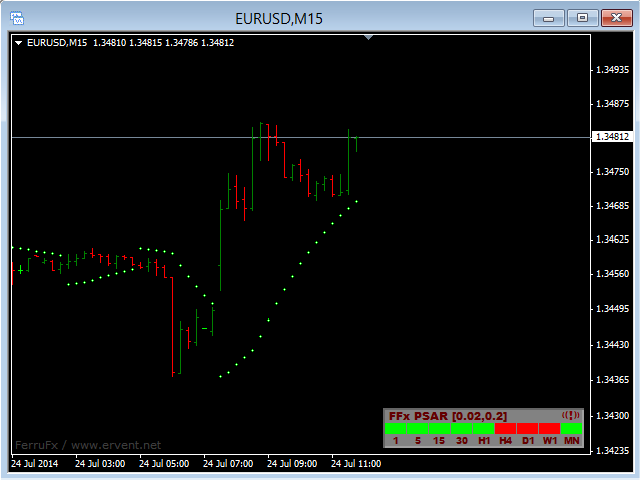
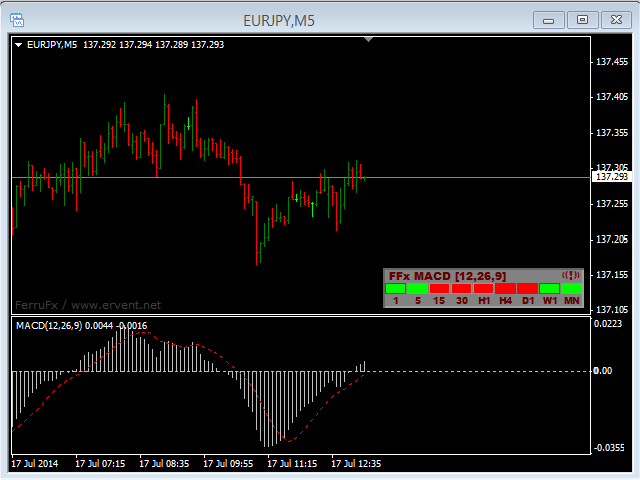
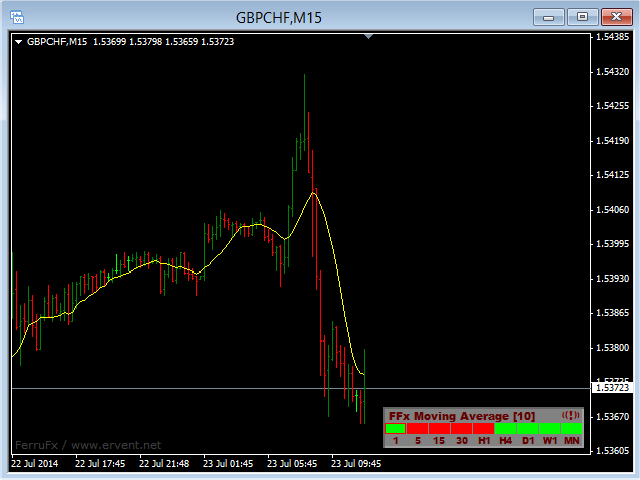
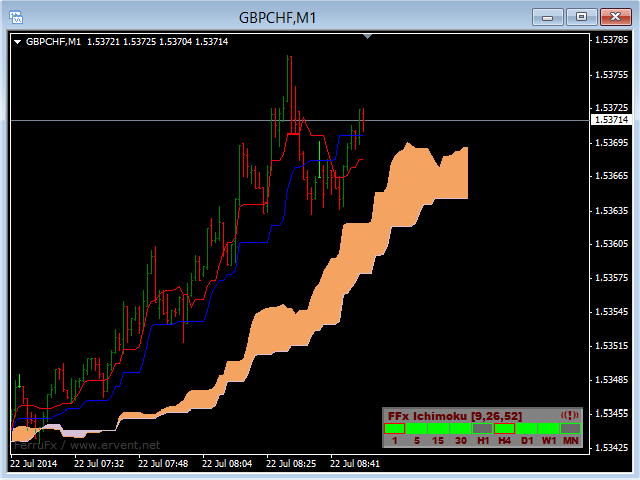
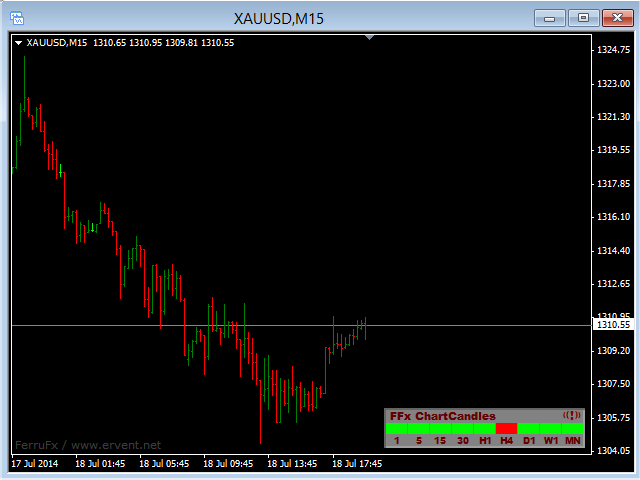
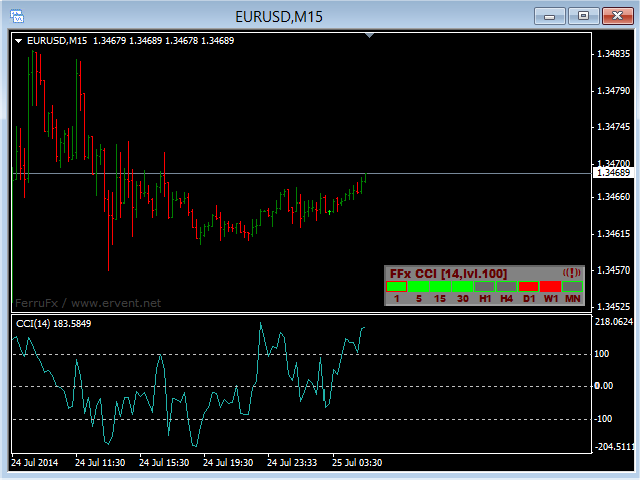
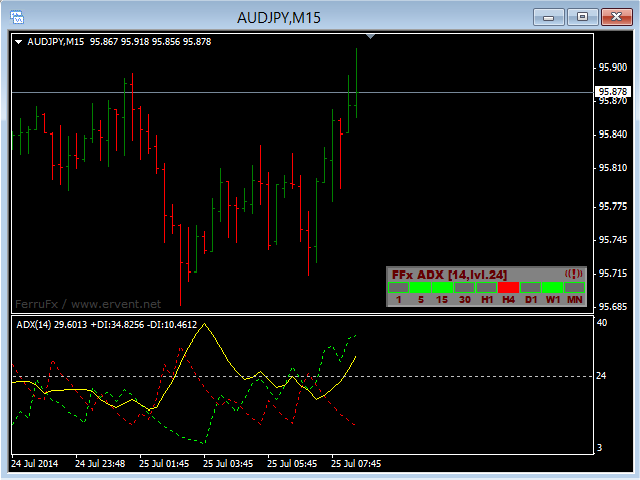
The FFx Universal MTF alerter shows on a single chart all the timeframes (M1 to Monthly) with their own status for the chosen indicator.
9 indicators mode (MACD-RSI-Stochastic-MA-ADX-Ichimoku-Candles-CCI-PSAR). Each can be applied multiple times on the same chart with different settings.
Very easy to interpret. Confirm your BUY entries when most of the timeframes are showing green color. And confirm your SELL entries when most of the timeframes are showing red color.
2 Alert Options: input to select the timeframes to be used for the alert(s).
- Single timeframe: each selected timeframe alert separately when a signal occurs
- Multi timeframes: all selected timeframes must agree for an alert to be triggered
How to understand the status:
- Green square: indicator is trending up
- Red square: indicator is trending down
- Green/Red border: indicator is reversing
Options available in the FFx Dashboard Alerter:
- Select the indicator mode
- Select the timeframes to trigger the alerts
- Alert pop up/sound/email/push
- Activate/deactivate the alert directly on the chart
- Position on the chart
- ... and all usual settings of the standard indicators
How to set alert:
- In the parameters pop up: select the alert you want and the alert mode (pop up and/or sound and/or email and/or push notification)
- Then On chart: simple click on the ((!)) icon. It will change color signaling that it changed its status. Red to Green means it is now activated. Green to Red means that it is now deactivated.
Input parameters
Common User Inputs
- Dashboard ID: set here a different number for each instance applied on the same chart
- Alert Single TFs: set here the timeframes you want to be alerted separately
- Alert Combined TFs: set here the combination of timeframes you want to be alerted
- Signal at Candle close: select here to enable the alert at candle close
- Display: set here the window where you want the dashboard to be applied (0=price chart / 1=first sub-window)
- Shift X: you can set here any number to place the dashboard anywhere on the chart
- Shift Y: you can set here any number to place the dashboard anywhere on the chart
- Sound Alert: select here to enable the sound alert
- Popup Alert: select here to enable the popup alert
- Email Alert: select here to enable the email alert
- Push Alert: select here to enable the push notification
ADX Inputs
- Period: period of the ADX
- Level: level for the alert
- Alert ADX crosses level: select here to enable the alert
- Alert +DI/-DI cross: select here to enable the alert
CCI Inputs
- Period: period of the CCI
- Applied Price: applied price of the CCI
- Level: level for the alert
- Alert CCI crosses level: select here to enable the alert
- Alert CCI line reverses: select here to enable the alert
Ichimoku Inputs
- Tenkan sen: period of the Tenkan sen
- Kijun sen: period of the Kijun sen
- Senkou span b: period of the Senkou span b
- Alert Price cross Cloud: select here to enable the alert
- Alert Tenkan crosses Kijun: select here to enable the alert
MACD Inputs
- FastEMA: fast EMA period of the MACD
- SlowEMA: slow EMA period of the MACD
- SignalSMA: SMA period of the MACD
- Applied Price: applied price of the MACD
- Alert Histo crosses Signal line: select here to enable the alert
- Alert Histo crosses Zero line: select here to enable the alert
MA Inputs
- Period: period of the MA
- Shift: shift of the MA
- Method: method of the MA
- ApplyTo: applied price of the MA
- Alert Price crosses MA line: select here to enable the alert
- Alert MA line reverses: select here to enable the alert
PSAR Inputs
- Step: step of the PSAR
- Maximum: maximum of the PSAR
RSI Inputs
- Period: period of the RSI
- ApplyTo: applied price of the RSI
- OverBought Level: level for the alert
- OverSold Level: level for the alert
- Alert RSI crosses 50 line: select here to enable the alert
- Alert RSI enters OBOS: select here to enable the alert
- Alert RSI exits OBOS: select here to enable the alert
Stochastic Inputs
- KPeriod: k period of the STO
- DPeriod: d period of the STO
- Slowing: slowing of the STO
- MAMethod: method of the STO
- PriceField: applied price of the STO
- OverBought Level: level for the alert
- OverSold Level: level for the alert
- Alert Stoch crosses Signal line: select here to enable the alert
- Alert Stoch crosses 50 line: select here to enable the alert
- Alert Stoch enters OBOS: select here to enable the alert
- Alert Stoch exits OBOS: select here to enable the alert



























O usuário não deixou nenhum comentário para sua avaliação