PZ Harmonacci Patterns MT5
- Indicadores
- Versão: 12.0
- Atualizado: 16 julho 2024
- Ativações: 20

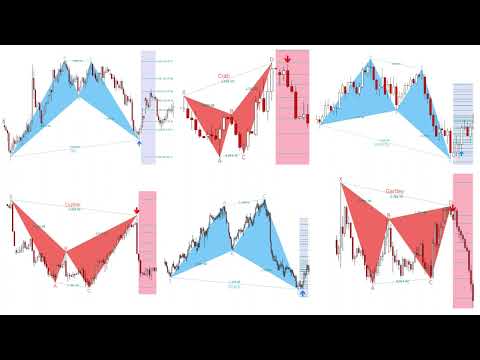
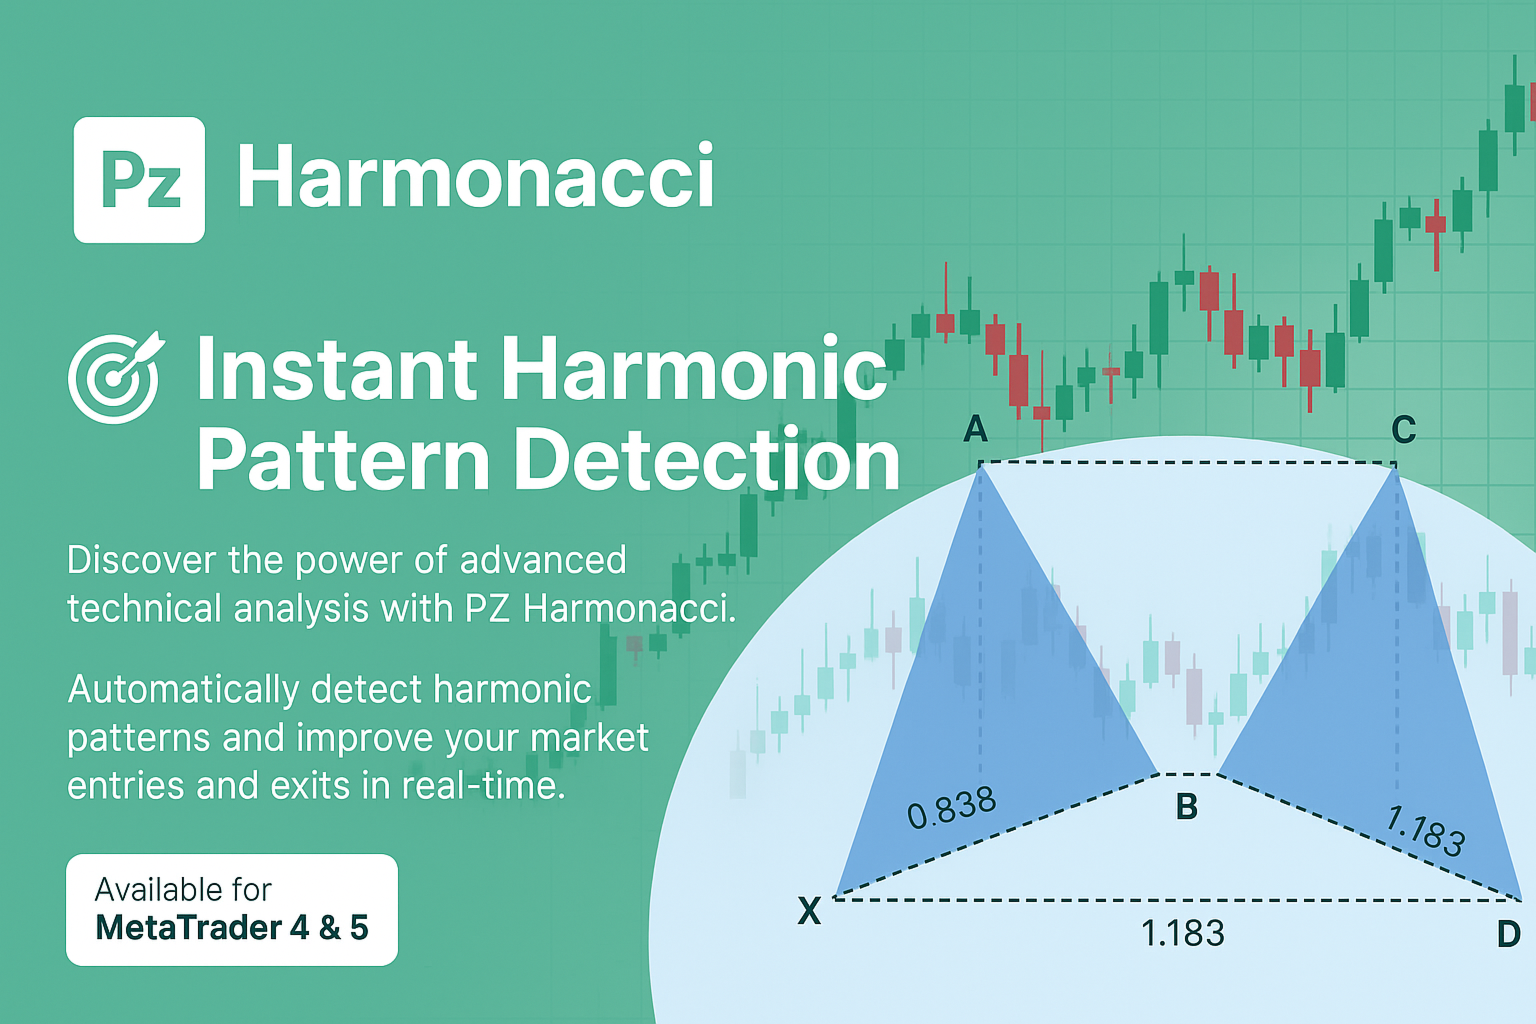
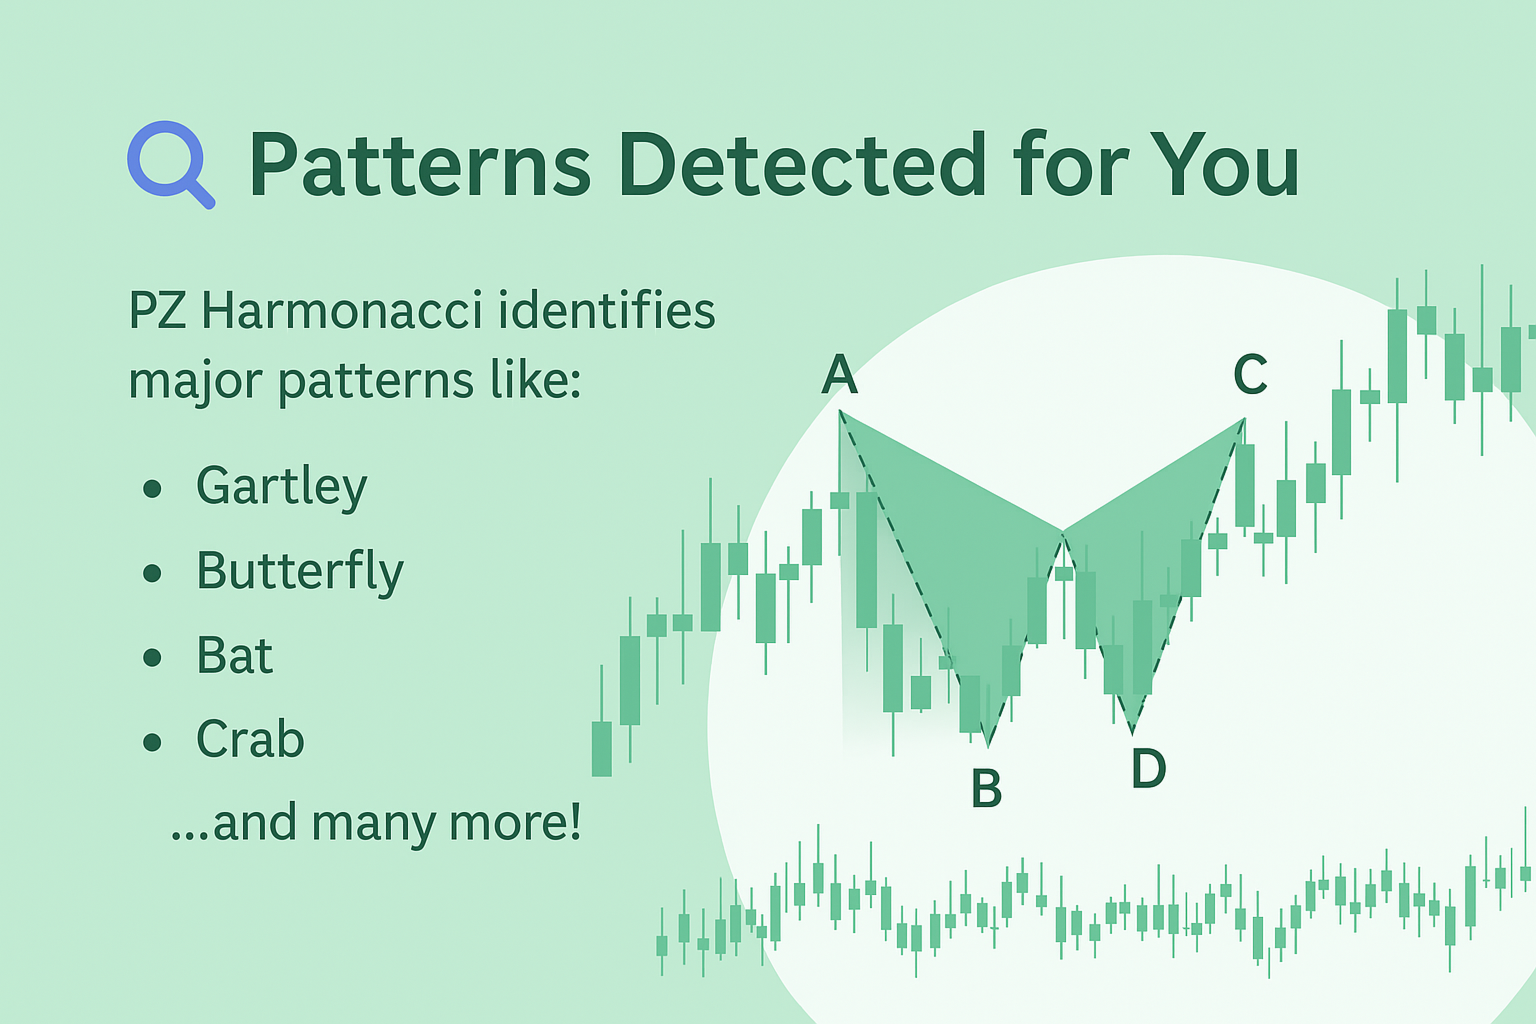
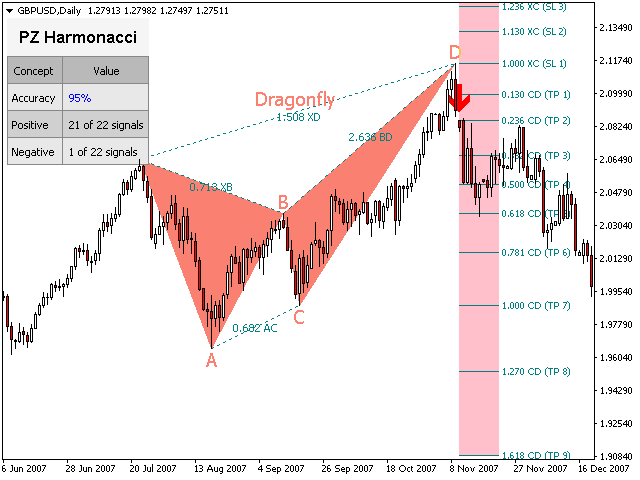
Este é sem dúvida o indicador de reconhecimento automático de formação de preço harmônico mais completo que você pode encontrar para a MetaTrader Platform. Ele detecta 19 padrões diferentes, leva as projeções de Fibonacci tão a sério quanto você, exibe a Zona de Reversão Potencial (PRZ) e encontra níveis adequados de stop loss e take-profit.
[ Guia de instalação | Guia de atualização | Solução de problemas | FAQ | Todos os produtos ]
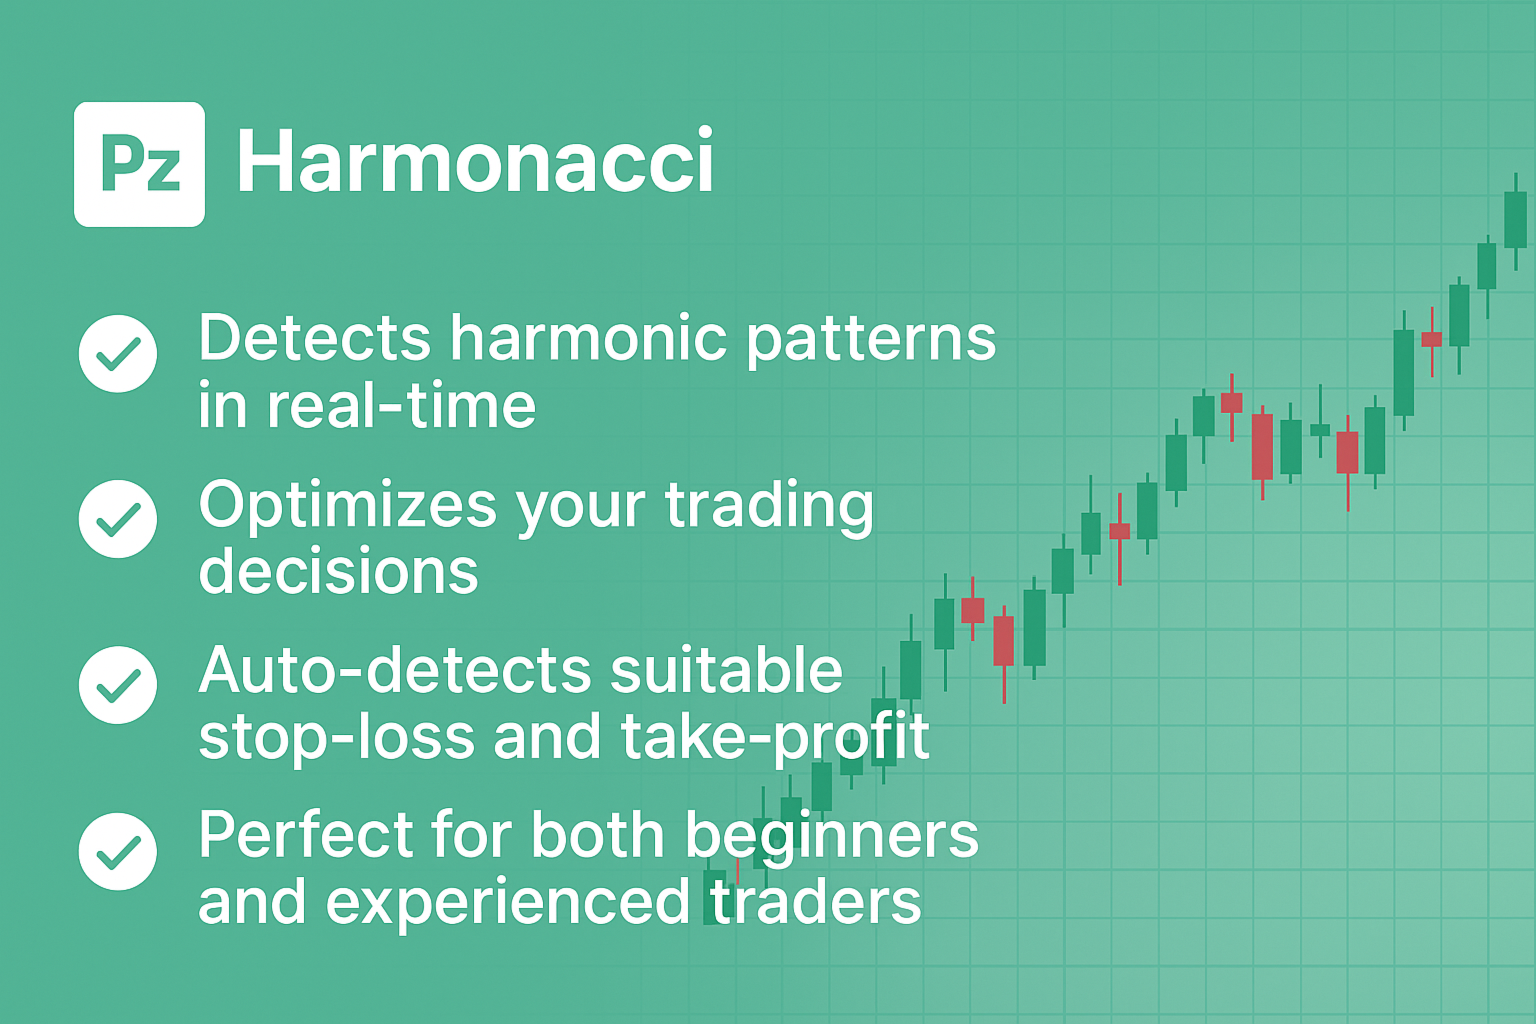
- Detecta 19 formações harmônicas de preços diferentes
- Traça projeções de Fibonacci primárias, derivadas e complementares (PRZ)
- Avalia a ação do preço passado e exibe todos os padrões passados
- O indicador analisa sua própria qualidade e desempenho
- Ele exibe níveis adequados de stop-loss e take-profit
- Utiliza breakouts para sinalizar negociações adequadas
- Plota todas as proporções de padrão no gráfico
- Implementa alertas de email / som / visuais
Inspirado no livro de Scott M. Carney, este indicador foi projetado para atender às necessidades dos comerciantes mais puristas e exigentes. No entanto, ele implementa uma reviravolta para facilitar o comércio: aguarda uma fuga Donchian na direção certa antes de sinalizar o comércio, tornando seus sinais muito confiáveis.
- As projeções de Fibonacci são independentes de vetores
- Implementa alertas de email / som / push
- Traça a projeção ABCD
Importante: Alguns nomes de padrões foram renomeados para alternativas auto-explicativas para atender a uma reclamação de marca registrada do Sr. Scott M. Carney , proprietário das seguintes marcas nos EUA: Harmônicas, Comércio de Harmônicas, Padrão de Morcego, Padrão de Borboleta, Padrão de Tubarão, Padrão de caranguejo e padrão de cinco-O .
Formações de preços harmônicos suportados
| Nome | Min XB | Max XB | CA mínima | CA máxima | DB mínimo | Max BD | Min XD | Max XD |
|---|---|---|---|---|---|---|---|---|
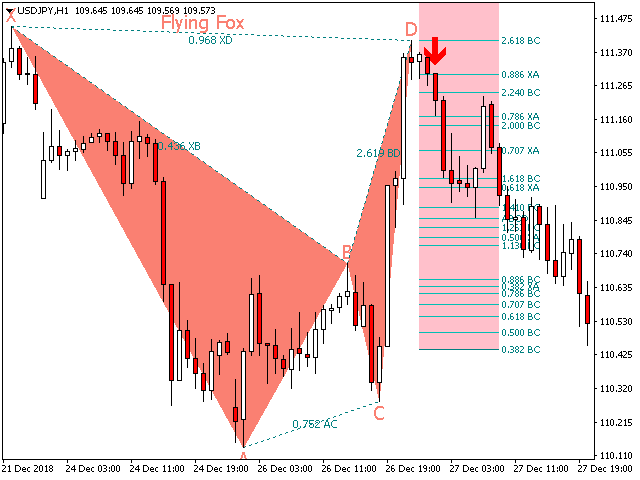
| Raposa voadora | 0,382 | 0,5 | 0,382 | 0,886 | 1.618 | 2.618 | 0,886 | 0,886 |
| Gartley | 0,618 | 0,618 | 0,382 | 0,886 | 1,272 | 1.618 | 0,786 | 0,786 |
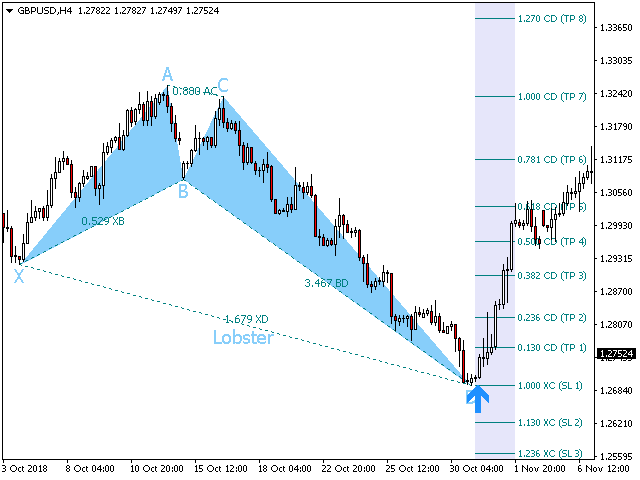
| Lagosta | 0,382 | 0,618 | 0,382 | 0,886 | 2,24 | 3.618 | 1.618 | 1.618 |
| Libélula | 0,718 | 0,718 | 0,382 | 0,886 | 1.618 | 2.618 | 1,272 | 1.618 |
| Cifra | 0,382 | 0,618 | 1,13 | 1.414 | 1,272 | 2.0 | 0,786 | 0,786 |
| Barracuda | - | - | 1,13 | 1.618 | 1.618 | 2,24 | 0,886 | 1,13 |
| Alt Flying Fox | 0,382 | 0,382 | 0,382 | 0,886 | 2.0 | 3.618 | 1,13 | 1,13 |
| Lagosta profunda | 0,886 | 0,886 | 0,382 | 0,886 | 2.618 | 3.618 | 1.618 | 1.618 |
| Cisne Branco | 1,382 | 2.618 | 0,236 | 0,5 | 1,128 | 2.0 | 1,126 | 2.618 |
| Cisne Negro | 0,382 | 0,724 | 2.0 | 4.237 | 0,5 | 0,886 | 0,382 | 0,886 |
| Max Bat | 0,382 | 0,618 | 0,382 | 0,886 | 1,272 | 2.618 | 0,886 | 0,886 |
| Max Gartley | 0,382 | 0,618 | 0,382 | 0,886 | 1,128 | 2.236 | 0,618 | 0,786 |
| Max Dragonfly | 0,618 | 0,886 | 0,382 | 0,886 | 1,272 | 2.618 | 1,272 | 1.618 |
| Alt Barracuda | 0,446 | 0,618 | 0,618 | 0,886 | 1.618 | 2.618 | 1,128 | 1,128 |
| Uma lagosta | 0,276 | 0,446 | 1,128 | 2.618 | 1.618 | 2.618 | 0,618 | 0,618 |
| Uma libélula | 0,382 | 0,618 | 1,128 | 2.618 | 1,272 | 1,272 | 0,618 | 0,786 |
| Uma raposa voadora | 0,382 | 0,618 | 1,128 | 2.618 | 2 | 2.618 | 1,128 | 1,128 |
| A Gartley | 0,618 | 0,786 | 1,128 | 2.618 | 1.618 | 1.618 | 1,272 | 1,272 |
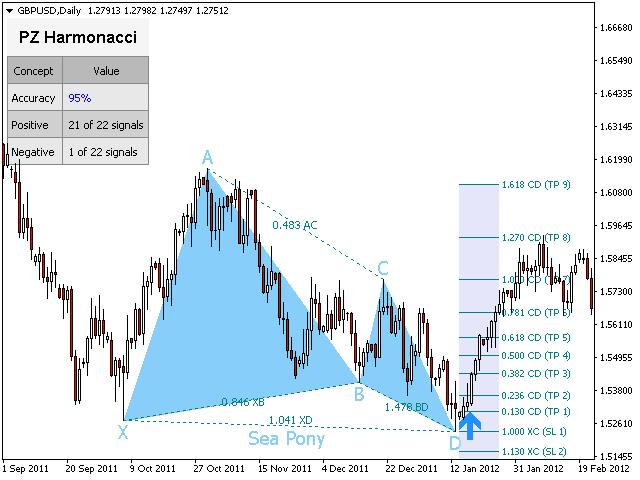
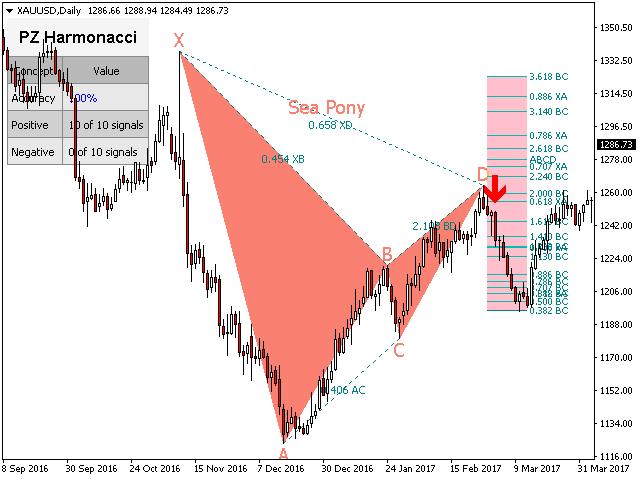
| Pônei do mar | 0,128 | 3.618 | 0,382 | 0,5 | 1.618 | 2.618 | 0,618 | 3.618 |
Parâmetros de entrada
- Amplitude - Este parâmetro controla o tamanho dos padrões encontrados no gráfico.
- Desvio - espaço de manobra algorítmica para reconhecimento de padrões. Aumente para encontrar mais padrões.
- Período de interrupção - período de interrupção donchiano para os sinais de negociação.
- Barras máximas do histórico - quantidade de barras históricas para avaliar quando o indicador é carregado.
- Exibir estatísticas - ative ou desative as estatísticas da tela de desempenho.
- Exibir pontos - Exibir rótulos de preços (rótulos X, A, B, C, D).
- Proporções de exibição - Proporções de padrão de exibição.
- Exibir projeções - Exibir a zona de reversão potencial (PRZ)
- Exibir níveis de SL / TP - exibe níveis adequados de stop loss e take-profit.
- Configurações de padrão - escolha quais padrões procurar: desative todos os que você não usa.
- Configurações de desenho - Configure as cores dos padrões de alta e baixa, bem como o tamanho da fonte.
- Proporções - ative ou desative relações e escolha suas próprias cores de proporção.
- Projeções - Exiba ou oculte as projeções de Fibonacci no gráfico.
- Breakouts - ative ou desative breakouts e defina os tamanhos e cores de setas desejados.
- Alertas - ative alertas de exibição / e-mail / push / som para interrupções, padrões ou ambos.
Autor
Arturo López Pérez, investidor privado e especulador, engenheiro de software e fundador da PZ Trading .


I actually had an issue with this software in the first place, an issue of slowing down my PC, but immediately I contacted the author, he took me hand in hand on what to adjust, and it is working fine at the moment, very accurate. You only need patience to let the harmonic software find the pattern for you. I gave five stars because the author is just there for you to assist positively and precisely. Just ask any question about your problem he will assist you to enjoy the software. Before I didn`t like trading harmonics, but this software proved me wrong and made me enjoy it at the moment.