Historical Similarity Matcher

░▒█░▒█░▀█▀░░░░▒█▀▀▀█░▀█▀░░░░▒█▀▄▀█░█▀▀▄
░▒█▀▀█░▒█░░▄▄░░▀▀▀▄▄░▒█░░▄▄░▒█▒█▒█▒█▄▄█
░▒█░▒█░▄█▄░▀▀░▒█▄▄▄█░▄█▄░▀▀░▒█░░▒█▒█░▒█


Historical Similarity Matcher Indicator (HI.SI.MA)

Try it free today — demo version now available! 👉 https://www.mql5.com/en/market/product/167114


Overview

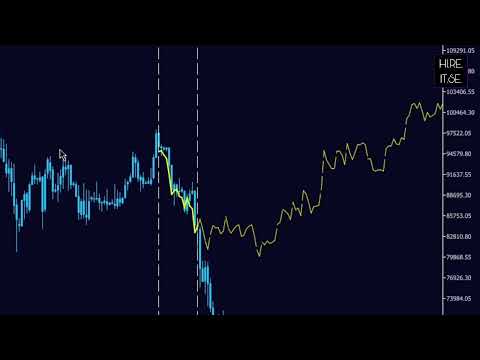
The Historical Similarity Matcher is a technical analysis indicator for MetaTrader 5. It scans historical price data to find segments that show statistical similarity to a user-selected reference period on the chart. When matches are found, the indicator displays the historical patterns and draws projections of potential future price movement based on how those historical segments continued.

This indicator is provided for educational and analytical purposes only. It does not constitute financial, investment, or trading advice. There are no guarantees of results or profitability. Past performance is not indicative of future results. Trading involves substantial risk of loss. Users are solely responsible for their own trading decisions and outcomes.
---------------------------------------------------------------------------------------------------------------------------------------------------


Features

- Identifies historical price segments with correlation to the selected reference period
- Supports direct and inverse pattern matching
- Displays multiple matching historical patterns (up to a configurable number)
- Draws individual projection lines for each match based on historical continuations
- Optional OpenCL support for faster calculation on compatible hardware (falls back to CPU if not available)
- Works on any timeframe and symbol
- Allows scanning on a different timeframe than the current chart
- Multi-Asset Mode: scans all symbols visible in the Market Watch window simultaneously, ranking matches across multiple instruments
- Provides buttons on the chart for starting the scan and exporting results
- Individual ON/OFF toggle buttons for each match, allowing selective display or hiding of specific projection lines and historical overlays
- HIDE ALL / SHOW ALL button for toggling all matches at once with a single click
- Real-time scan progress bar displayed on the SCAN button and chart comment, showing percentage completion during analysis
- Exports screenshots of each match and a CSV file with match details
---------------------------------------------------------------------------------------------------------------------------------------------------


How It Works

1. The user selects a reference period by placing two vertical lines on the chart or by setting dates in the inputs.
2. The "SCAN" button starts the analysis.
3. The indicator compares the reference period to historical segments using Pearson correlation on logarithmic returns.
4. In Multi-Asset Mode, the scan runs across all symbols in the Market Watch in addition to the current chart symbol.
5. Matches are ranked by correlation strength and filtered according to user settings.
6. For each displayed match:
   - The historical pattern is overlaid on the reference period (yellow lines).
   - A projection line is drawn forward from the current bar, scaled to current price levels.
7. Match information (date, asset symbol, and correlation) is shown on the chart.
8. During the scan, a live progress bar updates on the SCAN button (e.g. "SCAN 45%") and in the chart comment area.
---------------------------------------------------------------------------------------------------------------------------------------------------


 Input Parameters

  • Time Range Settings
    - UseAutoBars: Adjust vertical lines automatically when changing timeframe
    - init_start_date: Start date of reference period
    - init_end_date: End date of reference period

  • Match Filtering
    - MinCorrelation: Minimum correlation threshold (default: 0.1)
    - MaxCorrelation: Maximum correlation threshold (default: 1.0)
    - num_matches: Maximum number of matches to display (default: 10)
    - MinBarDistance: Minimum distance in bars between matches (default: 10)

  • Pattern Options
    - InvertIfNegative: Include inverse patterns (default: true)

  • Visualization
    - ProjectionFutureBars: Number of bars to project forward (default: 100)

    - show_match: Display overlaid historical patterns (default: true)

  • Multi-Asset Settings 
    - MultiAssetMode: When enabled, the indicator scans all symbols currently visible in the Market Watch window. The current chart symbol is always included first. Matches from different assets are pooled and ranked together by correlation. (default: true)

  • Multi-Timeframe
    - Scan_Timeframe: Timeframe used for scanning (default: current chart timeframe)
  •  Visual Settings
    - start_line_color: Color of the start vertical line
    - end_line_color: Color of the end vertical line
---------------------------------------------------------------------------------------------------------------------------------------------------


 How to Use

1. Attach the indicator to a chart.

2. Set the reference period using the vertical lines or date inputs.

3. (Optional) Enable Multi-Asset Mode to scan across all symbols in the Market Watch.

4. Click the "SCAN" button. A live progress bar will appear on the button and in the chart comment during the scan.

5. Review the displayed matches and projections.

6. Use the individual ON/OFF buttons next to each match to show or hide specific projections.

7. Use the HIDE ALL / SHOW ALL button to toggle all matches at once.

8. (Optional) Click the "CAPTURE" button to save screenshots and a CSV file to the MQL5/Files folder. When Multi-Asset Mode is active, the matched asset name is included in the filename and CSV.

---------------------------------------------------------------------------------------------------------------------------------------------------


Interpretation

Correlation values range from -1 to +1 (absolute value indicates strength):
- 0.9–1.0: Very strong similarity
- 0.7–0.9: Strong similarity
- 0.5–0.7: Moderate similarity
- 0.3–0.5: Weak similarity
- Negative values indicate inverse movement
---------------------------------------------------------------------------------------------------------------------------------------------------


Limitations

- Historical similarity does not predict future price movement.
- Markets change over time; past patterns may not repeat under current conditions.
- Unexpected events can invalidate any analysis.
- The indicator should be used together with other forms of analysis and proper risk management.
---------------------------------------------------------------------------------------------------------------------------------------------------


Technical Information

- Compatibility: MetaTrader 5 (build 3661 and later)
- Supported instruments: Any symbol
- Supported timeframes: All standard timeframe
- Version: 5.4
- Author: GEORGE
---------------------------------------------------------------------------------------------------------------------------------------------------

This indicator is intended only for personal analytical and educational use. Trading carries significant risk. Users must conduct their own research and are fully responsible for all trading decisions and outcomes.

© 2026 GEORGE. All rights reserved. For personal analytical and educational use only.
Produtos recomendados
CRT Candle Range Theory HTF MT5 - Ultimate CRT Indicator: Conceitos Avançados de ICT e Sistema de Negociação SnR Malaio Domine as pegadas dos criadores de mercado com o indicador mais avançado de Candle Range Theory. Desbloqueie o verdadeiro poder dos Smart Money Concepts (SMC) e opere com a precisão das instituições com o Ultimate CRT Indicator. Construído exclusivamente para traders sérios, este indicador automatiza a altamente eficaz Teoria CRT, um pilar central dos Conceitos ICT (Inner Circl
MercariaPattern1-2-3 відстежує рух ціни, знаходить трьоххвильові структури 1-2-3 та підсвічує момент, коли сценарій підтверджується пробоєм ключового рівня. MercariaPattern1-2-3 tracks price movement, detects three-leg 1-2-3 structures and highlights the moment when the scenario is confirmed by a key level breakout. Індикатор збирає локальні свінги в компактну фігуру 0–1–2–3 , чекає підтвердженого пробою та будує стрілку входу з готовими рівнями SL/TP. The indicator combines local swings into a
RSI Divergence Risk Target Signals RSI Divergence Risk Target Signals is a MetaTrader 5 indicator that detects confirmed bullish and bearish RSI divergence and combines the signals with optional trend filters, ATR-based Stop Loss levels, three Take Profit targets, alerts and an internal trade statistics dashboard. The indicator compares confirmed RSI pivot structure with corresponding price highs and lows. It is designed to help traders identify momentum divergence while providing a structure
[ MT4 Version ]  [ Kill Zones ]  [ SMT Divergences ] Order Blocks ICT Multi TF - FVG-Confirmed Order Blocks for MT5 Most ICT order block indicators for MT5 turn every opposite candle into an order block. The chart fills up and the label stops meaning anything. Order Blocks ICT Multi TF uses Fair Value Gap confirmation and monitors up to four timeframes from one chart. It is built for traders who want a defined reason for the block, not another coloured rectangle. GIVE THE BLOCK A REASON TO MATTE
RBreaker
Zhong Long Wu
RBreaker Gold Indicators é uma estratégia de negociação intradiária de curto prazo para futuros de ouro que combina duas abordagens: o seguimento de tendência e as reversões intradiárias. Ela permite capturar lucros durante mercados em tendência e também realizar lucros oportunamente e operar na direção oposta quando o mercado se reverte. Esta estratégia foi classificada por 15 anos consecutivos entre as dez estratégias de negociação mais lucrativas pela revista americana Futures Truth. Ela pos
Trend-Based Trading Assistant PRO  is a professional-grade Smart Money Concepts (SMC) and Price Action toolkit designed for MT5. It automates the detection of essential market structure shifts, allowing traders to identify high-probability trend reversals and continuation patterns without manual charting. By combining institutional-level logic with a powerful EMA trend filter, this indicator helps you stay on the right side of the market while avoiding "noise" and false signals. Core Features: A
TradeAQ
Guo Sheng Zhao
LuoMo Volume & Price Structure 8.98 A multi-function chart indicator for   MetaTrader 4 and MetaTrader 5 , designed to display key volume, volatility, sentiment, and price-structure information directly on the main chart. Main Features Volume and price-based Support & Resistance Volume spike and exhaustion signals ATR volatility expansion alerts Volume Profile with HVN and LVN Bullish and bearish sentiment distribution Developing or fixed POC VAH and VAL levels Supply and Demand zones Volume-wei
Meta Trend PRO MT5
Roman Podpora
5 (1)
META TREND PRO       — é uma ferramenta de acompanhamento de tendências que elimina as suposições nas negociações e mostra onde o mercado já tomou sua decisão. O indicador identifica pontos-chave onde tendências e estruturas mudam e destaca áreas onde o preço retorna para que os principais investidores assumam posições. Você não apenas vê o movimento, mas também entende a lógica por trás dele. Todos os sinais são registrados após o fechamento da vela, não são redesenhados e são salvos no gráfic
Footprint — é um indicador para análise de order flow e volume. Ele ajuda a identificar a estrutura do mercado no nível de clusters, encontrar zonas-chave com alta atividade e trabalhar com filtros diretamente no gráfico, sem a necessidade de abrir constantemente a janela de configurações. Recursos do indicador Footprint gráfico de clusters Bid x Ask, Delta; painel de controle no gráfico; controles deslizantes (sliders) para ajuste de filtros; Absorption; Initiative; Stacked Imbalances; Big Trad
HAS RSI Signal — Indicador de Tendência Profissional com Cálculo de SL/TP O HAS RSI Signal é uma ferramenta de negociação poderosa que combina clássicos comprovados com algoritmos modernos de filtragem de ruído. O indicador analisa o mercado através das velas Heiken Ashi Smoothed (HAS) e do oscilador RSI , fornecendo sinais de entrada claros em momentos de reversão de tendência ou na saída de zonas de sobrecompra/sobrevenda. Principais Vantagens: Filtragem Dupla: O uso do Heiken Ashi Smoothed pe
Engulfing with EMAs Indicator Unlock the power of advanced candlestick pattern detection with the Engulfing with EMAs Indicator , a cutting-edge tool designed for MetaTrader 5. This futuristic indicator combines the precision of engulfing pattern analysis with the trend-following strength of Exponential Moving Averages (EMA 21 and EMA 50), empowering traders to identify high-probability setups across all currency pairs and timeframes. Key Features: Comprehensive Engulfing Detection : Detects b
Delta Msnr Flex
Dely Ange Alex Dely
DELTA MSNR FLEX Intelligent MSNR Structure Analysis & Key Level Detection — MetaTrader 5 DELTA MSNR FLEX is a professional indicator designed to analyze price structure and identify important MSNR levels directly on the MetaTrader 5 chart. Its objective is simple: transform significant market reactions into clearly identifiable levels, helping traders improve their market analysis and decision-making process. AUTOMATIC & MANUAL DETECTION DELTA MSNR FLEX provides a flexible approach to market
Market Context Toolkit is a comprehensive institutional-grade visualization system designed for traders utilizing Smart Money Concepts (SMC), ICT (Inner Circle Trader), and Price Action methodologies. Unlike basic drawing tools, this proprietary system automatically identifies, categorizes, and tracks structural market references through sophisticated algorithmic analysis, saving hours of manual chart work while providing dynamic intelligence about market structure. CORE FUNCTIONALITY 1.       S
ZAB Supply Demand MTF automatically detects institutional supply and demand zones across up to 9 timeframes and draws them directly on your chart. Based on Sam Seiden's methodology, this indicator identifies the exact zones where banks and institutions placed their orders. Why This Indicator? Unlike basic support/resistance tools, ZAB Supply Demand MTF classifies every zone by its formation pattern and merges overlapping zones from different timeframes into high-probability confluence areas. Key
Smart Support And Resistance Indicator – Trade with Greater Clarity Take your technical analysis to the next level with Smart Support And Resistance Indicator for MetaTrader 5 , a powerful charting tool designed to help traders identify key market levels, analyze price action, and better understand market structure. Combining RSI-based price levels with dynamic support and resistance , this indicator brings essential technical analysis tools together in one clear and organized chart. Monitor imp
OrderFlow Supply and Demand Pro: Institutional Liquidity Engine The OrderFlow Supply and Demand Pro is a high-performance analytical engine designed to pinpoint institutional footprint on your charts. By combining algorithmic price action filters with a real-time pressure engine, this tool identifies high-probability liquidity zones where large-scale market participants are likely to re-enter the market. Core Institutional Logic Our proprietary detection system filters out market "noise" by enfo
##   ONLY GOLD ##   Тiльки Золото ## **Mercaria Professional Trading Zones - Complete Guide** ## **Mercaria Professional Trading Zones - Повний посібник** ### **How Mercaria Zones Work / Як працюють зони Mercaria** **English:** Mercaria Zones is an advanced trading indicator that identifies high-probability support and resistance areas using ZigZag extremes combined with mathematical zone calculations. The indicator works on multiple timeframes simultaneously, providing a comprehensive view
Description CAP Channel & Hull Moving Average Crossing Strategy is a powerful and smart trading indicator designed to identify high-probability market reversals and trend-based entry points . This indicator combines the strength of the CAP Channel and the Hull Moving Average (HMA) to detect price overextension and confirmation-based reversals . When price moves outside the CAP Channel and then returns inside with Hull MA confirmation, the indicator generates accurate BUY and SELL signals . Core
Aurex Fibonacci OTE Zone Smart Market Structure • Fibonacci OTE • CHoCH • Dynamic Swing Tracking Aurex Fibonacci OTE Zone is a professional MT5 chart indicator designed to help traders identify market structure, swing movements, Change of Character (CHoCH), and Fibonacci Optimal Entry (OTE) zones directly on the chart. Instead of manually drawing Fibonacci levels after every market move, the indicator automatically tracks the evolving market structure and updates the relevant Fibonacci levels as
Portuguese Este indicador funciona como um assistente avançado de análise de gráficos para traders que adoram operar com Padrões Gráficos. Ele foi projetado para reduzir a carga de análise visual e aumentar a precisão na obtenção de lucros. Principais características deste indicador do ponto de vista do uso prático: 1. Detecção Automática de Padrões (Automated Pattern Detection) Economiza tempo e reduz viés: Você não precisa desenhar linhas de tendência manualmente. O indicador buscará oscilaçõe
CosmiCLab SMC FIBO CosmiCLab SMC FIBO is a professional trading indicator designed for traders who use Smart Money Concepts (SMC), market structure analysis and Fibonacci retracement levels. The indicator automatically detects market swings and builds Fibonacci levels based on the latest impulse movement. It also identifies market structure changes such as BOS (Break of Structure) and CHOCH (Change of Character), helping traders understand the current market direction. CosmiCLab SMC FIBO also pr
Reversal Master for MT5 Reversal Master for MT5 is a non‑repainting reversal indicator for MetaTrader 5. It helps you detect potential market reversal points and shows the maximum favourable price movement after each historical signal, so you can better understand how price behaved after similar situations in the past. The MT5 version keeps the familiar reversal‑signal logic of the original Reversal Master for MT4, but adds improved visualisation, historical statistics and a points summary panel
Swing Failure Hunter
Shingidzano Lesetedi
SFP Hunter — Swing Failure Pattern SFP Hunter is a MetaTrader 5 indicator that automatically detects Swing Failure Patterns (SFP) on any symbol and timeframe. The indicator identifies single-candle stop-hunt reversals where price wicks beyond a prior swing high or low and closes back inside on the same candle, signalling a potential reversal from that level. How the Pattern Works A Swing Failure Pattern occurs when price briefly breaches a prior swing high or swing low — triggering the stop orde
ZigZag SMC Premium MT5
Kallebe Lins De Oliveira Santos
Se você busca precisão na identificação de topos e fundos estratégicos, o Indicador ZigZag SMC/SMT para MT5 é a ferramenta que irá contribuir para sua análise técnica. Desenvolvido com base nos conceitos avançados de Smart Money Concepts (SMC) e Smart Money Trap (SMT), ele oferece uma visão do comportamento do mercado, ajudando você a tomar decisões. O que você encontrará nesse indicador? Identificação Automática de topos e fundos estratégicos; Baseado em estratégias institucionais; Ideal p
GTC The Stocks Radar
Alberto Garcia Puras
ENGLISH Title: GTC The Stocks Radar GTC The Stocks Radar is built for two games: trading stocks against their index, and trading altcoins against Bitcoin. It ranks the 12 leading components of a market by their real strength relative to the benchmark — the Nasdaq-100, S&P 500, Dow, DAX, IBEX, Nikkei… or Bitcoin for the crypto universe. In one clean oscillator you see who is leading the move and who is lagging, so you can side with strength and fade weakness instead of guessing. Rotation,
Este é sem dúvida o indicador de reconhecimento automático de formação de preço harmônico mais completo que você pode encontrar para a MetaTrader Platform. Ele detecta 19 padrões diferentes, leva as projeções de Fibonacci tão a sério quanto você, exibe a Zona de Reversão Potencial (PRZ) e encontra níveis adequados de stop loss e take-profit. [ Guia de instalação | Guia de atualização | Solução de problemas | FAQ | Todos os produtos ] Detecta 19 formações harmônicas de preços diferentes Traça
Gioteen Volatility Index (GVI) - your ultimate solution to overcoming market unpredictability and maximizing trading opportunities. This revolutionary indicator helps you in lowering your losing trades due to choppy market movements. The GVI is designed to measure market volatility, providing you with valuable insights to identify the most favorable trading prospects. Its intuitive interface consists of a dynamic red line representing the volatility index, accompanied by blue line that indicate
PatternScope — Multi-Pattern Recognition for MT5 PatternScope is a multi-pattern recognition indicator for MetaTrader 5. It scans price action for classic chart patterns, confirms breakouts, and draws clear   Entry, Stop Loss and Take Profit   levels. A compact dashboard shows the latest pattern, bias and Risk:Reward. Patterns:   Double Top/Bottom, Triple Top/Bottom, Head and Shoulders (and inverted), Bullish & Bearish Flag, Pennant, Rising & Falling Wedge, Triangle, Rectangle, Cup and Handle —
AutoTrend Pro
Aram Hussein Mohammed
TL Method — Automatic Trendline Detection & Strength Indicator Tired of drawing trendlines manually? TL Method does it for you — automatically detecting, drawing, and scoring trendlines in real time. What it does: Scans up to 1000 bars to find valid support and resistance trendlines Scores each trendline by counting confirmed anchor touches Generates buy/sell signal arrows when price approaches strong trendlines Alerts you via popup, push notification, or sound — with smart cooldown to avoid spa
Renko Plus
Eadvisors Software Inc.
Com o Renko Plus você consegue utilizar os recursos na funcionalidade Indicador, basta adicioná-lo ao gráfico do Metatrader5.             O gráfico Renko é um tipo de gráfico, desenvolvido pelos japoneses, que é construído usando o movimento de preços em vez de preços e intervalos de tempo padronizados, como a maioria dos gráficos. Acredita-se que tenha o nome da palavra japonesa para tijolos, "renga", já que o gráfico se parece com uma série de tijolos.             Um novo tijolo
Os compradores deste produto também adquirem
Boba Analysis Suite
Trade Ready Solutions LLC
5 (1)
Boba Analysis Suite O Boba Analysis Suite é um indicador de análise para o MetaTrader 5. Reúne a estrutura do mercado, as zonas de preço relevantes e o contexto geral do mercado numa única visualização do gráfico. Desenvolvido a partir da experiência prática como trader e formador de traders, apoia um processo de análise estruturado: avaliar a direção do mercado, identificar níveis importantes e analisar vários períodos gráficos em conjunto. Análise em contexto O significado de cada sinal depend
ARIPoint
Temirlan Kdyrkhan
1 (4)
ARIPoint is a powerful trading companion designed to generate high-probability entry signals with dynamic TP/SL/DP levels based on volatility. Built-in performance tracking shows win/loss stats, PP1/PP2 hits, and success rates all updated live. Key Features: Buy/Sell signals with adaptive volatility bands Real-time TP/SL/DP levels based on ATR Built-in MA Filter with optional ATR/StdDev volatility Performance stats panel (Success, Profit/Loss, PP1/PP2) Alerts via popup, sound, push, or email Cu
ARICoins
Temirlan Kdyrkhan
ARICoin is a powerful trading companion designed to generate high-probability entry signals with dynamic TP/SL/DP levels based on volatility. Built-in performance tracking shows win/loss stats, PP1/PP2 hits, and success rates all updated live. Key Features: Buy/Sell signals with adaptive volatility bands Real-time TP/SL/DP levels based on ATR Built-in MA Filter with optional ATR/StdDev volatility Performance stats panel (Success, Profit/Loss, PP1/PP2) Alerts via popup, sound, push, or email Cust
Meravith Scanner
Ivan Stefanov
5 (3)
O MERAVITH SCANNER é um indicador profissional de mercados financeiros para MetaTrader 5 que consolida várias ferramentas analíticas em um único sistema integrado. Ele realiza todos os cálculos automaticamente usando uma metodologia proprietária de preço médio ponderado por volume (VWAP), eliminando completamente a interpretação subjetiva. O indicador funciona em todas as classes de ativos (Forex, Ações, Índices, Commodities, Criptomoedas) e em todos os prazos, de M1 a Mensal. O princípio fundam
TrendMaestro5
Stefano Frisetti
note: this indicator is for METATRADER4, if you want the version for METATRADER5 this is the link:  https://www.mql5.com/it/market/product/108106 TRENDMAESTRO ver 2.5 TRENDMAESTRO recognizes a new TREND from the start, he never makes mistakes. The certainty of identifying a new TREND is priceless. DESCRIPTION TRENDMAESTRO identifies a new TREND in the bud, this indicator examines the volatility, volumes and momentum to identify the moment in which there is an explosion of one or more of these da
Meravith MT5
Ivan Stefanov
5 (3)
MERAVITH é um indicador multitemporal de volume e liquidez para MetaTrader 5 que mostra a tendência, as zonas de suporte e resistência, a entrada, os alvos e o stop loss em cada tempo gráfico. Ele dá a você um mapa completo da liquidez do mercado, uma ferramenta de liquidez no estilo dos hedge funds, e faz todos os cálculos automaticamente com um método próprio de preço médio ponderado por volume, portanto não há interpretação subjetiva. Funciona em Forex, ouro (XAUUSD), índices e cripto, em tod
Cycles Plotter
Edoardo Centorame
Cycles Plotter Indicador de Ciclos Personalizáveis com Médias Móveis e Data de Início O Cycles Plotter é um indicador técnico avançado que traça dois ciclos sinusoidais completamente personalizáveis, somente mediante input do usuário. Não gera ciclos automaticamente: todos os ciclos são calculados exclusivamente com base nos parâmetros definidos pelo usuário, oferecendo aos traders uma ferramenta visual para estudar as oscilações de preço e as potenciais mudanças de tendência, sem produzir sinai
AriX
Temirlan Kdyrkhan
1 (4)
AriX Indicator for MT5 A powerful trend-following and signal-evaluation tool AriX is a custom MT5 indicator that combines Moving Averages and ATR-based risk/reward logic to generate clear buy/sell signals. It visualizes dynamic SL/TP levels, evaluates past trade outcomes, and displays win/loss statistics in a clean on-chart panel. Key features include: Buy/Sell signals based on MA crossovers ATR-based SL/TP1/TP2/TP3 levels with visual lines and labels Signal outcome tracking with real-time stat
Veja o que o mercado está realmente fazendo.      Acompanhe as 3 fases do mercado ao vivo à sua frente (Contração, Expansão, Tendência) e faça entradas melhores no início da fase   de Tendência.      Pare de adivinhar. Comece a ler o mercado como fazem as instituições e o smart money.   Apex Market Structure Pro para MT5 é uma ferramenta de análise smart-money de precisão que elimina o ruído e mostra a verdadeira   estrutura sob cada vela: liquidez, mudanças de estrutura, zonas de acumulação e
Title:FX-AIEA Supply and Demand Zone Indicator (MT5) — Technical Overview Version: 2.51 | Platform: MetaTrader 5 Introduction Supply and demand zones are considered a core manifestation of institutional order flow, providing a more direct reflection of buying and selling pressure than traditional support/resistance levels. This indicator attempts to automate the identification of high-probability supply and demand zones using an adaptive ZigZag algorithm, reducing the subjectivity and time asso
ORB Seeker MT5
Marcela Goncalves De Oliveira
Preço especial para limitar a disponibilidade e manter a escassez do produto! Apenas $599! Após a compra, entre em contato comigo para receber o EA ORB Seeker bônus e os arquivos de configuração otimizados personalizados. Faça sessões de tratamento eficazes com confiança! O ORB Seeker MT5 é um indicador profissional de Ruptura da Faixa de Abertura (ORB) desenvolvido para traders que buscam precisão, simplicidade, flexibilidade e uma estrutura de gráfico clara. Ele traça automaticamente a faixa
Volume Arrow Signal Product Description Volume Arrow Signal is a smart trading indicator designed to help traders identify potential buy and sell opportunities using price action, volume behavior, and directional arrow signals. The indicator places clear arrows directly on the chart, making it easy to spot possible market reversals, trend continuations, and entry opportunities without spending hours analyzing charts manually. Whether you are trading Gold (XAUUSD) , Forex pairs, Indices, or Crypt
AriFocus
Temirlan Kdyrkhan
AriFocus - Non-Repainting Buy/Sell Signals AriFocus - one clear signal. AriFocus marks buy and sell signals directly on the chart and suggests a stop-loss level for each one. Every signal is confirmed on bar close and never repaints. - Buy/sell arrows, confirmed on bar close - Suggested stop-loss level for every signal - Trend band and candle coloring to show direction at a glance - 10 ready-made presets, or your own settings (14 calculation methods) - Pop-up, push and email alerts with entr
Gold Xausd Hunter
Metin Erkamoglu
5 (2)
MATADOR GOLD XAUUSD M5 Scalp Signals for MT5 MATADOR GOLD is a decision-support indicator for MetaTrader 5, designed for traders who analyze short-term Gold movement on the M5 timeframe. The indicator does not open, close, or manage trades automatically. It provides buy and sell signal guidance so the user can make their own trading decisions according to their risk plan, broker conditions, and trade management rules. Main purpose MATADOR GOLD is built to help traders avoid noisy signal flow and

Zain Gold ScalpingV5
Ahmed Gamal Abdel Nasser Mohamed
Zain Gold Scalping V5 is a technical analysis indicator for MetaTrader 5 designed for Forex and Gold markets. It provides chart-based market information, trend analysis, signal conditions, and an on-screen dashboard to help traders analyze price movement across multiple timeframes. Main Features The indicator supports multiple timeframes, including M1, M5, M15, M30, H1 and higher timeframes. It can be used with Gold (XAUUSD), Forex currency pairs, indices and other supported instruments. The in
VTrende Pro
Andrii Diachenko
5 (1)
VTrende Pro - MTF indicator for trend trading with a display panel for MT5 *** Videos can be translated into any language using subtitles (video language - Russian) Although the signals of the VTrende Pro indicator can be used as signals of a full-fledged trading system, it is recommended to use them in conjunction with the Bill Williams TS. VTrende Pro is an extended version of the VTrende indicator. Difference between Pro version and VTrende: - Time zones - Signal V - signal 1-2 waves -    S
KenKem Master Volume Profiler - Brief Introduction A Display-only volume-profile cockpit for XAUUSD, BTCUSD and other liquid symbols. Draws profile structure, multi-timeframe flow, EMA trend and study-only setup markers. Places no orders. Not a signal service.  It maps where the market has actually traded and reads recent order flow, so you can see structure and lean at a glance.  What it shows: Master and local volume profiles (POC and value-area high/low) - the price shelves that matter. A liv
Em poucas palavras Este indicador combina dois especialistas — o RSI e o MACD — num único sistema. Em vez de você olhar para dois gráficos separados e tentar adivinhar, ele toma a decisão por você: quando ambos os indicadores concordam, ele desenha uma seta (compra ou venda). O mais importante: as setas não são repintadas . Depois que aparece, fica no lugar. Você pode fazer backtesting e operar ao vivo com total confiança. O que significa "Combo" Normalmente, um trader olha para o RSI (que mede
SMC Institutional Suite v3.7 Professional Smart Money Concept Indicator for MetaTrader 5 What is New in Version 3.7 - Visual Stability Update This release focuses entirely on one goal: making every zone, label, and line on your chart rock-solid stable. There is no more flickering, no more zones disappearing on a new candle, and no more duplicate drawings. Order Block (OB) zones no longer flicker or disappear. Once drawn, they stay permanently on the chart. Equal Highs and Equal Lows (EQH / EQL)
MasterTrend
Temirlan Kdyrkhan
MasterTrend Indicator for MT5 A powerful trend-following and signal-evaluation tool MasterTrend   is a custom MT5 indicator that combines Moving Averages and ATR-based risk/reward logic to generate clear buy/sell signals. It visualizes dynamic SL/TP levels, evaluates past trade outcomes, and displays win/loss statistics in a clean on-chart panel. Key features include: Buy/Sell signals based on MA crossovers ATR-based SL/TP1/TP2/TP3 levels with visual lines and labels Signal outcome tracking wit
Volality 75 Boom crash VIX
Cristofher Robles
4.5 (2)
Volatility 75 Boom Crash VIX Pro V2 Volatility 75 Boom Crash VIX Pro V2 is a high-performance trading indicator specifically engineered for Synthetic Indices (Deriv) and Forex . This tool focuses on identifying institutional liquidity zones and generating high-accuracy, non-repainting signals based on Price Action and Fibonacci levels. Key Advantages: No Repainting: Once a signal arrow appears and the candle closes, it will never move or disappear. Institutional Liquidity Zones: Automatically ca
SMC Sweep Fvg MT5
Daniil Sleptsov
5 (1)
SMC Sweep Fvg MT5 — veja o mercado como o smart money, direto no seu gráfico Você conhece essa sensação: o preço tira o seu stop, vira e vai exatamente para onde você esperava. Você estava certo na direção. Errou só na entrada. Este indicador existe para que isso aconteça com menos frequência. Ele assume a parte mais difícil da análise — mapear o gráfico — e deixa com você o que importa: a decisão. O que você vê no gráfico Estrutura de mercado — máximos e mínimos estruturais reais com rótulo
==================================================================== SMC Pro v6.1 APEX AI — XAUUSD Gold Empire Indicador para MetaTrader 5 · Smart Money Concepts · Motor de Inteligência Preditiva ==================================================================== O SMC Pro v6.1 APEX AI é um sistema de indicador profissional baseado em Smart Money Concepts, criado exclusivamente para XAUUSD (ouro) no MetaTrader 5. Ele combina o framework completo de SMC — Order Blocks, Liquidity sweeps (varre
PrimeScalping
Temirlan Kdyrkhan
PrimeScalping is a powerful trading companion designed to generate high-probability entry signals with dynamic TP/SL/DP levels based on volatility. Built-in performance tracking shows win/loss stats, PP1/PP2 hits, and success rates — all updated live. Key Features: Buy/Sell signals with adaptive volatility bands Real-time TP/SL/DP levels based on ATR Built-in MA Filter with optional ATR/StdDev volatility Performance stats panel (Success, Profit/Loss, PP1/PP2) Alerts via popup, sound, push, or e
TraderHUD
Justino Porto Neto
5 (1)
TraderHUD v2 — Painel Completo para o Trader Profissional O TraderHUD v2 é a evolução do indicador visual mais completo para MetaTrader 5. Reúne numa única ferramenta tudo que um trader precisa ver no gráfico para tomar decisões mais conscientes: contexto temporal, força do dólar, range estatístico, níveis de pivot, velocidade de movimento e tendência macro — tudo integrado, configurável e sem poluir o gráfico. Esta versão foi construída com base no uso real em operações ao vivo, incorporando um
The Expert Advisor and the video are attached in the Discussion tab . The robot applies only one order and strictly follows the signals to evaluate the indicator efficiency. Pan PrizMA CD Phase is an option based on the Pan PrizMA indicator. Details (in Russian). Averaging by a quadric-quartic polynomial increases the smoothness of lines, adds momentum and rhythm. Extrapolation by the sinusoid function near a constant allows adjusting the delay or lead of signals. The value of the phase - wave s
Классификатор силы тренда. Показания на истории не меняет. Изменяется классификация только незакрытого бара. По идее подобен полной системе ASCTrend, сигнальный модуль которой, точнее его аппроксимация в несколько "урезанном" виде, есть в свободном доступе, а также в терминале как сигнальный индикатор SilverTrend . Точной копией системы ASCTrend не является. Работает на всех инструментах и всех временных диапазонах. Индикатор использует несколько некоррелируемых между собой алгоритмов для класси
FFx Universal Strength Meter PRO is more than a basic strength meter. Instead of limiting the calculation to price, it can be based on any of the 19 integrated strength modes + 9 timeframes. With the FFx USM, you are able to define any period for any combination of timeframes. For example, you can set the dashboard for the last 10 candles for M15-H1-H4… Full flexibility! Very easy to interpret... It gives a great idea about which currency is weak and which is strong, so you can find the best pai
The FFx Universal MTF alerter shows on a single chart all the timeframes (M1 to Monthly) with their own status for the chosen indicator. 9 indicators mode (MACD-RSI-Stochastic-MA-ADX-Ichimoku-Candles-CCI-PSAR). Each can be applied multiple times on the same chart with different settings. Very easy to interpret. Confirm your BUY entries when most of the timeframes are showing green color. And confirm your SELL entries when most of the timeframes are showing red color. 2 Alert Options : input to s
The FFx Watcher PRO is a dashboard displaying on a single chart the current direction of up to 15 standard indicators and up to 21 timeframes. It has 2 different modes: Watcher mode: Multi Indicators User is able to select up to 15 indicators to be displayed User is able to select up to 21 timeframes to be displayed Watcher mode: Multi Pairs User is able to select any number of pairs/symbols User is able to select up to 21 timeframes to be displayed This mode uses one of the standard indicators
Mais do autor
Historical Similarity Matcher — DEMO (HI.SI.MA) This is the free demo version of the Historical Similarity Matcher (HI.SI.MA) indicator for MetaTrader 5. FOR FULL VERSION CLICK HERE:   https://www.mql5.com/en/market/product/164695 HI.SI.MA is a powerful technical analysis tool that scans historical price data to find segments statistically similar to a user-selected reference period on the chart. Once matches are found, the indicator overlays the historical patterns and draws forward projections
FREE
Meta Shooter
Giorgi Samkharadze
️ META SHOOTER MT5 – Defeat Trading Stress Before It Defeats Your Deposit. Exhausted by endless market waiting and staring at charts? It's time to turn your trading terminal into a powerful source of stress relief and adrenaline! META SHOOTER is a full-featured, dynamic Survival Shooter that runs directly on your MetaTrader 5 chart . It is the ultimate tool for traders to manage emotions and conquer stress. Why META SHOOTER is Your Best Anti-Stress Weapon: Instant Psychological Relief: Trad
FREE
Filtro:
Sem comentários
Responder ao comentário