Conheça o Mercado MQL5 no YouTube, assista aos vídeos tutoriais
Como comprar um robô de negociação ou indicador?
Execute seu EA na
hospedagem virtual
hospedagem virtual
Teste indicadores/robôs de negociação antes de comprá-los
Quer ganhar dinheiro no Mercado?
Como apresentar um produto para o consumidor final?
Indicadores Técnicos para MetaTrader 5 - 26
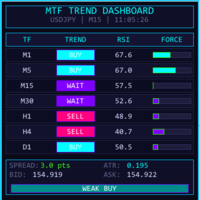
MTF TREND DASHBOARD - Analisador de Tendências Multi-Timeframe Um painel visual poderoso que exibe a direção da tendência em 7 timeframes simultaneamente (M1, M5, M15, M30, H1, H4, D1). === PRINCIPAIS RECURSOS === Detecção de tendência em tempo real usando cruzamento de EMAs Valores de RSI com cores de sobrecompra/sobrevenda Barras dinâmicas de força da tendência Sinal de viés de mercado (Strong Buy/Sell, Bias, Weak, Neutral) Exibição ao vivo de Spread, ATR, Bid/Ask Tema escuro moderno com cores
As the suggested, with this indicator you are able to switch from one symbol or timeframe to another in the same single chart. So forget about opening tons of chart on your screen! It's not designed for ICT or SMC trader, but if you are that kind of trader you still can use it. Imagine you have a strategy containing various indicators and settings, on a single chart you can screen the entry opportunity then move to the next symbol or timeframe.
FREE

Relative Volume or RVOL is an indicator that averages the volume of X amount of days, making it easy to compare sessions volumes.
The histogram only has 3 colors:
Green - Above average volume
Yellow - Average volume
Red - Below average volume
The default setting is 20 days, which corresponds more or less to a month of trading.
In this version is possible to choose between tick and real volumes (if you are using a broker which offers future contracts)
With the data obtained from this in
FREE

CCI VISUAL ENHANCED - MT5 USER GUIDE INTRODUCTION CCI Visual Enhanced for MetaTrader 5 features: Intuitive visual interface Automatic buy/sell signals Smart alert system Dynamic histogram Strong signal & divergence detection INSTALLATION Method 1: MetaEditor (Recommended) Open MT5 → Press F4 (MetaEditor) File → New → Custom Indicator Program Name: CCI_Visual_Enhanced → Finish Delete sample code, paste .mq5 code Press F7 to compile Add to chart: Insert → Indicators → Custom
FREE
Engulfing Pattern is a free indicator available for MT4/MT5 platforms, its work is to provide "alerts" when a "Bullish" or "Bearish engulfing pattern forms on the timeframe. This indicator comes with alerts options mentioned in the parameter section below. Join our MQL5 group , where we share important news and updates. You are also welcome to join our private channel as well, contact me for the private link. Engulfing Pattern Indicator MT4 Other Products Try our Martini EA with 2 years of liv
FREE

If you like this product, please give it a 5 star rating as a token of appreciation.
This indicator draws vertical lines marking key Forex trading sessions (Asian, London, New York) for a configurable number of past days. These “Silver Bullet” lines help traders quickly visualize session start and end times on the chart.
DaysToDisplay: How many previous days’ session lines to show. Session colors: Customizable line colors for each session. Session start hours: Local server hours for each sessi
FREE

Introduction to the Candle Time Indicator The Candle Time Indicator for MetaTrader 5, helps users know how much time on a candlestick is remaining.
Overview of Candle Time Indicator settings. TextColor: set the color of the countdown clock; FontSize: set the size of the font; Installation Guide Copy and paste the CandleTime.ex5 indicator files into the MQL5 folder of the Metatrader 5 trading platform. You can gain access to this folder by clicking the top menu options, that goes as follows: Fil
FREE

MaRSI Scalper & Trader The combination of moving averages and RSI This setting is flexible so it can be set with regards to user test uses 1. For scalping 2. For long time trading
features 1. Sends push notifications 2. Sends alerts on computers 3. Draws Arrows 4. Draws respective indicators (this feature will be edited in the future)
Have feedback https://t.me/Tz_Trade_Logics or just call +255766988200 (telegram/whatsApp) Head to discussion page to leave your comments Improvement are on the
FREE

This indicator is based on Bollinger Bands and moving averages, and uses ADX to get the turning point of the market trend and display a sign.
It is basically intended for use with currency pairs and futures with high volatility. In our tests we use it on XAUUSD, 5m and 15m. Win rate is more than 80% with 50 pips stop loss and 50 pips gain or more.
The indicator is also a simple indicator that allows you to enable or disable alerts and change the color of the arrows from the indicator settings
FREE
TripleWave Signal Indicator - Sistema de Confirmação de Tendência em Múltiplos Prazos Nunca mais perca uma negociação de alta probabilidade! O TripleWave Signal Indicator é um sistema de nível profissional que analisa três prazos simultaneamente (M15, H1, H4) para fornecer apenas os sinais de BUY e SELL mais confiáveis. Configurações Recomendadas: XAUUSD: As configurações padrão estão ok por enquanto. O que você recebe: Mecanismo de análise de tendência em múltiplos prazos. Setas visuais BUY/SEL
FREE

Product: Phantom Shadow Reversal Engine Version: 3.0 (Elite Edition) Developer: Trade With Thangam
THE ULTIMATE SCALPING TOOL FOR XAUUSD & MAJOR PAIRS
The Phantom Shadow Reversal Engine is not just another indicator; it is a complete trading system designed for precision scalping and day trading.
Instead of relying on lagging signals, this system uses a "Proprietary Shadow Engine" that analyzes Market
FREE

BBMA by RWBTradeLab is a clean chart-plotting indicator for MetaTrader 5 that combines Bollinger Bands , Linear Weighted Moving Averages (LWMA) on High/Low , and an EMA on Close to help traders read market structure visually. What it plots Bollinger Bands (Upper / Basis / Lower) LWMA on Low : 5 & 10 periods LWMA on High : 5 & 10 periods EMA on Close : default 50 periods Key features Plot-only indicator (no alerts, no trade execution) Non-repainting calculations (standard indicator plotting) Opti
FREE
The Vix_Fix indicator, or "Vix Fix," is a tool designed to identify potential market bottoms. It operates on the principle of measuring extreme fear or pessimism among the crowd, which are moments when the market often has a high probability of reversing to the upside. Main Purpose: To help traders find high-probability BUY (Long) entry points by identifying when the market is "oversold." How it Works In simple terms, the Vix Fix measures the distance between the current bar's Low and the Highes
FREE
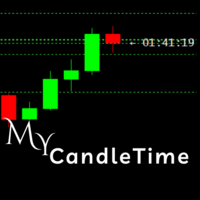
My CandleTime
This indicator displays the remaining time until the current candle closes directly on the chart.
It is designed to help traders keep track of candle formation without constantly checking the platform’s status bar. Main Features Shows countdown timer for the active candle. Works on any symbol and timeframe. Lightweight, does not overload the terminal. Adjustable font size and name. How to Use
Simply attach the indicator to a chart.
You can customize font size, color, and font to
FREE

ATR Plus is an enhanced version of the classic ATR that shows not just volatility itself, but the directional energy of the market .
The indicator converts ATR into a normalized oscillator (0–100), allowing you to clearly see: who dominates the market — buyers or sellers when a trend begins when a trend loses strength when the market shifts into a range where volatility reaches exhaustion zones ATR Plus is perfect for momentum, trend-following, breakout and volatility-based systems. How ATR Plus
FREE

En esta versión, las alertas están funcionando y en la versión que publicó, la zona muerta de atr era solo una zona muerta sin atr, por lo que también la convirtió en una zona muerta de atr.
Indicator input parameters input int Fast_MA = 20; // Period of the fast MACD moving average input int Slow_MA = 40; // Period of the slow MACD moving average input int BBPeriod=20; // Bollinger period input double BBDeviation=2.0; // Number of Bollinger deviations input int Sensetive=
FREE

The Monthly Weekly Open Line is an indicator that plots: The current month open line that will extend till the last week on the month. Weekly lines that span the look back days period that you have set . Each line will extend from the respective weekly Monday zero GMT till friday of the respective week. Monthly and Weekly open lines can be used to build very powerfull anc consistent trading strategies. They act as natural S/R price barriers.
FREE

EMA Multi Timeframe (MTF) – MT5 Indicator Description: The EMA Multi Timeframe (MTF) indicator for MT5 allows you to display an Exponential Moving Average (EMA) from a higher (or lower) timeframe directly on your current chart. Example: You can see the Daily (D1) EMA 9 plotted directly on your H1 chart, or even on an M5 chart, helping you align your entries with higher timeframe trends without switching between charts. Key Features: Display EMA from selectable timeframes (M1, M5, M15, M30, H1
FREE

O Indicador Kijun-Sen Envelope é um indicador de acompanhamento de tendência baseado na linha Kijun-Sen do sistema Ichimoku Kinko Hyo. Ele cria bandas dinâmicas ao redor do Kijun-Sen, formando um envelope que ajuda os traders a identificar tendências do mercado, possíveis reversões e condições de sobrecompra ou sobrevenda.
Principais recursos: • Confirmação de tendência – auxilia na identificação de mercados de tendência ou consolidação. • Zonas de suporte e resistência – o env
FREE

HiloPower – Indicador Avançado de Tendência e Força de Mercado para MetaTrader 5
O HiloPower não é apenas mais um indicador de tendência desenvolvido a partir do tradicional Hi-Lo. Ele foi projetado para oferecer uma leitura mais completa e inteligente do mercado, combinando direção, força e intensidade dos movimentos. Com ele, o trader pode enxergar não apenas para onde o preço está indo, mas também o quão forte e volátil esse movimento realmente é. Além de indicar a tendência com base no H
FREE

Introducing the AI Keltner Channel , a cutting-edge Forex indicator that leverages machine learning to dynamically calculate Keltner Channels in real-time. Unlike traditional Keltner Channel indicators, which rely on static inputs, the AI Keltner Channel adapts continuously to ever-changing market conditions, providing traders with a more accurate and responsive view of price trends and volatility. Powered by advanced machine learning algorithms, the AI Keltner Channel analyzes historical and re
FREE

Mudou um pouco para a velocidade. Testadores necessários para um novo consultor que esteja interessado em me enviar um e-mail 777basil@mail.ru https://backoffice.aurum.foundation/u/DHXP1U
O cálculo do indicador é baseada na alteração do preço na história e é calculado matematicamente, é recalculado a cada vez com uma nova entrada de dados. Pode ser usado em diferentes escalas de tempo. Dos limites do indicador em 70%, ocorre uma alteração de direção do movimento dos preços, ou de consolidação.
FREE

Im Sorry Ai Signal v1.26 – Precision Gold Scalping for MT5 Elevate your trading with Im Sorry Ai Signal , the latest technical indicator from the WinWiFi Robot Series . Specifically engineered for Gold (XAUUSD) scalpers on the MetaTrader 5 platform, this tool simplifies complex market movements into clear, actionable visual signals. Designed with a focus on Price Action within the M5 (5-Minute) timeframe , this indicator helps traders identify high-probability entry points in the fast-paced gol
FREE
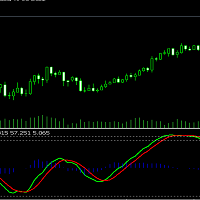
The WaveTrend (LazyBear) indicator is a momentum-based oscillator designed to identify reversal points , trend strength , and overbought/oversold conditions in the market. It is widely used in both Forex and Cryptocurrency trading due to its ability to detect turning points earlier than traditional oscillators like RSI or Stochastic.
(I have Converted from the original TradingView Pine Script version)
FREE

Finally a Metatrader version of the very popular (and expensive) Market Cipher B indicator, or the Vumanchu Cipher B + Divergences very popular on Tradingview platform.
This tool is very heavy on calculations, total are 31 plots using 97 buffers from several indicators. On my mid end computer, timeframes below M15 start getting a bit laggy, so it would require a powerful computer to run it properly at very low timeframes. It's still usable here, but somewhat sluggish response in Metatrader (lik
FREE

O indicador mostra os níveis redondos no gráfico. Eles também são chamados de níveis psicológicos , bancários ou de jogador principal. Nestes níveis, há uma verdadeira luta entre touros e ursos, o acúmulo de muitas ordens, o que leva ao aumento da volatilidade. O indicador se ajusta automaticamente a qualquer instrumento e período de tempo. Quando o nível 80 é rompido e testado, nós compramos . Quando o nível 20 é rompido e testado, nós vendemos . A meta é 00. Atenção. Dev
FREE

Fair Value Gap Sweep is a unique and powerful indicator that draws fair value gaps on your chart and alerts you when a gap has been swept by the price. A fair value gap is a price gap that occurs when the market opens at a different level than the previous close, creating an imbalance between buyers and sellers. A gap sweep is when the price moves back to fill the gap, indicating a change in market sentiment and a potential trading opportunity.
Fair Value Gap Sweep indicator has the following
FREE
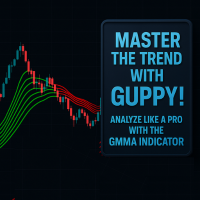
This is a custom Guppy-style Moving Average indicator built for MetaTrader 5 (MT5), designed to replicate the appearance and logic of the popular TradingView version. Unlike the built-in tools in MT5, this indicator offers a simplified yet powerful approach by using only 6 Exponential Moving Averages (EMAs). It provides clean visualization and accurate market layering to help traders make better decisions. Features
TradingView-Style Guppy Logic – Displays 6 EMAs for combined short- and medium-
FREE
O Indicador Flower é uma ferramenta de análise técnica utilizada principalmente para identificar tendências e auxiliar em estratégias de scalping ou negociação intradiária.
O Indicador Flower é um indicador de tendência de sinal baseado em análises técnicas e de dinâmica de preços. Sinaliza visualmente tendências usando flores coloridas - as flores azuis indicam uma tendência de alta, enquanto as flores vermelhas indicam uma tendência de baixa
Cada nível pode funcionar como suporte e resistên
FREE

SMC Trend Momentum Signal Line
SMC Trend Momentum Signal Line is an MT5 indicator that draws a smoothed on-chart line and colors it in real time: lime for positive momentum, tomato for negative, derived from the “SMC Trend Momentum” subwindow oscillator. This gives you immediate momentum direction directly in the main chart. Note: You must purchase the “SMC Trend Momentum” to see the line. The SMC Trend Momentum Signal Line is and will remain free of charge for you. Key Features Colored On-Char
FREE
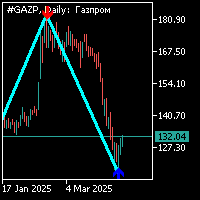
O indicador zig-zag é padrão com um período de 34 com um sinal adicional na forma de uma seta. O sinal adicional é calculado separadamente do indicador zig-zag.O trabalho sobre este indicador ocorre da seguinte forma: 1. ao formar um segmento do indicador zig-zag e aparecer um sinal adicional na forma de uma seta, você precisa abrir uma posição na direção da seta; 2. ao formar outro braço do indicador zig-zag na direção oposta do sinal adicional (setas) no topo do braço anterior, é possível esta

Trend Entry Indicator Your Trading will Be easier with this indicator!!! This Indicator is Developed To make our trading life easier. Get an Arrow for Entry with Take Profit and Slop Loss marks on chart. - Indicator is Based on trend, because thats what we all want we want to follow the trend "it's our friend". - Based on Levels, price action and oscillators. - It works on all currency pairs, all indices, metals and stock. - it works on all pairs/indexes on Deriv including Boom and Crash. - Tim

O Indicador de Pressão Compradores-Vendedores exibe sentimento de mercado em múltiplos timeframes de M1 a D1. Calcula percentuais de pressão de compra e venda usando análise de momentum de médias móveis durante um período configurável. O painel visual mostra barras de progresso com força compradora em verde-azulado e domínio vendedor em vermelho, junto com valores percentuais quando significativos. Cada timeframe inclui medição de força de tendência ADX com indicadores direcionais mostrando tend
Melhore a precisão da sua negociação com o Super Woodies CCI Indicator MT5, um poderoso conjunto de múltiplos indicadores que sincroniza sinais de mais de uma dúzia de ferramentas técnicas comprovadas para configurações de alta probabilidade em forex, CFDs, criptomoedas e commodities. Inspirado nos princípios fundamentais da negociação de confluência —pioneirados nos anos 90 por especialistas como Alexander Elder no seu sistema "Triple Screen"— este indicador ganhou popularidade rapidamente entr

-Conceito de Tendência de preenchimento de pavio
Durante um evento de alta volatilidade no mercado, as velas tendem a criar pavios ao longo dos seus movimentos. Um pavio num candelabro reflecte uma rejeição no preço. A maioria das vezes, estes pavios são preenchidos porque têm um enorme volume a empurrar nessa direcção. O Wick Fill Trend examina as oportunidades centrando-se nos mercados de tendências.
Tem um painel de simulação de taxa de sucesso que exibe sinal ao vivo com ponto de entrada,

FourAverage - uma nova palavra na detecção de tendência. Com o desenvolvimento da tecnologia da informação e um grande número de participantes, os mercados financeiros estão se tornando menos passíveis de análise por Indicadores desatualizados. As ferramentas técnicas convencionais de análise, como a média móvel ou o estocástico, são incapazes de determinar a direção ou a reversão de uma tendência. Um indicador pode indicar a direção correta do preço futuro, sem alterar seus parâmetros, em um hi

O Verve AI Reversal Pro Indicator Pro é o companheiro de trading definitivo para quem exige precisão absoluta e uma compreensão inigualável da dinâmica do mercado. Aproveitando o poder da inteligência artificial de última geração, esta ferramenta sofisticada analisa continuamente a ação do preço, o volume e a volatilidade para identificar pontos de reversão de alta probabilidade antes mesmo de se formarem completamente. Ao combinar de forma fluida algoritmos avançados de machine learning com pr

KT OBV Divergence mostra as divergências regulares e ocultas formadas entre o preço e o oscilador OBV (On Balance Volume).
Recursos
Divergências assimétricas são descartadas para maior precisão e menos poluição visual. Suporta estratégias de trading para reversão de tendência e continuação de tendência. Totalmente compatível e pronto para ser integrado a um Expert Advisor. Pode ser utilizado tanto para entradas quanto para saídas. Todos os tipos de alertas do MetaTrader estão disponíveis.
O qu

O KT Volume Profile exibe os dados de acumulação de volume como um histograma no eixo Y, permitindo visualizar a atividade de negociação ao longo de determinados períodos e níveis de preço.
Ponto de Controle (POC) no Perfil de Volume
O POC representa o nível de preço com o maior volume negociado dentro do histograma do perfil de volume. Geralmente, é utilizado como suporte/resistência ou como um nível-chave onde o mercado pode fazer um reteste antes de seguir em uma direção específica.
Recurso
A divergência é um dos sinais mais importantes para indicar uma possível reversão de preço no mercado. O indicador KT Stoch Divergence identifica divergências regulares e ocultas entre o preço e o oscilador estocástico.
Limitações do KT Stoch Divergence
Usar divergência estocástica como único sinal de entrada pode ser arriscado. Nem toda divergência representa uma reversão forte. Para melhores resultados, combine com ação do preço e direção da tendência.
Recursos
Identifica divergências regul

O KT Heiken Ashi Alert exibe setas de compra e venda e gera alertas com base nas velas padrão de Heiken Ashi. É uma ferramenta essencial para traders que desejam incorporar Heiken Ashi em sua estratégia de negociação. Uma seta de compra é exibida quando o Heiken Ashi muda de estado de baixa para alta. Uma seta de venda é exibida quando o Heiken Ashi muda de estado de alta para baixa. Inclui notificações por celular, e-mail, som e alertas pop-up.
O que é exatamente o Heiken Ashi? Em japonês, "He
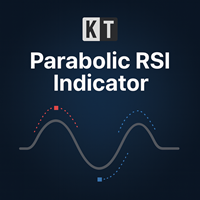
O KT Parabolic RSI sobrepõe o Parabolic SAR diretamente na linha do RSI para destacar possíveis pontos de reversão do mercado. As leituras clássicas de sobrecompra e sobrevenda do RSI já indicam potenciais mudanças, mas com o filtro adicional do PSAR grande parte do ruído é eliminada, tornando os sinais mais claros e confiáveis, oferecendo configurações de trade mais seguras. Sinais de Quadrado Grande: Uma virada do Parabolic SAR em um RSI que está em zona de sobrecompra ou sobrevenda. Estes mar
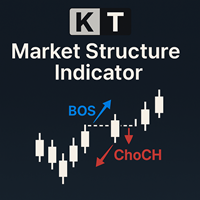
The KT Market Structure intelligently detects and displays Break of Structure (BOS) , Change of Character (CHoCH) , Equal Highs/Lows (EQL) , and various significant swing high/low points using our proprietary algorithm for accurate pattern detection. It also offers advanced pattern analysis by effectively demonstrating the captured profit for each pattern. A fully automated EA based on this indicator is available here: KT Market Structure EA MT5
Features
Accurate Pattern Detection: Our advance

Value Chart indicator presents the Price evolution in a new form. This indicator, Price Momentum , was developed taking all the calculations presented in the book " Dynamic Trading Indicators " by Mark W. Helweg and David Stendahl (2002). The technique involves de-trended Prices from a user-defined Period of analysis and the addition of a Volatility index correction. The result is an Oscillator with 3 zones: Fair Price Value, Overbought/Oversold and Extremely Overbought/Oversold zones. Adding th
FREE
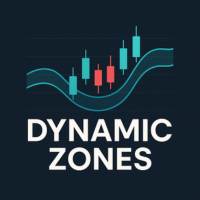
Dynamic Supply and Demand indicator automatically identifies and displays Supply and Demand Zones on your chart based on price action patterns and market structure. These zones represent areas where institutional buying or selling pressure has historically occurred, making them key levels for potential price reactions. This form of indicator takes inspiration from ICT as well as traditional Support & Resistance formation. **For the first 50 candles (number depends on LookBackCandles) when indic
FREE
O Zero Lag Least Squares Moving Average (ZLSMA) é um indicador avançado de média móvel projetado para fornecer uma análise de tendência rápida e suave sem atrasos. Baseado na Least Squares Moving Average (LSMA) , ele incorpora um cálculo de atraso zero, tornando-o altamente sensível às mudanças de preço. Esse indicador ajuda os traders a identificar a direção da tendência com mínimo atraso , sendo ideal para estratégias de curto e longo prazo.
Principais características: • Cálcul
FREE

True Days is a tool designed specifically for the trader who wants to catch intraday volatility in price charts. True day makes it easier for the trader to avoid trading in the dead zone - a period in time where markets are considered dead or non volatile. The trader can concentrate on finding opportunities only during periods of profound market movements. By default the indicator gives you a true day starting at 02:00 to 19:00 hours GMT+2. You can adjust according to your Time Zone. By deafult
FREE
Haven Fibonacci Volume Profiles — Seu Analista Automático de Faixas de Mercado Apresentando o Haven Fibonacci Volume Profiles — uma ferramenta poderosa que leva a análise de mercado para o próximo nível. Este indicador identifica automaticamente as principais faixas de preço, construídas em pontos de pivô significativos, e sobrepõe em cada uma delas um Perfil de Volume detalhado juntamente com os níveis de Fibonacci. Isso permite que os traders vejam instantaneamente onde a liquidez está concent

Documentation for connecting Metatrader 5 with Python with a simple drag and drop EA.
A full end-to-end solution ,fully tested ,fast and efficient!
The Pytrader ecosystem consists of a python script and a MT5 or MT4 version EA.
Further for the licensing an indicator is used.
The communication between the python script and the EA is based on sockets.
EA is the Server and the python script the Client .
It is always query(function / python script) and output(data / server).
T
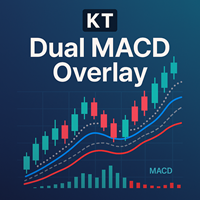
O KT Dual MACD Overlay plota dois osciladores MACD completos no próprio gráfico de preços: um referente ao timeframe atual e outro de um timeframe superior. O MACD rápido capta o impulso de curto prazo, enquanto o MACD lento mantém você alinhado à tendência mais ampla. Com ambos sobrepostos às velas, você obtém uma visão total do momentum sem alternar janelas ou chartframes.
Entradas de compra
Entrada principal: Uma linha vertical azul surge quando começa uma tendência de alta. Entradas adicion

O Indicador TRIXs é a combinação do indicador TRIX (Triple Exponential Moving Average) com adição de um sinal tipo SMA (Simple Moving Average). Fornece sinais de continuidade de tendência e inicio de uma nova tendência. Os pontos de entrada e saída de operações ocorrem quando as curvas do indicador se cruzam. Tem melhor desempenho quando combinado com outros indicadores.
FREE

If you love this indicator, please leave a positive rating and comment, it will be a source of motivation to help me create more products <3 What is Schaff Trend Cycle indicator? The Schaff Trend Cycle (STC) is a technical analysis indicator used in trading and investing to identify trends and generate trading signals. The STC is designed to identify trends and trend reversals by measuring the strength of the trend and the speed of price changes. The STC indicator helps to identify trends in a
FREE

## HiddenGapVolume Indicator Overview
**HiddenGapVolume** is a sophisticated MetaTrader 5 technical indicator designed to detect hidden market gaps and volume anomalies through statistical analysis. It combines rolling volume averages with dynamic color-coded visualization to identify potential trading opportunities.
### Core Features
- **Statistical Volume Analysis**: Calculates moving average and standard deviation bands around volume - **Dynamic Color Coding**: 6-color histogram signaling
FREE
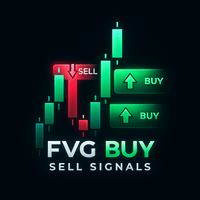
A Smart Price Imbalance Tool with Arrows, Labels, and FVG Zones The Fair Value Gap (FVG) Indicator is designed to automatically detect price imbalance zones on the chart – a widely used concept in Smart Money Concepts (SMC) and Institutional Trading Models (ICT) . These gaps, also known as imbalances or inefficiencies , often highlight areas where price may return to "rebalance" liquidity. Many professional traders consider these levels as high-probability zones for potential reversals, retrace

Para quem gosta de tendencia Force será um indicador muito útil. Isso por que ele é baseado no famoso ADX, que mede a força de uma tendencia, porém sem as 3 linhas confusas dele. Force tem sua interpretação muito simples: se o histograma estiver acima do nível zero a tendência é de alta, do contrário é queda. Você pode utilizá-lo para encontrar divergências também, algo muito lucrativo. Agradeço ao Andre Sens pela ideia da versão 1.1. Se tiver alguma dúvida ou sugestão, por favor, mecontate. Faç
FREE

Introduction
The SuperBands Indicator is a sophisticated technical analysis tool designed to provide traders with a clear visual representation of price movements within well-defined bands. This indicator is specifically engineered to filter out minor price fluctuations and market noise, offering traders a more accurate and reliable view of price trends and potential reversal points.
Signal
Buy when price breaks below the "Extremely oversold" band (darker red color) and then closes abo
FREE
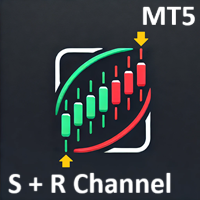
Support Resistance Channel MT5 The Support Resistance Channel MT5 indicator plots dynamic support and resistance levels based on a configurable lookback period, displaying them as green and red lines respectively. It optionally shows goldenrod-colored arrows when price touches these levels, indicating potential trend changes (not explicit buy/sell signals) , along with customizable "RES" and "SUP" labels. With adjustable parameters like lookback period, arrow size, and label offset, it offers t
FREE
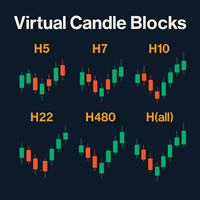
Virtual Candle Blocks – Visualize o mercado sem limites Virtual Candle Blocks é um indicador avançado para MetaTrader 5 que permite criar e visualizar candles de qualquer temporalidade personalizada, mesmo aqueles que não existem nativamente na plataforma. Características Principais: Temporalidades Personalizadas: Agrupe os candles base em blocos da duração que desejar (ex: 5h, 14h, 28h, 72h, etc.) para criar um novo candle virtual. Isso permite que você acesse temporalidades exclusivas de plat
FREE
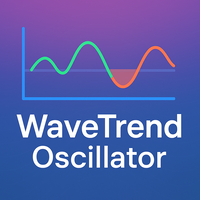
The WaveTrend Oscillator indicator is an enhanced version of the classic WaveTrend Oscillator, a momentum indicator. It is designed to identify overbought/oversold conditions and provide potential trend reversal signals. The core difference in this version is the application of a data "normalization" algorithm. This ensures the indicator's oscillation lines remain balanced around the zero line, causing the indicator window to always stay naturally centered. This is especially useful when trading
FREE
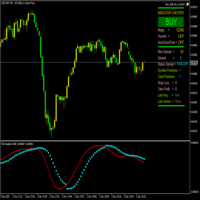
ParabolicSariTriX é um indicador híbrido que combina o oscilador de tendência TriX (Média Móvel Exponencial Tripla) com o sistema parabólico de parada e reversão (Parabolic SAR). O indicador é exibido em uma janela separada e foi projetado para identificar pontos de entrada e saída com base em sinais de reversão de tendência. Ele fornece sinais visuais claros na forma de pontos SAR, que mudam de posição em relação à linha TriX conforme a tendência do mercado se altera. Os pontos SAR são posici
FREE
SizeInPips Indicator – Visualize Candle Size with Ease!
Unlock the power of price action analysis with the SizeInPips Indicator ! This simple yet powerful tool is designed for traders who want to quickly measure and visualize the size of each candle (bar) in pips, helping you make informed trading decisions with confidence. Whether you're a beginner or an experienced trader, SizeInPips is the perfect addition to your MetaTrader 5 toolkit.
What Does It Do? The SizeInPips Indicator calculates
FREE

If you love this indicator, please leave a positive rating and comment, it will be a source of motivation to help me create more products <3 How to use SuperTrend? When the price crosses above the supertrend line it signals a buy signal and when the price crosses below the supertrend line it signals a sell signal. The supertrend indicator which acts as a dynamic level of support or resistance and helps traders make informed decisions about entry and exit points. When prices are above s upertre
FREE

UT Bot Alerts is a technical indicator for MetaTrader 5 that highlights potential directional changes based on momentum conditions.
The indicator marks signal points directly on the chart and can generate optional notifications for convenience. The signal generation logic can operate in two modes: Closed-bar mode: signals are confirmed only after the bar closes. Live-bar mode: signals are displayed during the formation of the current bar. Both modes are available depending on the user's preferr

Tenho certeza que depois de muita pesquisa na internet, você não encontrou nenhum indicador que possa ajudá-lo com operações forex ou binárias na mais recente estratégia de probabilidade criada pelo famoso trader Ronald Cutrim. A estratégia é baseada em uma simples contagem de velas verdes e vermelhas, verificando um desequilíbrio numérico entre elas ao longo de um determinado período de tempo em um gráfico de mercado de investimentos. Caso esse desequilíbrio se confirme e seja igual ou superior
FREE
The Smart FVG Statistics Indicator is a powerful MetaTrader 5 tool designed to automatically identify, track, and analyze Fair Value Gaps (FVGs) on your charts. Love it? Hate it? Let me know in a review! Feature requests and ideas for new tools are highly appreciated. :)
Try "The AUDCAD Trader":
https://www.mql5.com/en/market/product/151841
Key Features Advanced Fair Value Gap Detection Automatic Identification : Automatically scans for both bullish and bearish FVGs across specified histo
FREE

GANN TRIANGLE PRO v4.0 - OPTIMIZATION ANALYSIS REPORT CURRENT VERSION ASSESSMENT (v3.8) Strengths Feature Evaluation Swing Point Detection Clear logic using Left/Right bars Fibonacci/Gann Ratios Properly applied 61.8%, 100%, 161.8% Dashboard Real-time updates with visual indicators Code Structure Clean, maintainable architecture Critical Limitations Issue Impact Win Rate Effect No Trend Filter Signals against major trend -20% to -30% Missing Volume Confirmation False breakouts not filt
FREE

This indicator extracts a trend from a price series and forecasts its further development. Algorithm is based on modern technique of Singular Spectral Analysis ( SSA ). SSA is used for extracting the main components (trend, seasonal and wave fluctuations), smoothing and eliminating noise. It does not require the series to be stationary, as well as the information on presence of periodic components and their periods. It can be applied both for trend and for another indicators.
Features of the me
FREE

For those who love to follow Volume behavior here it is a little indicator that could be used as a replacement for the old and standard MT5 built-in volume indicator. The trick here is that this indicator paints the volume histogram based on the direction of the candle giving to the trader a quick "Heads Up" on what is happening, visually! It could be used to study and see for instance, the volume and past bars volume during (or, reaching) a peak (Tops and Bottoms). UP candles are shown in pale
FREE
Indicador de sinais para opções binárias, que também é usado de forma eficaz no Forex e em outros mercados. É adequado para operações de grid de curto prazo em M1–M5 e inclui sinais para aumento gradual das posições. A versão gratuita funciona apenas no par XAUUSD. A versão completa para MetaTrader 5 está aqui: https://www.mql5.com/en/market/product/156185 O indicador utiliza uma adaptação em dois níveis: um perfil de velocidade básico (configuração “rápido/suave” desde o início) e uma auto-adap
FREE

Highly configurable Williams %R indicator. Features: Highly customizable alert functions (at levels, crosses, direction changes via email, push, sound, popup) Multi timeframe ability Color customization (at levels, crosses, direction changes) Linear interpolation and histogram mode options Works on strategy tester in multi timeframe mode (at weekend without ticks also) Adjustable Levels Parameters:
Williams %R Timeframe: You can set the current or a higher timeframes for Williams %R. Williams
FREE
O Mercado MetaTrader é a única loja onde você pode baixar um robô demonstração de negociação gratuitamente para testes e otimização usando dados históricos.
Leia a visão geral e opiniões de outros clientes sobre os aplicativos, faça o download para o seu terminal e teste um robô de negociação antes de comprá-lo. Apenas no Mercado MetaTrader você pode testar um aplicativo de forma absolutamente gratuita.
Você está perdendo oportunidades de negociação:
- Aplicativos de negociação gratuitos
- 8 000+ sinais para cópia
- Notícias econômicas para análise dos mercados financeiros
Registro
Login
Se você não tem uma conta, por favor registre-se
Para login e uso do site MQL5.com, você deve ativar o uso de cookies.
Ative esta opção no seu navegador, caso contrário você não poderá fazer login.