ADX Dashboard MT5
- Indicadores
- Versão: 4.10
- Atualizado: 12 abril 2026
- Ativações: 10

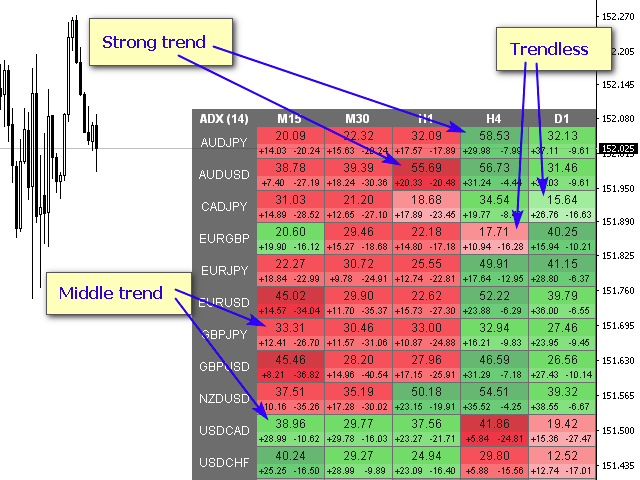
O indicador ADX é usado para determinar a tendência e sua força. A direção do preço é mostrada pelos valores +DI e -DI, e o valor ADX mostra a força da tendência. Se +DI estiver acima de -DI, então o mercado está em tendência de alta, se ao contrário, está em tendência de baixa. Se o ADX estiver abaixo de 20, não há uma direção definida. Assim que o indicador ultrapassa este nível, começa uma tendência de força média. Valores acima de 40 indicam uma tendência forte (tendência de baixa ou tendência de alta).
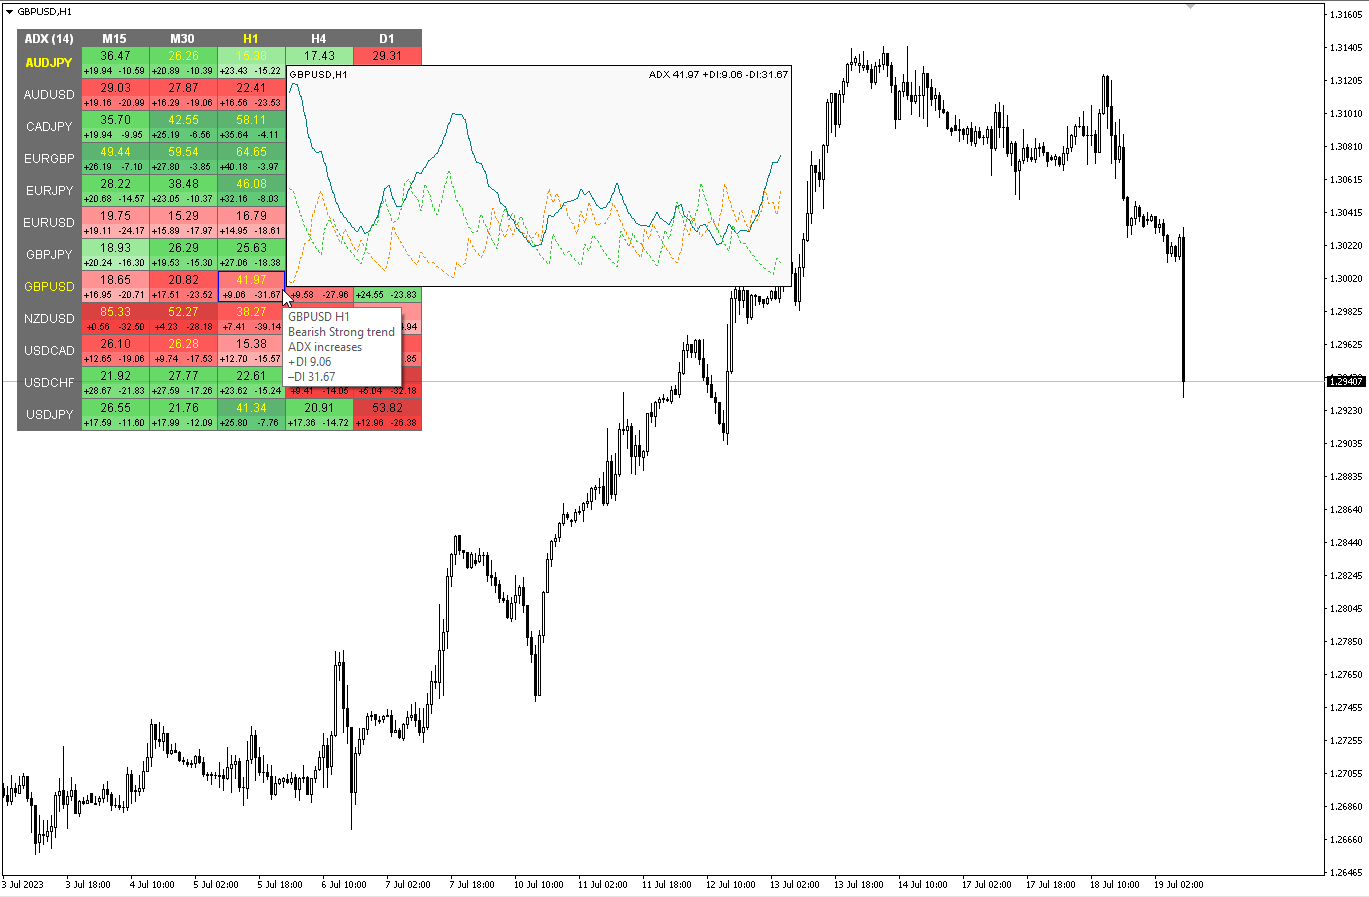
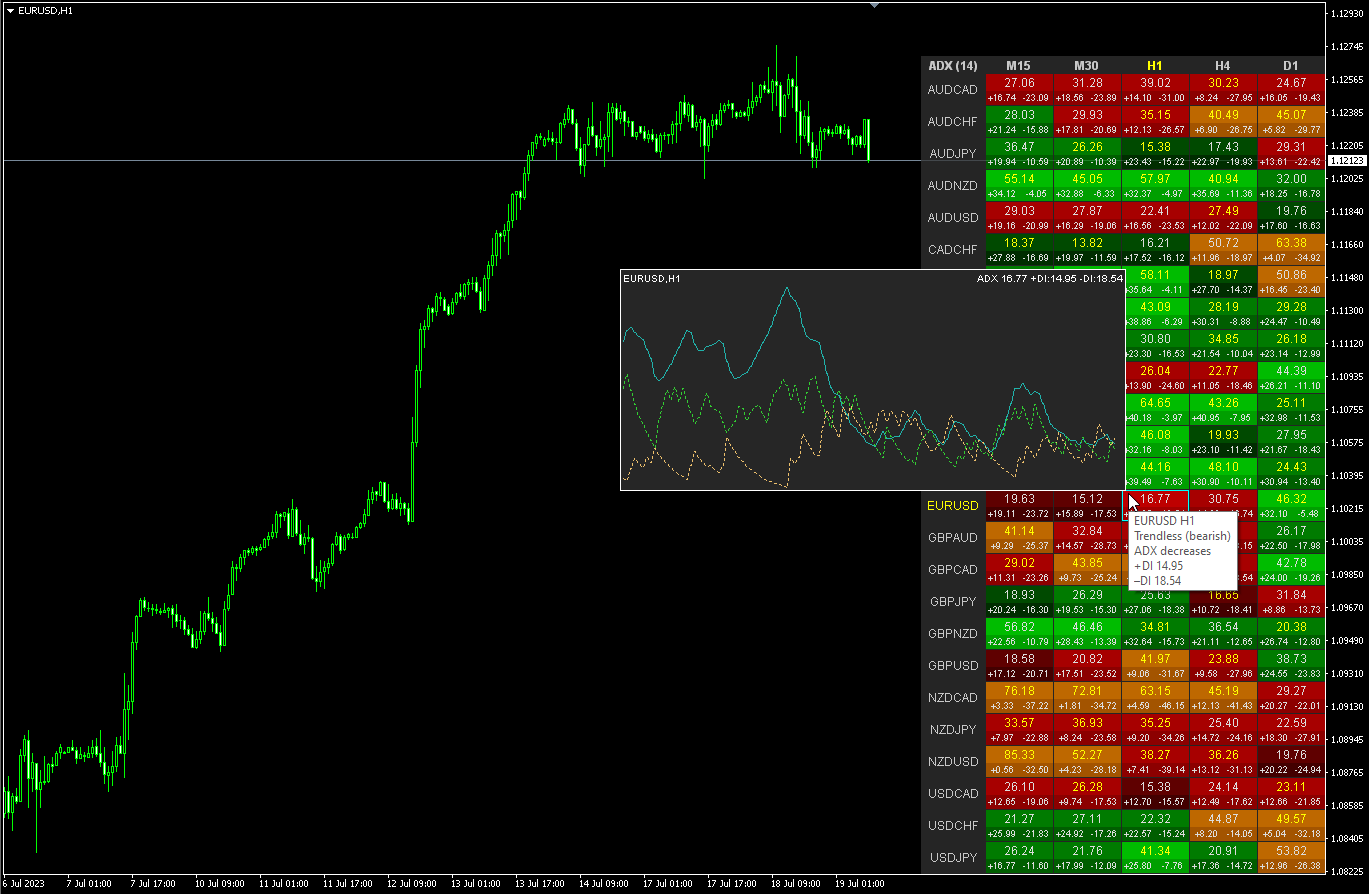
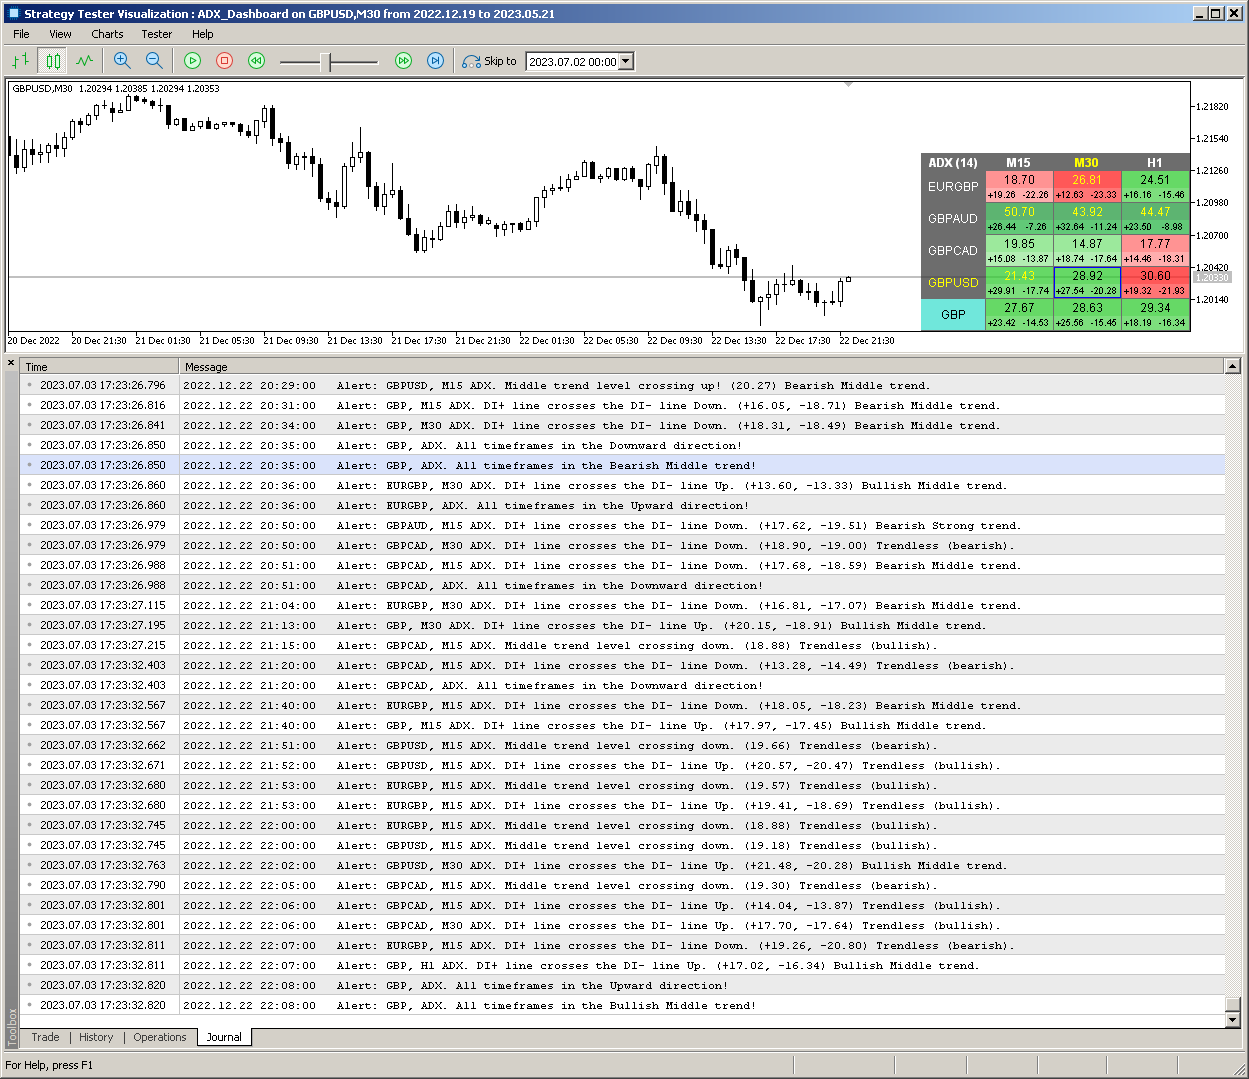
Modificação multimoeda e multitimeframe do indicador Average Directional Movement Index (ADX). Você pode especificar quaisquer moedas e prazos desejados nos parâmetros. Além disso, o indicador pode enviar notificações quando os níveis de força da tendência são cruzados e quando as linhas +DI e -DI são cruzadas. Ao clicar em uma célula com ponto final, este símbolo e ponto final serão abertos. Este é o scanner MTF.
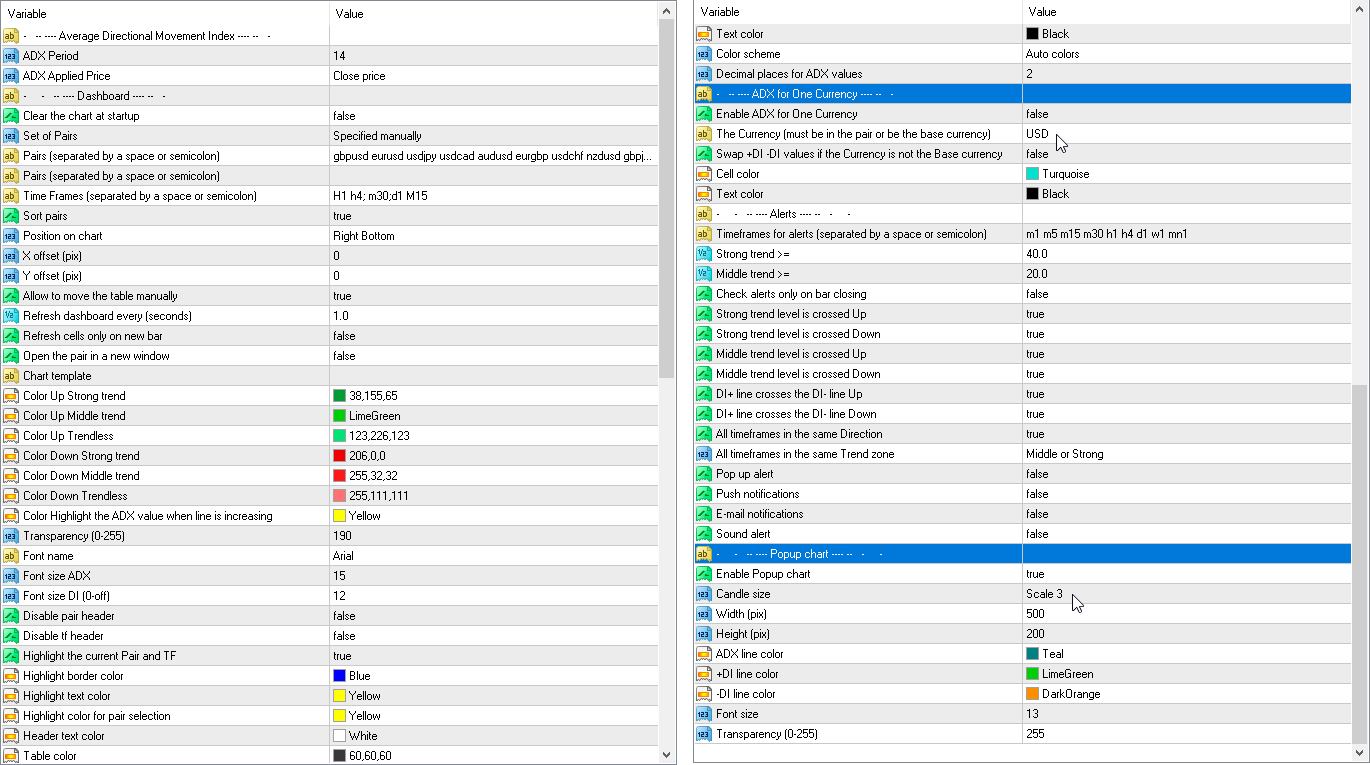
Semelhante ao Medidor de Força da Moeda, o Painel pode selecionar automaticamente pares que contenham uma moeda específica ou aqueles pares que tenham essa moeda como moeda base. O indicador procura Moeda em todos os pares especificados no “Conjunto de Pares”; outros pares são ignorados. E com base nesses pares é calculado o ADX total para esta moeda. E você pode ver quão forte ou fraca é essa moeda.
A chave para ocultar o painel do gráfico é “D” por padrão
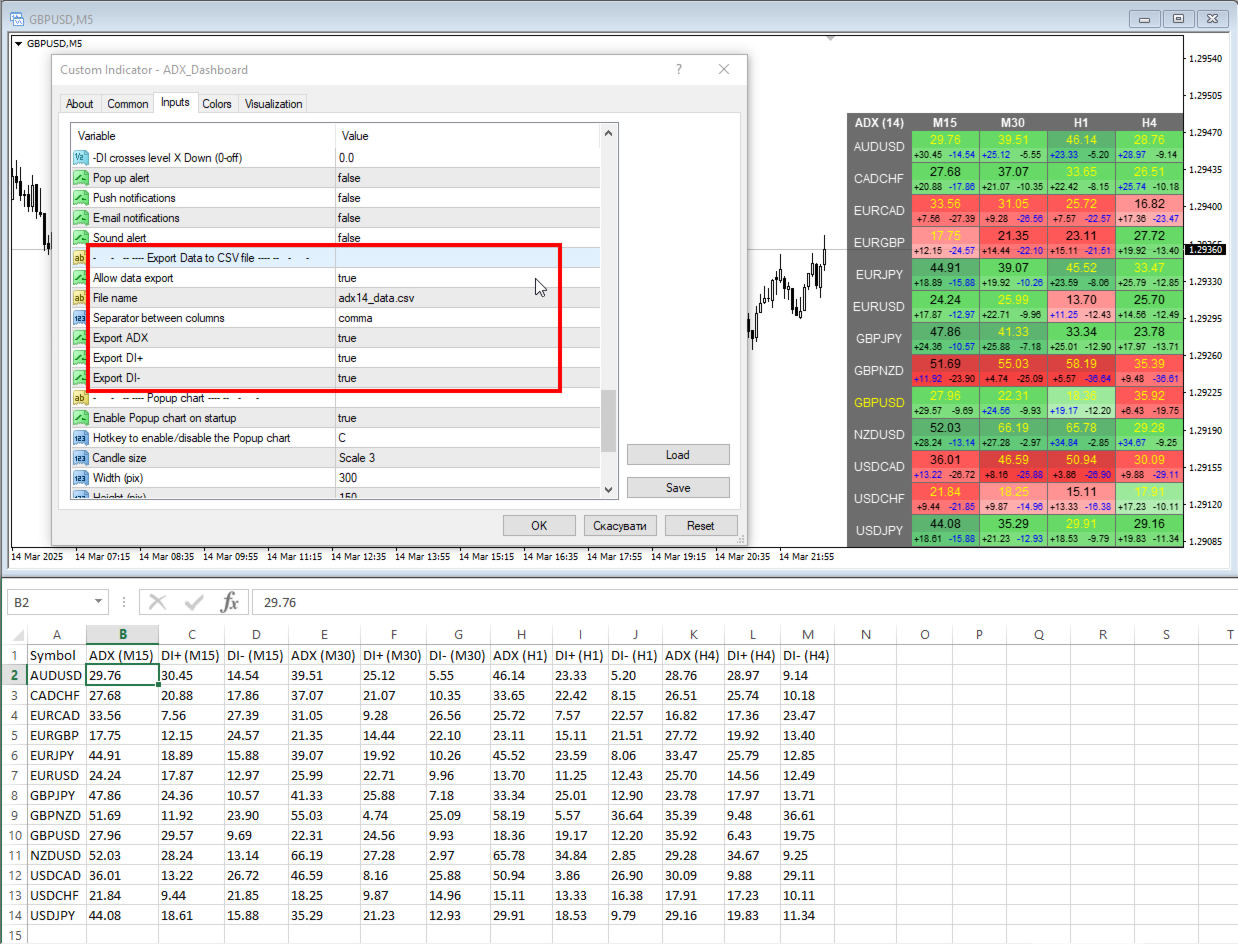
Você pode exportar dados do ADX Dashboard para um arquivo CSV. O arquivo será salvo na pasta do terminal: \MQL5\Files.
Os dados serão registrados de acordo com o timer - "Atualizar painel a cada (segundos)".
Para atualizar o arquivo salvo quando aberto no Excel, você precisa abri-lo via "Guia de dados" - "Obter dados externos do texto". Então o arquivo será atualizado pelo painel e no Excel.
Parâmetros
ADX Period — período médio.
ADX Applied Price — tipo de preço.
Clear the chart at startup — limpe o gráfico na inicialização
Set of Pairs — conjunto de símbolos:
— Market Watch — Pares do "Market Watch" do MT.— Specified manually — pares especificados manualmente, nos parâmetros "Pares".— Current pair — mostra apenas o par atual.
Pairs (separated by a space or semicolon) — lista de símbolos separados por espaço ou ponto e vírgula. Os nomes das moedas devem ser escritos exatamente como os da corretora, mantendo a caixa e o prefixo/sufixo.
Time Frames (separated by a space or semicolon) — lista de prazos separados por espaços ou ponto e vírgula (vários prazos).
Sort pairs — classificando a lista de pares.
Position on chart — canto para exibir o painel no gráfico.
X offset (pix) — desloca o painel ao longo do eixo X.
Y offset (pix) — desloca o painel ao longo do eixo Y.
Allow to move the table manually — permite mover a mesa com o mouse.
Refresh dashboard every (seconds) — período de atualização para todos os pares e intervalos de tempo.
Refresh cells only on new bar — as atualizações (e alertas) das células só ocorrerão quando uma nova barra aparecer.
Open the pair in a new window — abra um símbolo em uma nova janela do gráfico clicando.
Chart template — o nome do modelo do gráfico, se o gráfico for aberto em uma nova janela.
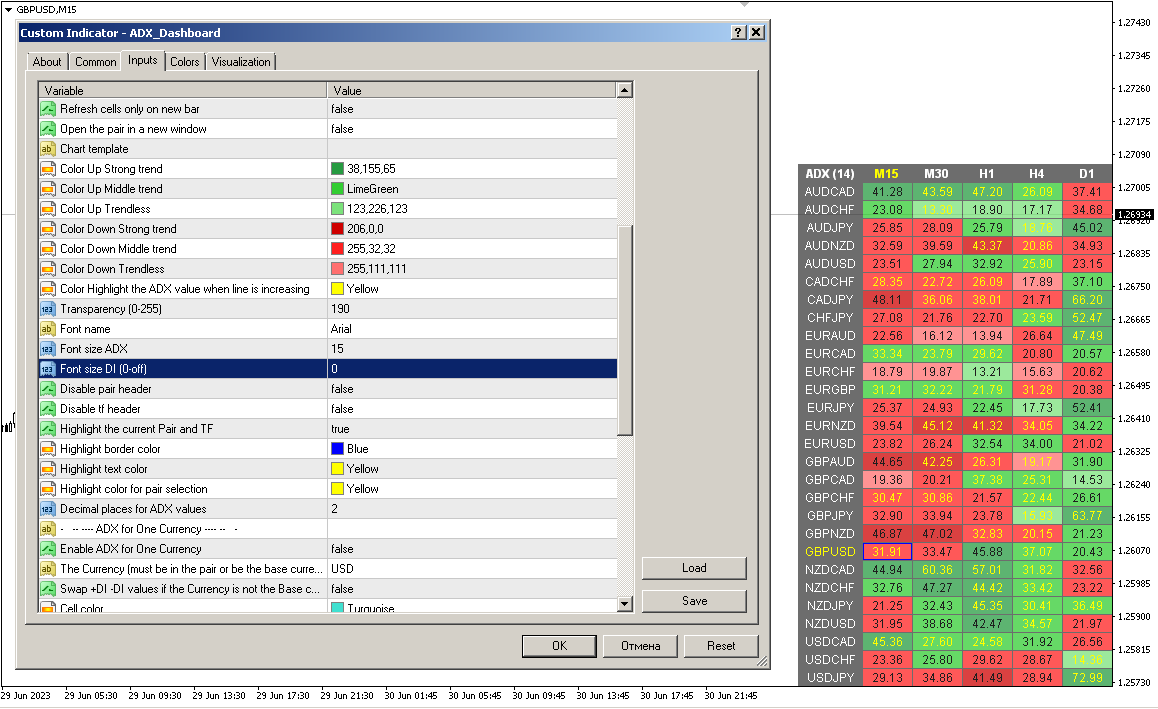
Configurações de cores
Color Up Strong trend — cor da célula se houver uma tendência forte.
Color Up Middle trend — cor da célula, se for a tendência média.
Color Up Trendless — cor da célula se não houver tendência.
Color Down Strong trend — cor da célula se houver uma tendência forte.
Color Down Middle trend — cor da célula, se for a tendência média.
Color Down Trendless — cor da célula se não houver tendência.
Transparency (0-255) — transparência do painel.
Font name - Nome da fonte.
Font size ADX - Tamanho da fonte ADX.
Font size DI (0-off) - Tamanho da fonte DI (0-off).
Alertas
Timeframes for alerts (separated by a space or semicolon) — lista de períodos para os quais o alerta será enviado (separados por espaço ou ponto e vírgula).
Strong trend >= — o nível de uma tendência forte
Middle trend >= — o nível da tendência média.
Check alerts only on bar closing – verifique a passagem de nível somente após o fechamento da barra.
Strong trend level is crossed Up — alerta quando o ADX cruza o nível de uma tendência forte para cima.
Strong trend level is crossed Down — alerta quando o ADX cruza o nível de uma tendência forte para baixo.
Middle trend level is crossed Up — alerta quando o nível da tendência média é cruzado para cima.
Middle trend level is crossed Down — alerta quando o nível da tendência média é cruzado para baixo.
DI+ line crosses the DI- line Up — alerta quando DI+ cruza DI-up.
DI+ line crosses the DI- line Down — alerta quando DI+ cruza DI- down.
All timeframes in the same direction — alerta quando todas as células mostram a mesma direção.
DI+ changes direction - DI+ muda de direção.
DI- changes direction - DI- muda de direção.
DI+ crosses level X (0-off) - DI+ cruza o nível X (0-off).
DI- crosses level X (0-off) - DI- cruza o nível X (0-off).
Pop up alert - Alerta pop-up.
Push notifications - Notificações via push.
E-mail notifications - Notificações por e-mail.
Sound alert - Alerta sonoro.
Export Data to CSV fileAllow data export
File name
Separator between columns
Export ADX
Export DI+
Export DI-
Gráfico pop-up
Enable Popup chart - Ativar gráfico pop-up
Candle size - Tamanho da vela
Width (pix) - Largura (pix)
Height (pix) - Altura (pix)
Font size - Tamanho da fonte
Transparency (0-255) - Transparência (0-255)


One of the best ADX indicator on the market place, with great support!