Auto Analysis


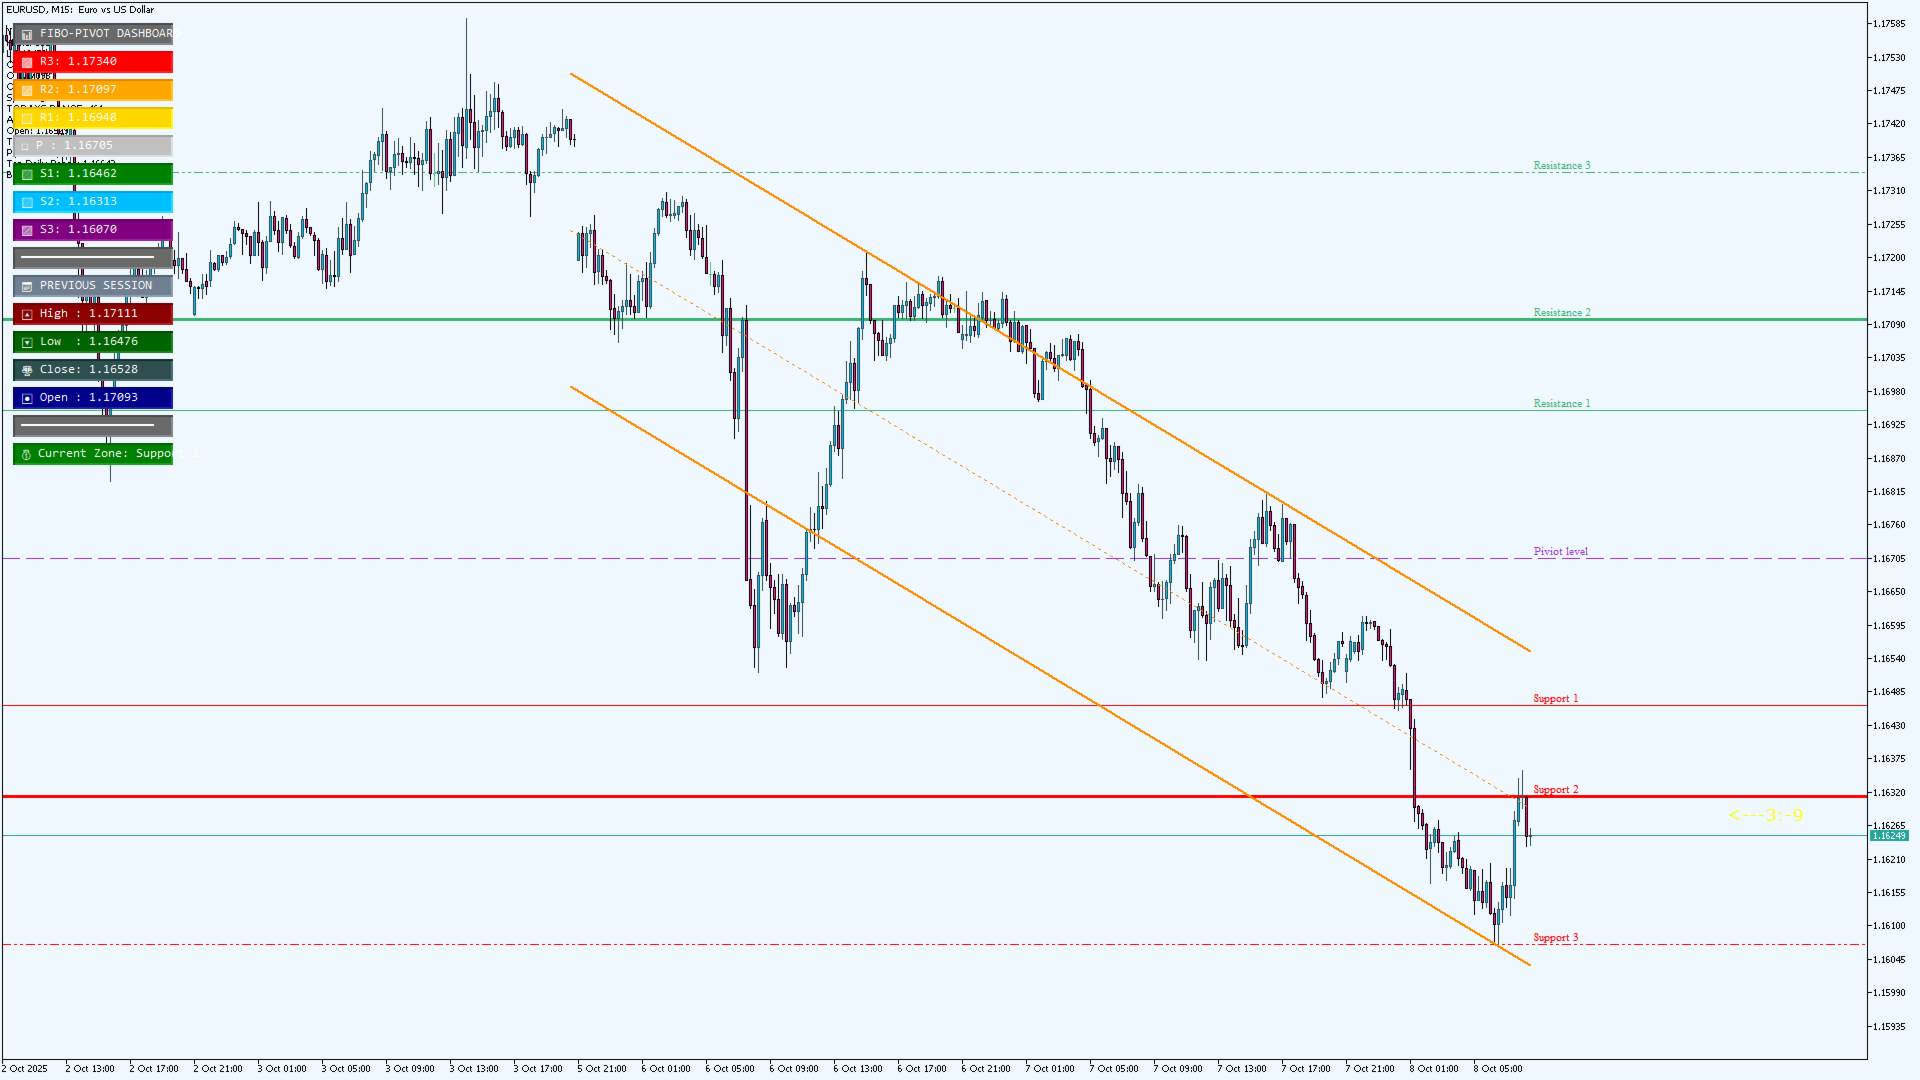
This powerful indicator combines Fibonacci pivot point analysis with automatic trend line detection, providing traders with a complete technical analysis toolkit in a single tool.

Key Features:
- 🎯 Fibonacci Pivot Points: Automatically calculates and displays R1-R3, Pivot, and S1-S3 levels using previous day's data
- 📈 Fractal-Based Trend Lines: Automatically draws channel trend lines based on fractal patterns
- 📊 Interactive Dashboard: Real-time display of pivot levels, previous session data, and current price zone
- 📅 Daily Range Statistics: Shows today's range, average daily range, and pips from open
- ⏱️ Time Remaining: Displays time left until current bar closes
- 🎨 Fully Customizable: Adjust colors, styles, widths, and dashboard appearance to match your trading style

Perfect For:
- Day traders and swing traders
- Support and resistance level identification
- Trend following strategies
- Multi-timeframe analysis
- Traders who want comprehensive market context at a glance

The indicator intelligently handles weekend gaps and works on all timeframes below D1. All objects are automatically updated with each new tick, ensuring you always have the most current analysis.

Download now to enhance your trading with professional-grade pivot and trend analysis!
Produtos recomendados
Nebulon Smart Trap AI – Advanced Liquidity Trap Analysis for MetaTrader 5 Nebulon Smart Trap AI is a professional market analysis indicator for MetaTrader 5, developed for traders who want a more structured way to identify liquidity events, false breakouts, stop-hunt reactions, demand and supply interactions, and potential reversal zones directly from price action. Modern financial markets are heavily influenced by liquidity. Price often moves beyond obvious highs and lows, attracts breakout tra
Pips on Candles shows the number of pips involved in each candle on the chart. It is possible to set 3 different ranges for counting on each single candle via the RangeType parameter: With "HighLow" you count the pips present between the minimum and the maximum. The number is shown under each candlestick on the chart. With "OpenClose" you count the pips present between the opening and closing price of the candle. The number is shown under each candlestick on the chart. With "HighDistAndLowDist"
Yawabeh SD Pro –  Professional Supply and Demand Indicator Trade Smarter with Volume-Confirmed Supply/Demand Zones Our institutional-grade algorithm identifies high-probability reversal zones before price reacts, giving you the edge in Forex, Crypto, and Stocks. Key Features Multi-Timeframe Confirmation – View trend strength across multiple timeframes simultaneously – Align your trades with higher timeframe momentum Smart Alert System – Real-time notifications for: – Strong demand/supply zone
"Hunttern harmonic pattern finder" base on the dynamic zigzag with the notification and prediction mode This version of the indicator identifies 11 harmonic patterns and predicts them in real-time before they are completely formed. It offers the ability to calculate the error rate of Zigzag patterns depending on a risk threshold. It moreover sends out a notification once the pattern is complete. The supported patterns: ABCD BAT ALT BAT BUTTERFLY GARTLEY CRAB DEEP CRAB CYPHER SHARK THREE DRIV
Fibaction
Abdelkhalek Orabi
Indicator Name: Fibaction – price action candle Detector Description: Fibo Signal Boxes is a powerful Smart Money Concept (SMC)-inspired indicator that auto-detects price action candles. bullish hammers and shooting stars, then draws precise Fibonacci entry zones and multiple take-profit levels directly on the chart. as for the SL personally i use 40 pips rules  Key Features: Detects bullish hammer and shooting star reversal candles. Automatically draws Fibonacci entry and TP boxes. as
Fibrillar
Vitalii Zakharuk
It is very easy to use the Fibrillar indicator, since the simplest is to look at the chart and act according to the indications of the colored arrows. The algorithm takes into account the measurement of prices, and this method also focuses on measuring each of the price drops (H / C, H / O, LC, LO) - which gives more detailed information, but also more averaged. When calculating this indicator, logarithmic gains are first calculated at the closing price, which allows you to filter out the tren
Higher High Lower Low MT5
KEENBASE SOFTWARE SOLUTIONS
5 (1)
KT Higher High Lower Low marca os seguintes pontos de oscilação com seus respectivos níveis de suporte e resistência: Higher High: O topo formado pelo preço que é mais alto que o topo anterior. Lower High: O topo formado pelo preço que é mais baixo que o topo anterior. Lower Low: O fundo formado pelo preço que é mais baixo que o fundo anterior.  Higher Low: O fundo formado pelo preço que é mais alto que o fundo anterior.   Recursos A intensidade dos topos e fundos pode ser ajustada alterando o
AutoTrend Pro
Aram Hussein Mohammed
TL Method — Automatic Trendline Detection & Strength Indicator Tired of drawing trendlines manually? TL Method does it for you — automatically detecting, drawing, and scoring trendlines in real time. What it does: Scans up to 1000 bars to find valid support and resistance trendlines Scores each trendline by counting confirmed anchor touches Generates buy/sell signal arrows when price approaches strong trendlines Alerts you via popup, push notification, or sound — with smart cooldown to avoid spa
IQ FX Gann Levels a precision trading indicator based on W.D. Gann’s square root methods . It plots real-time, non-repainting support and resistance levels to help traders confidently spot intraday and scalping opportunities with high accuracy. William Delbert Gann (W.D. Gann) was an exceptional market analyst, whose trading technique was based on a complex blend of mathematics, geometry, astrology, and ancient mathematics which proved to be extremely accurate. Setup & Guide:  Download  MT4 Ver
Deviation trend
VLADISLAV AKINDINOV
Indicator of trend deviation with a static level. The deviation coefficient is set for the trend histogram. Signals are the intersection of the level trend histogram in the direction of the trend or during a trend reversal - the option is selected in the indicator settings by the "Revers" parameter. There are all the necessary settings for the design of the indication and sending messages to mail or a mobile terminal. All input parameters have an intuitive name. Analog for MT4: https://www.mql5.
Overview The Market Perspective Structure Indicator is a comprehensive MetaTrader indicator designed to provide traders with a detailed analysis of market structure across multiple timeframes. It identifies and visualizes key price action elements, including swing highs and lows, Break of Structure (BOS), Change of Character (CHOCH), internal structures, equal highs/lows, premium/discount levels, previous levels from higher timeframes, and trading session zones. With extensive customization opt
KT Pin Bar MT5
KEENBASE SOFTWARE SOLUTIONS
KT Pin Bar identifies the pin bar formation which is a type of price action pattern which depicts a sign of reversal or rejection of the trend. When combined with support and resistance, BRN and other significant levels, Pin Bar pattern proved to be a very strong sign of reversal. Basically, a pin bar is characterized by a small body relative to the bar length which is closed either in upper or lower 50% part of its length. They have very large wicks and small candle body. A pin bar candlestic
This indicator scans the 1-3 Trendline pattern . The indicator is a 100 % non repaint low risk breakout system . The patterns are formed around swing high and swing lows which make them a low risk pattern with high reward. PATTERN BACKGROUND The 1-3 Trendline Breakout pattern is formed by four(4) points which are composed of three (3) primary points and the pattern neck. A trendline is always formed by the point 1 and the neck of the pattern . When price breaks out of the trendline formed , it
RevTech
Bashier Awny Husein Ismail Alhafy
Revtech MT5 Indicator brings together institutional concepts, market-structure logic, and classic price action patterns in one advanced trading tool. From Fair Value Gaps and Order Blocks to Head & Shoulders and Triangle formations, Revtech helps traders identify quality setups with clear chart visuals and execution levels. With dashboard monitoring, alerts, and timeframe-based strategy alignment, Revtech is designed to turn raw price action into a structured trading opportunity. The indicator
Indicator is best used in lower timeframes for high probability scalp entry levels. The Arrows DO NOT reprint (which is rather unique for such an indicator) and makes it a lot easier to backtest. As well as use as an entry indicator as the once you've backtested to measure the probability, it results in high confidence in the signals (as you know if it prints an arrow, it is already 100% certain the signal is valid and will not remove it on the next bar). Obviously the above statement does not m
Holiday Sales Zones Indicator The Zones Indicator is your everyday Trading tool that  leverages advanced algorithms, including ICT institutional concepts like order blocks , engulfing candle patterns , and Level interactions , to identify critical levels of supply and demand (Resistance & Support). Visual signals are generated and clearly marked on the chart, providing a straightforward guide for traders to spot key opportunities. Key Features Advanced Algorithmic Analysis : Identifies supply
Pin Bars MT5
Yury Emeliyanov
Main purpose:   "Pin Bars"   is designed to automatically detect pin bars on financial market charts. A pin bar is a candle with a characteristic body and a long tail, which can signal a trend reversal or correction. How it works:   The indicator analyzes each candle on the chart, determining the size of the body, tail and nose of the candle. When a pin bar corresponding to predefined parameters is detected, the indicator marks it on the chart with an up or down arrow, depending on the directi
FREE
Indicador Balance of Power (BOP) com suporte multi-timeframe, sinais visuais personalizáveis e sistema de alertas configurável. Serviços de programação freelance, atualizações e outros produtos TrueTL estão disponíveis no meu perfil MQL5 . Feedbacks e avaliações são muito apreciados! O que é o BOP? Balance of Power (BOP) é um oscilador que mede a força dos compradores em relação aos vendedores comparando a variação do preço com o range da vela. O indicador é calculado como (Fechamento - Abert
FREE
Candlestick Pattern Teller
Flavio Javier Jarabeck
5 (1)
Minions Labs' Candlestick Pattern Teller It shows on your chart the names of the famous Candlesticks Patterns formations as soon as they are created and confirmed. No repainting. That way beginners and also professional traders who have difficulties in visually identifying candlestick patterns will have their analysis in a much easier format. Did you know that in general there are 3 types of individuals: Visual, Auditory, and Kinesthetic? Don't be ashamed if you cannot easily recognize Candlesti
This indicator will draw patterns based on   Rob Smith's   The Strat   as they emerge in real time on your chart. As price evolves,   TheStrat   offers 18 distinct price action patterns that can help you get good entries in the market. Each pattern involves two or three candles, and this indicator will draw a bounding box around the candles and name the pattern. The indicator also shows when a potential setup is forming, known by stratters as an Actionable signal. Candles Each candle is defin
In the context of trading, Malaysia SNR (Support and Resistance) refers to the technical analysis of support and resistance levels in financial markets, particularly for stocks, indices, or other assets traded. This is single timeframe version. Multiple timeframe version is avaiable here . There are three type of Malaysia SNR level Classic , GAP and Flipped 1. Classic Support is the price level at which an asset tends to stop falling and may start to rebound. It acts as a "floor" where demand is
Histograma de Rendimento L&S Caicai Aviso Importante: Este indicador é uma ferramenta integrante do robô automatizado EA Caicai Long and Short Pair Trading . Este indicador exibe visualmente o desvio percentual (Yield %) do spread atual de um par em relação à sua própria média histórica. É excelente para visualizar rapidamente o potencial financeiro bruto de uma distorção. Principais Funcionalidades: Visualização em Percentual: Entenda facilmente o tamanho da distorção em termos percentuais. Múl
QuantumAlert Stoch Navigator is a free indicator available for MT4/MT5 platforms, its work is to provide "alerts" when the market is inside "overbought and oversold" regions in the form of "buy or sell" signals. This indicator comes with many customization options mentioned in the parameter section below, user can customise these parameters as needful. Join our   MQL5 group , where we share important news and updates. You are also welcome to join our private channel as well, contact me for the p
FREE
Order Block Tracker   is here to solve one of the biggest challenges traders face: identifying order blocks. Many traders fail to spot these critical zones, often missing out on key market entries. But with   Order Block Tracker , you no longer have to worry about that. This advanced indicator automatically highlights these crucial zones for you, giving you the confidence to enter the market at the right time. MT4 Version -  https://www.mql5.com/en/market/product/123358/ Key Features of   Order
The problem with trading candlestick patterns becomes obvious, after some experience in live markets. Hypothetical branching of candlestick patterns, are not necessary for successful trading. As a Price action trader, my principle is to keep things simple and consistent. My focus is on buying and selling pressure, which is visible in market structure. Trade Management and discipline are my secondary core elements. This indicator detect 4 Simple but Effective Price action Patterns! Yellow = Insi
Alpha Harvester
Sathit Prompanapithak
Alpha Harvester Professional XAUUSD Signal Indicator with Dynamic SL, TP & Trailing Stop Are you tired of indicators that show arrows but leave you guessing where to place your Stop Loss and Take Profit? Alpha Harvester solves this completely. Every signal comes with automatically calculated SL, TP, and a swing-based trailing stop — all drawn directly on your chart with clear price labels. No guesswork. No manual calculations. Just follow the signals. 5 SMART SIGNAL TYPES Alpha Harvester
Acesso Oficial ao Ecossistema BlueDigitsFx Receba atualizações de infraestrutura, recursos de workflow, lançamentos de produtos e acesso ao ecossistema oficial BlueDigitsFx. Ecossistema Telegram Website Versão MT4 BlueDigitsFx Spike And Strike Reversal MT5 — Oscilador Composto para Análise de Reversões de Mercado e Momentum BlueDigitsFx Spike And Strike Reversal é um oscilador composto que combina múltiplos sinais de indicadores para ajudar traders a identificar potenciais reversões de merca
Indicador Average True Range (ATR) com suporte multi-timeframe, sinais visuais personalizáveis e sistema de alertas configurável. Serviços de programação freelance, atualizações e outros produtos TrueTL estão disponíveis no meu perfil MQL5 . Feedbacks e avaliações são muito apreciados! O que é o ATR? O Average True Range (ATR), desenvolvido por J. Welles Wilder, é um indicador técnico que mede a volatilidade do mercado. Ele calcula a média do True Range durante um período especificado. O True
FREE
Confluence Scope
Brigetd Milena Mora Martinez
Confluence Scope consolidates four classic signal engines across up to nine timeframes into a single horizontal panel. It helps identify when momentum, strength and CCI alignment converge on the same direction.   FEATURES   - Four engines per timeframe: Stochastic, RSI, fast CCI entry, slow CCI trend - Nine timeframes from M1 to MN1, each independently toggleable - Per-timeframe verdict from MIXED up to four-star BUY or SELL - Adaptive panel that scales with the subwindow width - Native popup,
FREE
O indicador KT Asian Breakout analisa uma parte crítica da sessão asiática para gerar sinais de compra e venda em ambas as direções, com base na quebra de preço. Um sinal de compra ocorre quando o preço rompe acima da máxima da sessão, enquanto um sinal de venda ocorre quando o preço rompe abaixo da mínima da sessão. Coisas para lembrar Se a caixa da sessão for muito ampla verticalmente, deve-se evitar uma nova negociação, pois a maior parte da ação do preço já ocorreu dentro da sessão. Se a ve
Os compradores deste produto também adquirem
Neuro Poseidon MT5
Daria Rezueva
4.97 (34)
Neuro Poseidon is a new indicator by Daria Rezueva. It combines precise trading signals with adaptive TP/SL levels - creating best possible trades as a result! Message me and get  Neuro Poseidon Assistant  as a gift to automize your trading process! What makes it stand out? 1. Proven profitability on all assets and timeframes 2. Only confirmed BUY and SELL signals present on the chart 3. Adaptive TP & SL levels generated by the software for each trade 4. Easy to understand - suitable for al
SuperScalp Pro
Van Minh Nguyen
4.65 (26)
SuperScalp Pro – Sistema avançado de scalping com múltiplos filtros SuperScalp Pro é um indicador avançado de scalping que combina o clássico Supertrend com múltiplos filtros inteligentes de confirmação para ajudar a identificar oportunidades de trading. Funciona de forma eficiente em vários timeframes de M1 até H4, com desempenho otimizado para XAUUSD, BTCUSD e principais pares Forex. O indicador fornece sinais claros de Buy e Sell, juntamente com níveis calculados automaticamente de entrada, S
Vamos ser honestos primeiro. Nenhum indicador sozinho vai te tornar lucrativo. Se alguém te disser o contrário, está te vendendo um sonho. Qualquer indicador que mostre setas perfeitas de compra/venda pode ser feito para parecer impecável — basta dar zoom na parte certa da história e tirar um print das operações vencedoras. Nós não fazemos isso.  SMC Intraday Formula é uma ferramenta. Ela lê a estrutura do mercado para você, identifica as zonas de maior probabilidade de preço e mostra exatament
Divergence Bomber
Ihor Otkydach
4.9 (90)
Cada comprador deste indicador recebe adicionalmente, e de forma gratuita: A ferramenta exclusiva "Bomber Utility", que acompanha automaticamente cada operação, define os níveis de Stop Loss e Take Profit e fecha operações de acordo com as regras da estratégia; Arquivos de configuração (set files) para ajustar o indicador em diferentes ativos; Set files para configurar o Bomber Utility nos modos: "Risco Mínimo", "Risco Balanceado" e "Estratégia de Espera"; Um vídeo tutorial passo a passo que aju
Entry In The Zone and SMC Multi Timeframe is a real-time 2-in-1 market analysis tool that combines market structure analysis and a No Repaint BUY / SELL signal system into a single indicator, built on Smart Money Concepts (SMC) — a widely adopted framework used by professional traders to understand market structure. This indicator helps you see the market more clearly, make decisions based on structure rather than guesswork, and focus on high-probability zones where price is more likely to react
Quantum TrendPulse
Bogdan Ion Puscasu
5 (25)
Apresentando   Quantum TrendPulse   , a ferramenta de negociação definitiva que combina o poder do   SuperTrend   ,   RSI   e   Stochastic   em um indicador abrangente para maximizar seu potencial de negociação. Projetado para traders que buscam precisão e eficiência, este indicador ajuda você a identificar tendências de mercado, mudanças de momentum e pontos de entrada e saída ideais com confiança. Principais características: Integração SuperTrend:   siga facilmente a tendência predominante do
Este produto foi atualizado para o mercado de 2026 e otimizado para as versões mais recentes do MT5. AVISO DE ATUALIZAÇÃO DE PREÇO: Smart Trend Trading System está atualmente disponível por $99 . O preço aumentará para $199 após as próximas 30 compras . OFERTA ESPECIAL: Após comprar o Smart Trend Trading System, envie-me uma mensagem privada para receber o Smart Universal EA GRÁTIS e transformar seus sinais do Smart Trend em operações automatizadas. Smart Trend Trading System é um sistema de tr
M1 Quantum MT5
Hamed Dehgani
5 (1)
M1 Quantum é um sistema profissional de negociação para M1 que fornece sinais de trading rápidos e precisos, com Stop Loss, Take Profit e gerenciamento inteligente de capital integrados. M1 Quantum inclui um sistema profissional de gerenciamento de capital projetado para aumentar a conta rapidamente, com foco em vitórias consecutivas . Principais recursos do Indicador M1 Quantum Projetado para o time frame M1 e todos os principais pares de moedas Todas as operações possuem Stop Loss e Take Profi
SignalTech is an unique fully rule based trading system delivers an Institutional approach for both Independent Traders and Prop Firm Challengers. Never Repaint. Push Notification available. No over-optimization. All the winning trades with chart setups are published on the comments page. 2026-05 4107 Pips (Until 05-29 NY Closed) 2026-04 2243 Pips 2026-03 2165 Pips 2026-02 2937 Pips 2026-01 2624 Pips 2025-12 1174 Pips It can generate signals with Buy/Sell Arrows, Push Notification (To Mobile) an
Trend Catcher ind mt5
Ramil Minniakhmetov
5 (5)
INDICADOR TREND CATCHER O Indicador Trend Catcher analisa os movimentos de preços do mercado, utilizando uma combinação de indicadores de análise de tendências adaptativos, proprietários e personalizados pelo autor. Identifica a verdadeira direção do mercado, filtrando o ruído de curto prazo e focando a força do momentum subjacente, a expansão da volatilidade e o comportamento da estrutura de preços. Utiliza também uma combinação de indicadores personalizados de suavização e filtragem de tendê
PrimeScalping
Temirlan Kdyrkhan
PrimeScalping is a powerful trading companion designed to generate high-probability entry signals with dynamic TP/SL/DP levels based on volatility. Built-in performance tracking shows win/loss stats, PP1/PP2 hits, and success rates — all updated live. Key Features: Buy/Sell signals with adaptive volatility bands Real-time TP/SL/DP levels based on ATR Built-in MA Filter with optional ATR/StdDev volatility Performance stats panel (Success, Profit/Loss, PP1/PP2) Alerts via popup, sound, push, or e
Power Candles MT5
Daniel Stein
5 (8)
Power Candles V3 - Indicador de força com auto-otimização O Power Candles V3 transforma a força da moeda e do instrumento num plano de negociação prático em todos os gráficos aos quais está associado. Em vez de se limitar a colorir as velas, executa uma otimização automática em tempo real em segundo plano e apresenta-lhe os melhores valores de Stop Loss, Take Profit e limiar de sinal para o símbolo em questão. Basta um clique para o adotar na negociação em tempo real — as linhas de entrada, Stop
FX Trend MT5 NG
Daniel Stein
5 (6)
FX Trend NG: A Nova Geração de Inteligência de Tendência Multi-Mercado Visão Geral FX Trend NG é uma ferramenta profissional de análise de tendências e monitoramento de mercado em múltiplos períodos de tempo. Permite compreender a estrutura completa do mercado em segundos. Em vez de alternar entre vários gráficos, você visualiza instantaneamente quais ativos estão em tendência, onde o momentum está enfraquecendo e onde existe alinhamento forte entre diferentes timeframes. Oferta de Lançamento
O UZFX {SSS} Scalping Smart Signals MT5 é um indicador de negociação de alto desempenho que não repinta, concebido para scalpers, day traders e swing traders que exigem sinais precisos e em tempo real em mercados em rápida evolução. Desenvolvido pela (UZFX-LABS), este indicador combina a análise da ação do preço, a confirmação de tendências e a filtragem inteligente para gerar sinais de compra e venda de alta probabilidade em todos os pares de moedas e intervalos de tempo. RECOMENDO* OS MELHORE
Meridian Pro
Ottaviano De Cicco
5 (2)
Meridian Pro 2.00: Matriz profissional de tendência multi-timeframe para MT5 Meridian Pro 2.00 é uma matriz de tendência adaptativa profissional para MetaTrader 5. Combina o motor original de tendência Meridian, um ribbon limpo no gráfico, setas de sinal em barra fechada, um dashboard de 8 timeframes, Fuel momentum, consenso ponderado, processamento HTF sintético e linhas de contexto de timeframe superior diretamente no gráfico. O objetivo é simples: ler tendência atual, estrutura multi-timefram
Gann Made Easy   é um sistema de negociação Forex profissional e fácil de usar, baseado nos melhores princípios de negociação usando a teoria do sr. W. D. Gann. O indicador fornece sinais precisos de COMPRA e VENDA, incluindo níveis de Stop Loss e Take Profit. Você pode negociar mesmo em movimento usando notificações PUSH. Entre em contato comigo após a compra para receber instruções de negociação e ótimos indicadores extras gratuitamente! Provavelmente você já ouviu muitas vezes sobre os método
FX Power MT5 NG
Daniel Stein
5 (32)
FX Power: Analise a Força das Moedas para Decisões de Negociação Mais Inteligentes Visão Geral FX Power é a sua ferramenta essencial para compreender a força real das principais moedas e do ouro em quaisquer condições de mercado. Identificando moedas fortes para comprar e fracas para vender, FX Power simplifica as decisões de negociação e revela oportunidades de alta probabilidade. Quer você prefira seguir tendências ou antecipar reversões usando valores extremos de Delta, esta ferramenta adap
SmartScalping
Temirlan Kdyrkhan
SmartScalping is a powerful trading companion designed to generate high-probability entry signals with dynamic TP/SL/DP levels based on volatility. Built-in performance tracking shows win/loss stats, PP1/PP2 hits, and success rates — all updated live. Key Features: Buy/Sell signals with adaptive volatility bands Real-time TP/SL/DP levels based on ATR Built-in MA Filter with optional ATR/StdDev volatility Performance stats panel (Success, Profit/Loss, PP1/PP2) Alerts via popup, sound, push, or e
ARIPoint
Temirlan Kdyrkhan
1 (1)
ARIPoint is a powerful trading companion designed to generate high-probability entry signals with dynamic TP/SL/DP levels based on volatility. Built-in performance tracking shows win/loss stats, PP1/PP2 hits, and success rates all updated live. Key Features: Buy/Sell signals with adaptive volatility bands Real-time TP/SL/DP levels based on ATR Built-in MA Filter with optional ATR/StdDev volatility Performance stats panel (Success, Profit/Loss, PP1/PP2) Alerts via popup, sound, push, or email Cu
TrendProMaster
Temirlan Kdyrkhan
MasterTrend Indicator for MT5 A powerful trend-following and signal-evaluation tool MasterTrend   is a custom MT5 indicator that combines Moving Averages and ATR-based risk/reward logic to generate clear buy/sell signals. It visualizes dynamic SL/TP levels, evaluates past trade outcomes, and displays win/loss statistics in a clean on-chart panel. Key features include: Buy/Sell signals based on MA crossovers ATR-based SL/TP1/TP2/TP3 levels with visual lines and labels Signal outcome tracking wit
Crystal Heikin Ashi Signals
Muhammad Jawad Shabir
5 (2)
Crystal Heikin Ashi Signals - Professional Trend & Signal Detection Indicator Advanced Heikin Ashi Visualization with Intelligent Signal System for Manual & Automated Trading Final Price: $149 ---------> Price goes up $10 after every 10 sales . Limited slots available — act fast . Overview Crystal Heikin Ashi Signals is a professional-grade MetaTrader 5 indicator that combines pure Heikin Ashi candle visualization with an advanced momentum-shift detection system. Designed for both manual traders
Atomic Analyst MT5
Issam Kassas
4.26 (35)
Este produto foi atualizado para o mercado de 2026 e otimizado para as versões mais recentes do MT5. AVISO DE ATUALIZAÇÃO DE PREÇO: Atomic Analyst está atualmente disponível por $99 . O preço aumentará para $199 após as próximas 30 compras . OFERTA ESPECIAL: Após comprar o Atomic Analyst, envie-me uma mensagem privada para receber o Smart Universal EA GRÁTIS e transformar seus sinais do Atomic Analyst em operações automatizadas. Atomic Analyst é um indicador de trading de Price Action sem repa
Azimuth Pro
Ottaviano De Cicco
5 (7)
Azimuth Pro V2: Estrutura Fractal Sintética e Entradas Confirmadas para MT5 Visão geral Azimuth Pro é um indicador de estrutura swing multinível da Merkava Labs . Quatro camadas de swing aninhadas, VWAP ancorado em swings, detecção de padrões ABC, filtragem estrutural de três timeframes e entradas confirmadas em barra fechada — um gráfico, um fluxo de trabalho dos micro-swings aos macro-ciclos. Este não é um produto de sinais cegos. É um fluxo de trabalho baseado em estrutura para traders que v
ScalpPoint
Temirlan Kdyrkhan
ScalpPoint is a powerful trading companion designed to generate high-probability entry signals with dynamic TP/SL/DP levels based on volatility. Built-in performance tracking shows win/loss stats, PP1/PP2 hits, and success rates — all updated live. Key Features: Buy/Sell signals with adaptive volatility bands Real-time TP/SL/DP levels based on ATR Built-in MA Filter with optional ATR/StdDev volatility Performance stats panel (Success, Profit/Loss, PP1/PP2) Alerts via popup, sound, push, or emai
Reversion King Indicator
Eugen-alexandru Zibileanu
5 (4)
Um novo Rei chegou à cidade - Indicador + Gestão de Ordens (TP1 + TP2 + TP3) + Enviador opcional de sinais para Telegram INCLUÍDO (GRÁTIS) (SISTEMA COMPLETO DE TRADING e SINAIS) Nosso melhor EA para Ouro: Gold Slayer Este indicador inclui uma estratégia avançada, um sistema de trading com gestão de ordens personalizável e um sistema de reversão à média que combina extensões de envelopes, apoiado por múltiplos filtros inteligentes de confirmação, como o RSI, para capturar entradas de reversão de
Market Structure Order Block Dashboard MT5 é um indicador MT5 projetado para traders que querem ler a estrutura de mercado e as principais zonas de reação do preço diretamente no gráfico. Combina BOS, ChoCH, Order Blocks, Fair Value Gaps (FVG), Liquidez, Kill Zones, Volume Profile e um painel compacto para análise rápida. Este indicador é voltado para traders que usam estrutura de mercado, conceitos ICT e Smart Money como quadro de decisão. Pode ajudar a identificar continuações de tendência, po
Quant Direction MT5
Georgios Kalomoiropoulos
Quant Direction é uma ferramenta de análise de mercado tridimensional. Ela oferece uma análise de mercado totalmente objetiva, baseada em algoritmos, que calcula simultaneamente desvios percentuais precisos em diversos parâmetros. Desenvolvido com ferramentas avançadas de modelagem com inteligência artificial e rigorosamente testado, o algoritmo foi projetado para interpretar o mercado com precisão sem precedentes. Você pode analisar qualquer par de moedas ou instrumento financeiro em sua plataf
Meravith MT5
Ivan Stefanov
5 (1)
Ferramenta dos market makers. O Meravith irá: Analisar todos os timeframes e exibir a tendência atual em vigor. Destacar zonas de liquidez (equilíbrio de volume) onde o volume comprador e vendedor é igual. Mostrar todos os níveis de liquidez de diferentes timeframes diretamente no seu gráfico. Gerar e apresentar análise de mercado em formato de texto para sua referência. Calcular alvos, níveis de suporte e pontos de stop-loss com base na tendência atual. Calcular a relação risco/retorno das suas
Este produto foi atualizado para o mercado de 2026 e otimizado para as versões mais recentes do MT5. AVISO DE ATUALIZAÇÃO DE PREÇO: MENA Trend Scanner Pro está atualmente disponível por $99 . O preço aumentará para $199 após as próximas 30 compras . OFERTA ESPECIAL: Após comprar o MENA Trend Scanner Pro, envie-me uma mensagem privada para receber o Smart Universal EA GRÁTIS e transformar seus sinais do MENA Trend em operações automatizadas. Antes de tudo, vale destacar que este sistema de tradi
MasterTrend
Temirlan Kdyrkhan
MasterTrend Indicator for MT5 A powerful trend-following and signal-evaluation tool MasterTrend   is a custom MT5 indicator that combines Moving Averages and ATR-based risk/reward logic to generate clear buy/sell signals. It visualizes dynamic SL/TP levels, evaluates past trade outcomes, and displays win/loss statistics in a clean on-chart panel. Key features include: Buy/Sell signals based on MA crossovers ATR-based SL/TP1/TP2/TP3 levels with visual lines and labels Signal outcome tracking wit
Mais do autor
Market Profile with Dashboard Indicator - Complete User Guide xau only Here   our more valuable tools SMC Trend Trading   ,  Easy SMC Trading  ,  Institutional SMC Architect Volume Analysis Tools  ,  Volume flow Profile  ,  Market volume profile  , FVG with Volume  , Liquidity Heatmap Profile  ,  Volume Spread Analysis The Market Profile with Dashboard is a comprehensive trading analysis tool for MetaTrader 4 that displays market profile data, volume analysis, and key market structure informa
FREE
Buy Sell Range
Israr Hussain Shah
The Range Filter Buy and Sell indicator is a trend-following technical analysis tool designed to identify optimal entry and exit points in the market. It filters out market noise by creating dynamic bands around price movements, generating clear buy and sell signals when price breaks through these bands. Key Features Dynamic Range Filtering : Uses a sophisticated algorithm to calculate adaptive bands that adjust to market volatility Trend Identification : Clearly visualizes the current trend dir
FREE
Here   our more valuable tools SMC Trend Trading   ,  Easy SMC Trading  ,  Institutional SMC Architect Volume Analysis Tools  ,  Volume flow Profile  ,  Market volume profile  , FVG with Volume  , Liquidity Heatmap Profile  ,  Volume Spread Analysis Automatically detects major swing points not internal noise Generates buy/sell signals at key Fibonacci levels Displays professional GUI panel with real-time analysis Marks major swings with visual indicators Trading Strategy BUY at 38.2%-61.8% Fib
FREE
Strong Bull V7 B&C  The ultimate M5 indicator for Boom & Crash indices, providing clear, filtered buy/sell signals to eliminate market noise and enhance your trading precision. Here   our more valuable tools SMC Trend Trading   ,  Easy SMC Trading  ,  Institutional SMC Architect Volume Analysis Tools  ,  Volume flow Profile  ,  Market volume profile  , FVG with Volume  , Liquidity Heatmap Profile  ,  Volume Spread Analysis Master the volatile Boom & Crash markets with Strong Bull V7 B&C . This
What It Does Finds Order Blocks (ANN + SMC) on big and small timeframes. Marks them with clean bullish/bearish zones. Drops arrows (blue = BUY, red = SELL) right inside each block. Shows an info panel on the right with the exact high/low of the newest blocks. Lets you change chart colors (background, bull candle, bear candle) instantly. How To Use It Drop the indicator into MQL5/Indicators → restart MT5. Add it to your chart. In the settings: Pick your background , bull candle , and bear candle
FREE
Here   our more valuable tools SMC Trend Trading   ,  Easy SMC Trading  ,  Institutional SMC Architect Volume Analysis Tools  ,  Volume flow Profile  ,  Market volume profile  , FVG with Volume  , Liquidity Heatmap Profile  ,  Volume Spread Analysis A professional spike pattern indicator built for synthetic traders who scalp and swing Crash 500/300/1000 with precision.  This indicator: Detects powerful 3-candle spike formations (Spike → Pullback → Spike) Automatically draws a clean box a
FREE
Here   our more valuable tools SMC Trend Trading   ,  Easy SMC Trading  ,  Institutional SMC Architect Volume Analysis Tools  ,  Volume flow Profile  ,  Market volume profile  , FVG with Volume  , Liquidity Heatmap Profile  ,  Volume Spread Analysis 2. Key Features Dynamic Filtering : The core feature. As soon as the current price crosses a historical liquidity level, that level disappears. This reduces chart clutter and prevents you from trading off "dead" support/resistance. Liquidity Heatma
Super Trend Live
Israr Hussain Shah
Here   our more valuable tools SMC Trend Trading   ,  Easy SMC Trading  ,  Institutional SMC Architect Volume Analysis Tools  ,  Volume flow Profile  ,  Market volume profile  , FVG with Volume  , Liquidity Heatmap Profile  ,  Volume Spread Analysis buy signal line and arrow to help you understand batter the direction sell signal line and arrow to help you understand batter the direction trade what you see not what you think this is an simple and best trading tool for our traders of any market
FREE
Here   our more valuable tools SMC Trend Trading   ,  Easy SMC Trading  ,  Institutional SMC Architect Volume Analysis Tools  ,  Volume flow Profile  ,  Market volume profile  , FVG with Volume  , Liquidity Heatmap Profile  ,  Volume Spread Analysis The Market Profile & Volume Profile Indicator is a powerful technical analysis tool designed to visualize market activity and price distribution over specific timeframes. Unlike standard technical indicators that focus solely on price over time, th
This is  SMC rules based swing structure tool wich help you to analyze the swing points and stay up-to-date about market structure in real time for batter trade decisions making about buy sell its easy to use and great thing is this you dont need to do any manual drawing for this it will auto analyzes the chart key swing points and print labels on it to know the exact level and about it with a tiny dot its bullish or bearish swing 
FREE
Big Bull Scalper
Israr Hussain Shah
Big bull scalper Short Description Master market structure with the precision of the popular Big bull scalper  This tool automatically identifies key pivot highs and lows, plotting unique "angling" trend lines that dynamically define market context. It visually confirms Breaks of Structure (BOS) and Changes of Character (CHoCH), removing all guesswork from your analysis. Key Features:    Automatic Pivot Detection Instantly spots significant swing highs and lows.    Dynamic Angling Lines Visual
FREE
Here   our more valuable tools SMC Trend Trading   ,  Easy SMC Trading  ,  Institutional SMC Architect Volume Analysis Tools  ,  Volume flow Profile  ,  Market volume profile  , FVG with Volume  , Liquidity Heatmap Profile  ,  Volume Spread Analysis The    Liquidity Heatmap   is a sophisticated institutional trading tool designed to reveal where over-leveraged traders are trapped. By calculating estimated liquidation levels based on volume spikes and leverage, this indicator draws a dynamic "h
Here   our more valuable tools SMC Trend Trading   ,  Easy SMC Trading  ,  Institutional SMC Architect Volume Analysis Tools  ,  Volume flow Profile  ,  Market volume profile  , FVG with Volume  , Liquidity Heatmap Profile  ,  Volume Spread Analysis Transform Your Trading with Intelligent Market Insights! The 2025 Spike Killer Dashboard is a powerful MQL5 indicator that combines cutting-edge signal generation with an intuitive crystal dashboard for real-time market analysis. Designed for tra
Trade Manger
Israr Hussain Shah
Here   our more valuable tools SMC Trend Trading   ,  Easy SMC Trading  ,  Institutional SMC Architect Volume Analysis Tools  ,  Volume flow Profile  ,  Market volume profile  , FVG with Volume  , Liquidity Heatmap Profile  ,  Volume Spread Analysis You Give an Instruction: When you run the script, a window pops up with a dropdown menu. You choose exactly what you want it to do from the list (e.g., "Close Profit Only" or "Delete Pending Orders"). It Scans Your Positions: The script then reads
Smart trend pro
Israr Hussain Shah
Here   our more valuable tools SMC Trend Trading   ,  Easy SMC Trading  ,  Institutional SMC Architect Volume Analysis Tools  ,  Volume flow Profile  ,  Market volume profile  , FVG with Volume  , Liquidity Heatmap Profile  ,  Volume Spread Analysis Professional trend-following indicator with comprehensive visualization and control panel Key Features: Advanced Trend Detection Reliable Half Trend algorithm for precise trend identification Color-coded trend lines (Blue for bullish, Orange for
FREE
Here   our more valuable tools SMC Trend Trading   ,  Easy SMC Trading  ,  Institutional SMC Architect Volume Analysis Tools  ,  Volume flow Profile  ,  Market volume profile  , FVG with Volume  , Liquidity Heatmap Profile  ,  Volume Spread Analysis What It Does FiboPivot Dashboard is a powerful technical analysis tool that automatically calculates and displays Fibonacci-based pivot points on your chart. It identifies key support and resistance levels based on the previous day's price acti
FREE
Here   our more valuable tools SMC Trend Trading   ,  Easy SMC Trading  ,  Institutional SMC Architect Volume Analysis Tools  ,  Volume flow Profile  ,  Market volume profile  , FVG with Volume  , Liquidity Heatmap Profile  ,  Volume Spread Analysis The Trading Guide MT5 Indicator is a powerful psychological trading assistant designed to keep traders disciplined, focused, and emotionally balanced. This innovative indicator displays real-time motivational messages, trading rules, and analysis
FREE
Liquidity Channels Pro  MT5 VERSION HERE   Here   our more valuable tools SMC Trend Trading   ,  Easy SMC Trading  ,  Institutional SMC Architect Volume Analysis Tools  ,  Volume flow Profile  ,  Market volume profile  , FVG with Volume  , Liquidity Heatmap Profile  ,  Volume Spread Analysis Liquidity Channels  is a sophisticated Smart Money Concepts (SMC) tool designed to automate the identification of     Buy Side Liquidity (BSL)   and     Sell Side Liquidity (SSL) . Unlike standard support a
Here   our more valuable tools SMC Trend Trading   ,  Easy SMC Trading  ,  Institutional SMC Architect Volume Analysis Tools  ,  Volume flow Profile  ,  Market volume profile  , FVG with Volume  , Liquidity Heatmap Profile  ,  Volume Spread Analysis       MT5 VERSION   TRADE COPIER Select Role: On the account sending trades, choose Sender (Master Account) . On the account receiving trades, choose Copier (Receiver Account) . Lot Size Mode: Same Lot Size as Master: Ignores multipliers, copies ex
Money Flow Profile MT5 HERE   Here   our more valuable tools SMC Trend Trading   ,  Easy SMC Trading  ,  Institutional SMC Architect Volume Analysis Tools  ,  Volume flow Profile  ,  Market volume profile  , FVG with Volume  , Liquidity Heatmap Profile  ,  Volume Spread Analysis This Master Edition is engineered for clarity and speed, featuring a unique Auto-Theme Sync system that instantly beautifies your chart layout upon loading. Key Features: True Money Flow Calculation: Goes beyond stand
Here   our more valuable tools SMC Trend Trading   ,  Easy SMC Trading  ,  Institutional SMC Architect Volume Analysis Tools  ,  Volume flow Profile  ,  Market volume profile  , FVG with Volume  , Liquidity Heatmap Profile  ,  Volume Spread Analysis The activity of these professional operators, and more important, their true intentions, are clearly shown on a price chart if the trader knows how to read them .   VSA looks at the interrelationship between three variables on the chart in order
Trend Scan Friend
Israr Hussain Shah
Here   our more valuable tools SMC Trend Trading   ,  Easy SMC Trading  ,  Institutional SMC Architect Volume Analysis Tools  ,  Volume flow Profile  ,  Market volume profile  , FVG with Volume  , Liquidity Heatmap Profile  ,  Volume Spread Analysis Trend Identification: Look for the color change. When candles turn Green , look for Buy opportunities. When they turn Red , look for Sell opportunities. Entry: Enter on the break of the trend line or on the pullback to the line. Stop Loss: Use the
Trade Like Pro
Israr Hussain Shah
Here   our more valuable tools SMC Trend Trading   ,  Easy SMC Trading  ,  Institutional SMC Architect Volume Analysis Tools  ,  Volume flow Profile  ,  Market volume profile  , FVG with Volume  , Liquidity Heatmap Profile  ,  Volume Spread Analysis The Fair Value Gap (FVG) Indicator is designed to automatically detect price imbalance zones on the chart – a widely used concept in Smart Money Concepts (SMC) and Institutional Trading Models (ICT) . These gaps, also known as imbalances or ineffic
Risk Control Tool
Israr Hussain Shah
Here   our more valuable tools SMC Trend Trading   ,  Easy SMC Trading  ,  Institutional SMC Architect Volume Analysis Tools  ,  Volume flow Profile  ,  Market volume profile  , FVG with Volume  , Liquidity Heatmap Profile  ,  Volume Spread Analysis Overview (Short Description) A professional risk management indicator that helps traders calculate lot size, risk percentage, and reward ratio in real time. Perfect for Forex, Indices, Gold, and Synthetic Indices traders who want precise control ov
Here   our more valuable tools SMC Trend Trading   ,  Easy SMC Trading  ,  Institutional SMC Architect Volume Analysis Tools  ,  Volume flow Profile  ,  Market volume profile  , FVG with Volume  , Liquidity Heatmap Profile  ,  Volume Spread Analysis Short Description: Stop overloading your charts with dozens of indicators.   Bollinger Fibo  Pro   is a sophisticated, all-in-one trading system for MetaTrader 5 that merges two legendary concepts into a single, powerful tool. It enhances standard
Spike Blast Pro
Israr Hussain Shah
Here   our more valuable tools SMC Trend Trading   ,  Easy SMC Trading  ,  Institutional SMC Architect Volume Analysis Tools  ,  Volume flow Profile  ,  Market volume profile  , FVG with Volume  , Liquidity Heatmap Profile  ,  Volume Spread Analysis Spike Blaster Pro is a next-generation MT5 indicator designed specifically for synthetic markets. It works seamlessly on Boom Index and Weltrade Index , providing traders with sharp, reliable spike detection signals. What makes Spike Blaster Pro po
Here   our more valuable tools SMC Trend Trading   ,  Easy SMC Trading  ,  Institutional SMC Architect Volume Analysis Tools  ,  Volume flow Profile  ,  Market volume profile  , FVG with Volume  , Liquidity Heatmap Profile  ,  Volume Spread Analysis Purpose : Measures market pressure by analyzing tick movements, volume, and speed within a time window.   How it works : Calculates weighted price changes, considers tick velocity and volatility, and applies EMA smoothing.   Trading use : Strong po
Color schemes
Israr Hussain Shah
Colors schemes powerful MetaTrader 5 script designed for traders who value speed and a personalized trading environment. With a single click, you can instantly transform your chart's appearance using one of several professional, pre-designed color schemes, including popular styles like ICT/SMC. How to Use: In your MetaTrader 5 terminal, open the Navigator window (Ctrl+N). Find the Colors schemes script under the "Scripts" section. Drag and drop the script onto the chart you want to customize. A
Binary Rise Fall
Israr Hussain Shah
Here   our more valuable tools SMC Trend Trading   ,  Easy SMC Trading  ,  Institutional SMC Architect Volume Analysis Tools  ,  Volume flow Profile  ,  Market volume profile  , FVG with Volume  , Liquidity Heatmap Profile  ,  Volume Spread Analysis The Fractals_Price indicator is a technical analysis tool that identifies fractal patterns on price charts. Fractals are recurring patterns that signal potential trend reversals or continuation points. This indicator marks both upward and downward
The   Trend Analysis Dashboard   is a powerful, all-in-one technical analysis tool designed for traders who need a clear, consolidated view of market momentum across multiple timeframes. Instead of cluttering your chart with numerous separate indicators, this tool aggregates signals from four key oscillators (Stochastic, RSI, and dual CCI) into a single, easy-to-read panel. It calculates the directional bias (Buy, Sell, or Neutral) for each enabled timeframe and provides a visual summary of over
Filtro:
Andrey Yarosvet
181
Andrey Yarosvet 2025.12.16 17:34 
 

O usuário não deixou nenhum comentário para sua avaliação

Responder ao comentário