MT4 Sessions Indicator
- 지표
-
Part-time Day Trader
 I build practical MT4 and MT5 tools that help traders follow consistent execution routines with more structure, discipline, and confidence.
Because consistency is the real edge behind any trading strategy — and without it, no strategy works. - 버전: 2.0
- 업데이트됨: 15 7월 2026
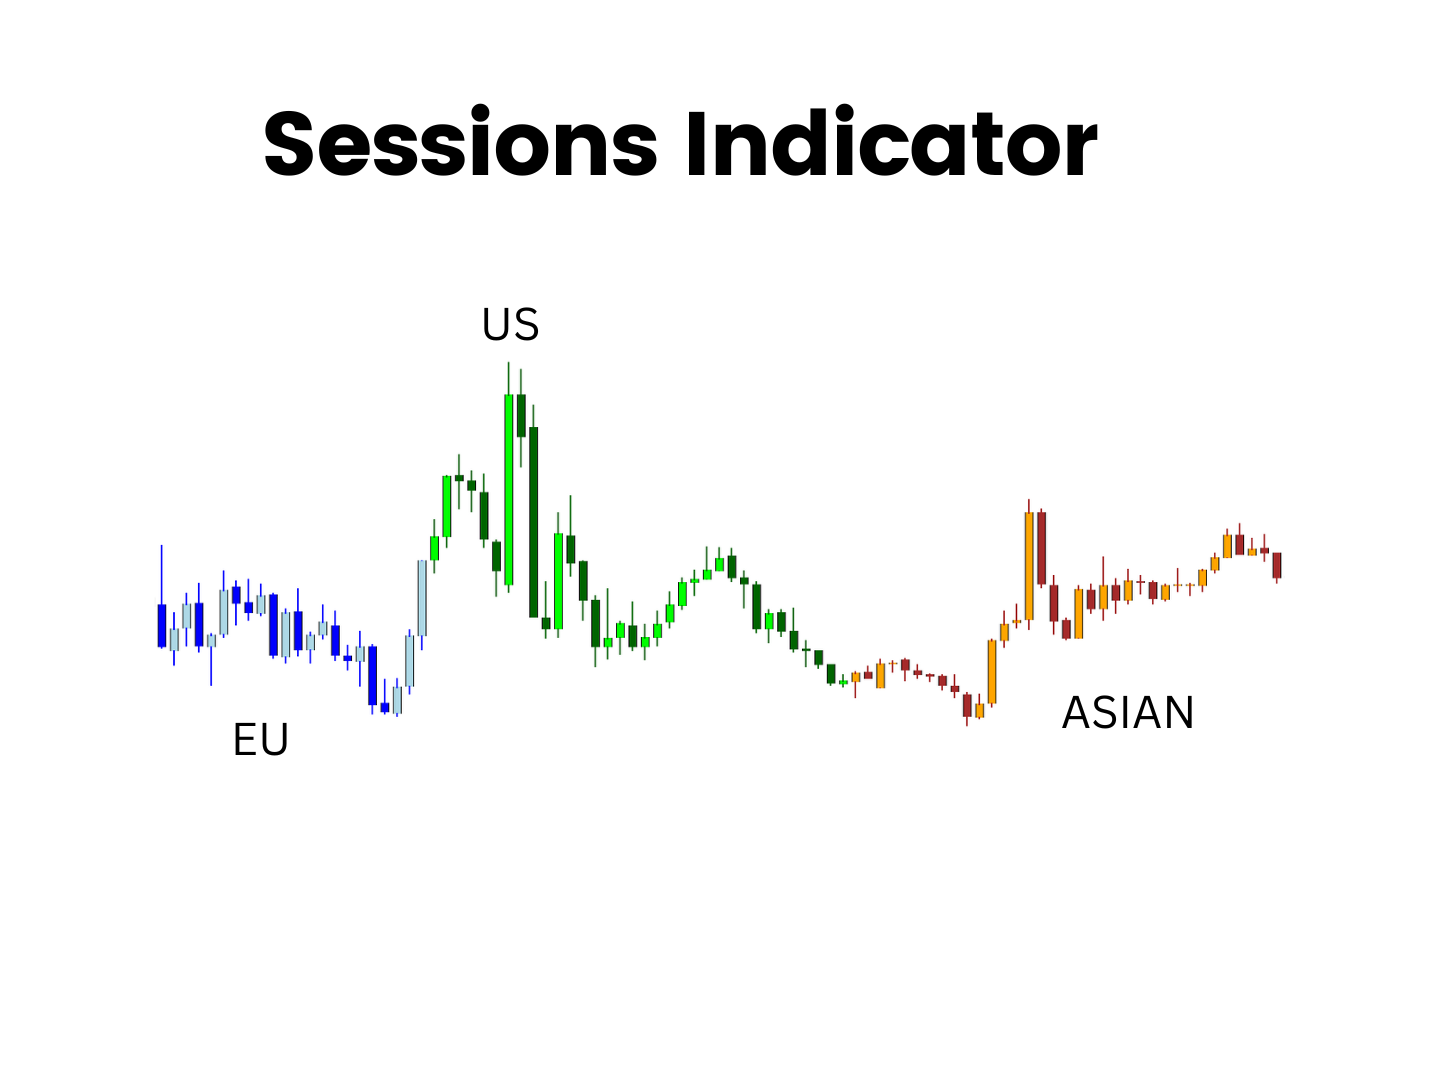
The MT4 Sessions Indicator highlights trading sessions directly on the chart using colored candles.
It helps traders quickly identify which price action occurred during specific market sessions or times of day.
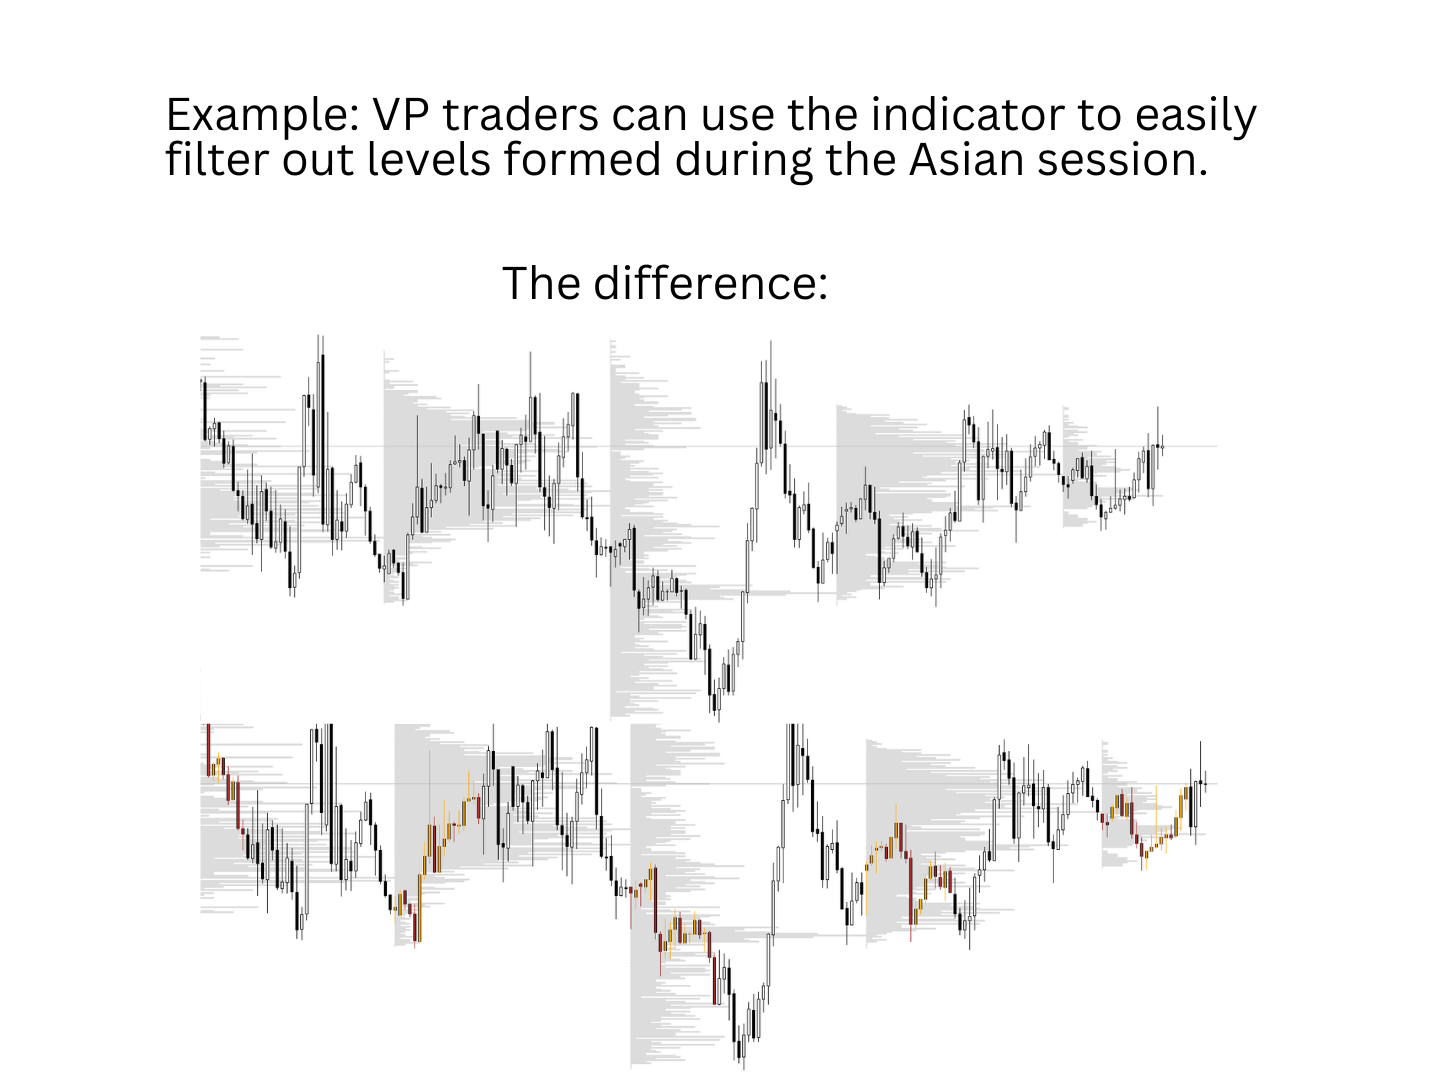
The indicator is especially useful for volume profile, supply and demand, and other level-based traders, where the timing of a move can be as important as the price level itself.
By visually separating trading sessions, it becomes easier to identify patterns, compare session behavior, and align setups with specific periods of market activity.
Key Features
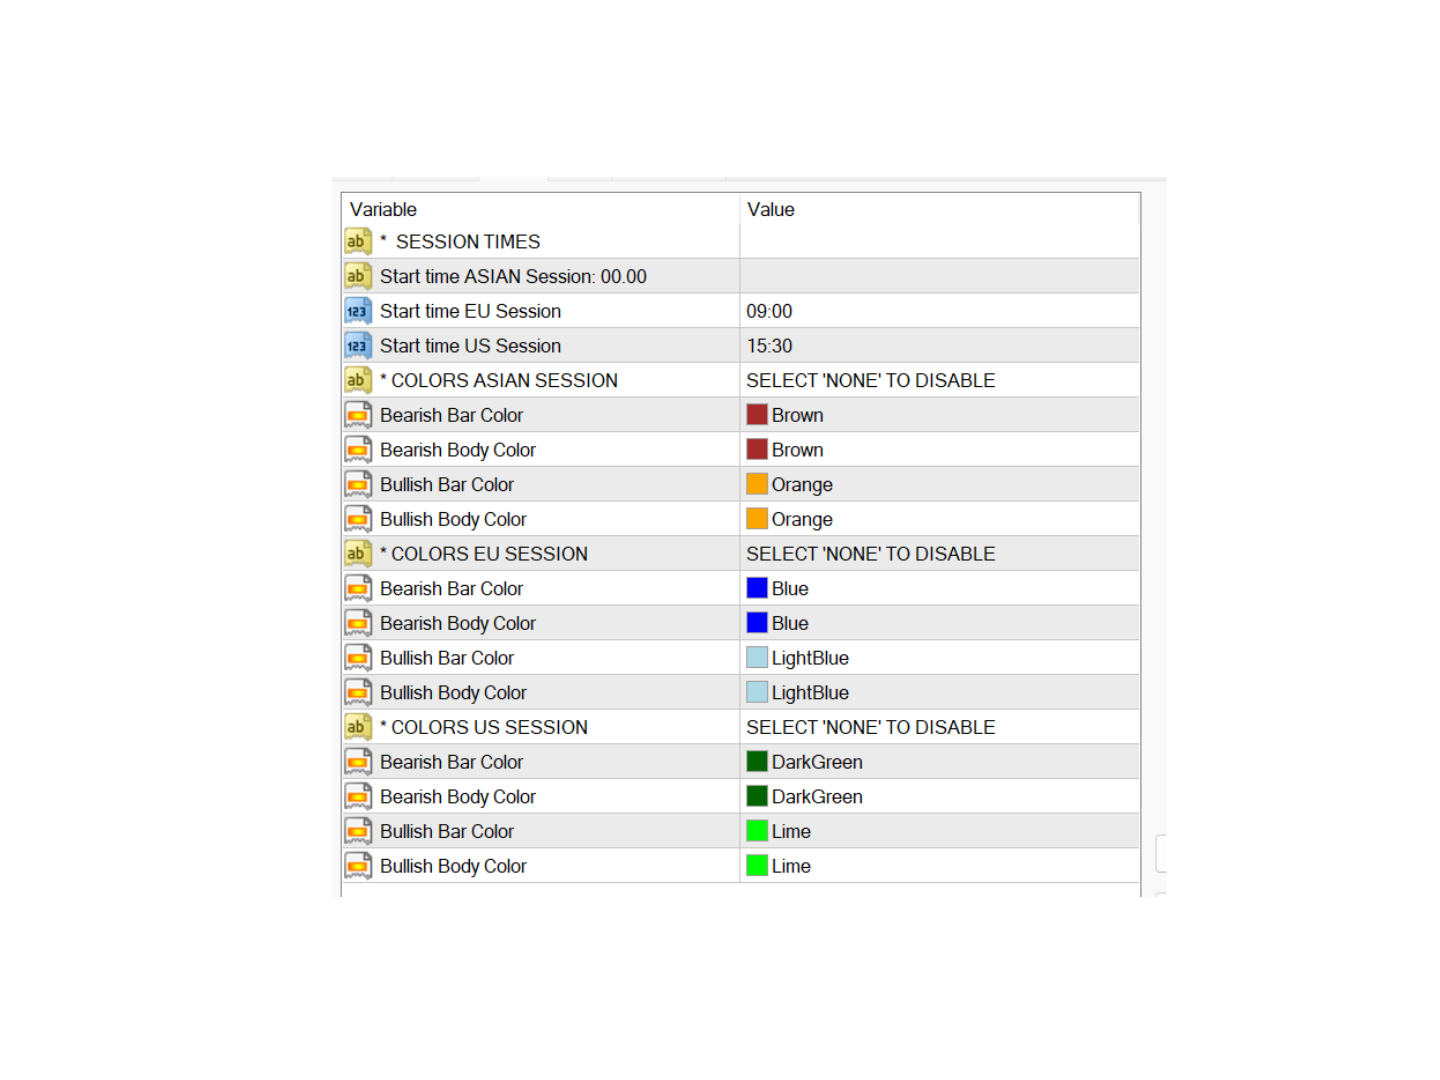
- Clear session visualization using colored candles
- Separate colors for bullish and bearish candles
- Customizable session start times
- Clean design for quick recognition without chart clutter
- Works across all symbols and timeframes
Important Notes
Ensure that the selected candle colors contrast with the chart background. If a candle color matches the background, the colored candles may not be clearly visible.


La sesión asiática siempre comienza a las 00:00 hora GMT. el indicador muestras las 00:00 pero el horario del broker. Entonces es conveniente agregar una opción de GMT. Gracias por el indicador. Bendiciones.