Trend Screener
- 지표
-
STE S.S.COMPANY
 Hello,
my name is Ashraf a fintech Software Engineer.
I create amazing forex indicators and expert advisors for Metatrader 4 and Metatrader 5, the best trading platforms.
Use my service and let me build your trading strategies ( Indicator coding or EA coding ) by click on bellow link - 버전: 22.30
- 업데이트됨: 31 1월 2025
- 활성화: 10
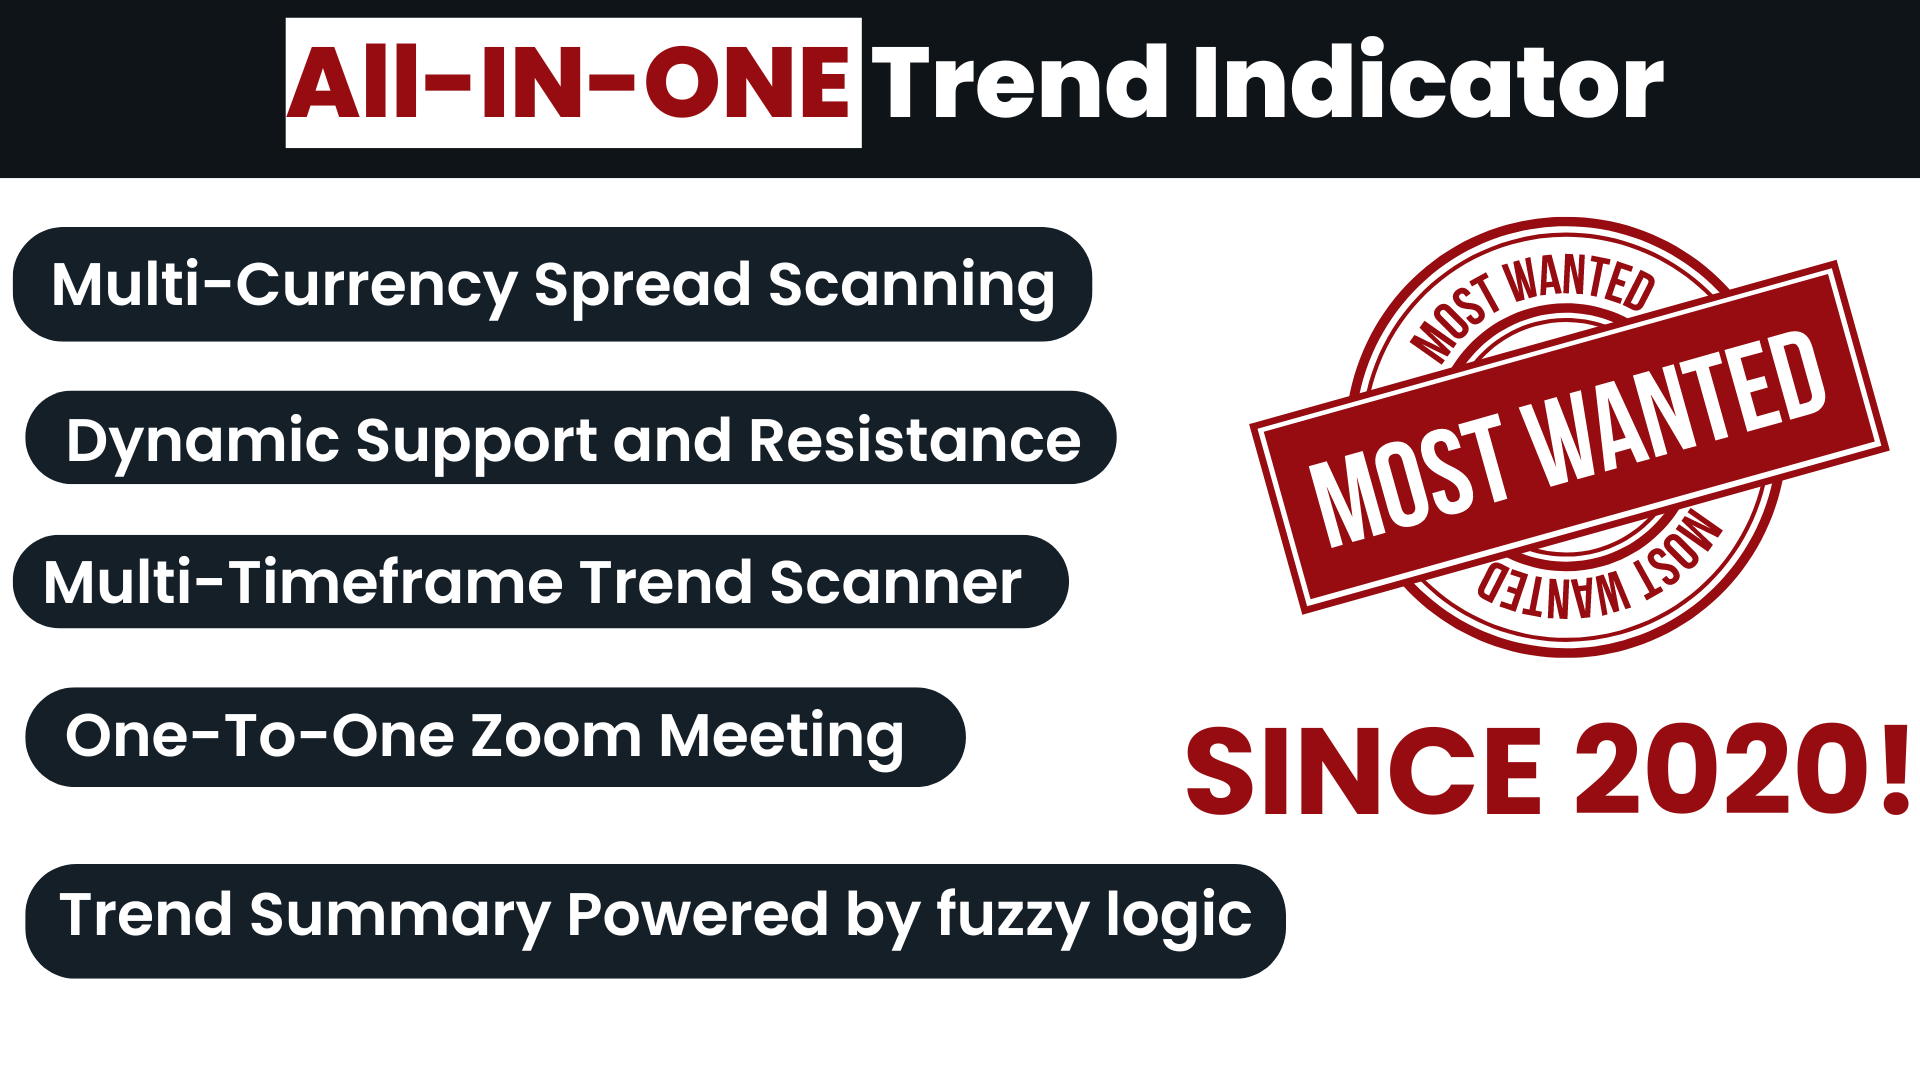
트렌드 표시기, 트렌드 트레이딩 및 필터링을 위한 획기적인 고유 솔루션, 하나의 도구 안에 내장된 모든 중요한 트렌드 기능! Forex, 상품, 암호 화폐, 지수 및 주식과 같은 모든 기호/도구에 사용할 수 있는 100% 다시 칠하지 않는 다중 시간 프레임 및 다중 통화 표시기입니다.
기간 한정 특가: 지원 및 저항 스크리너 지표는 단 250 달러에 평생 제공됩니다. (원래 가격 65 달러) (제안 연장)
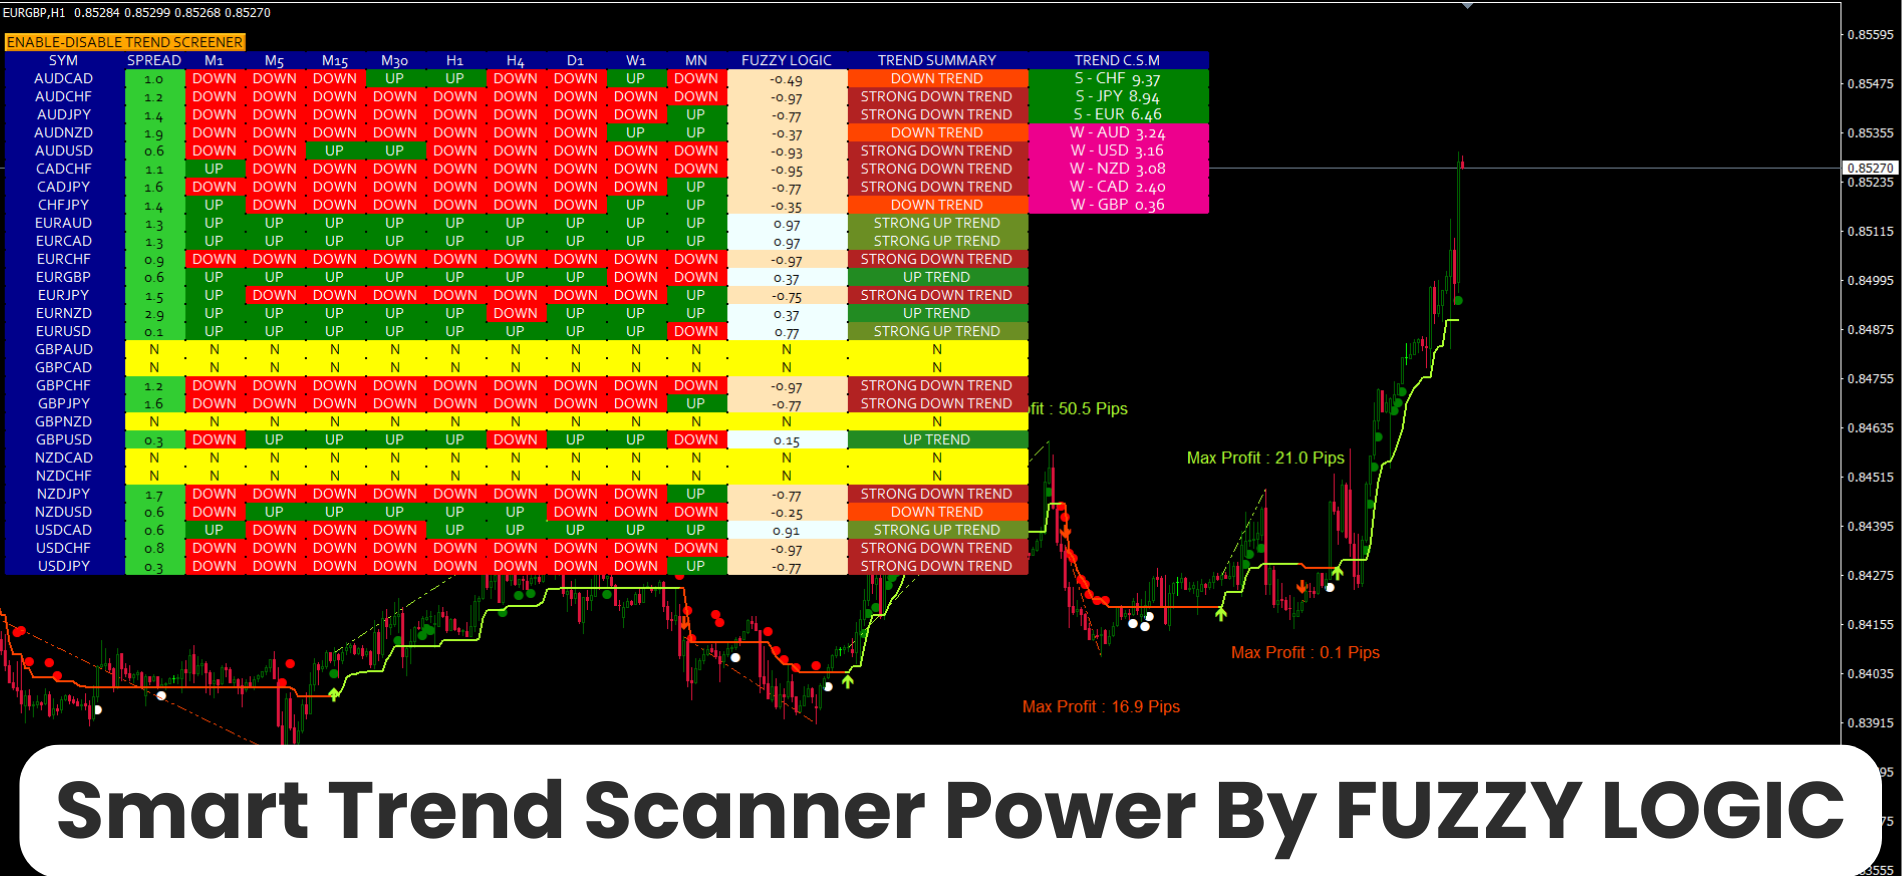
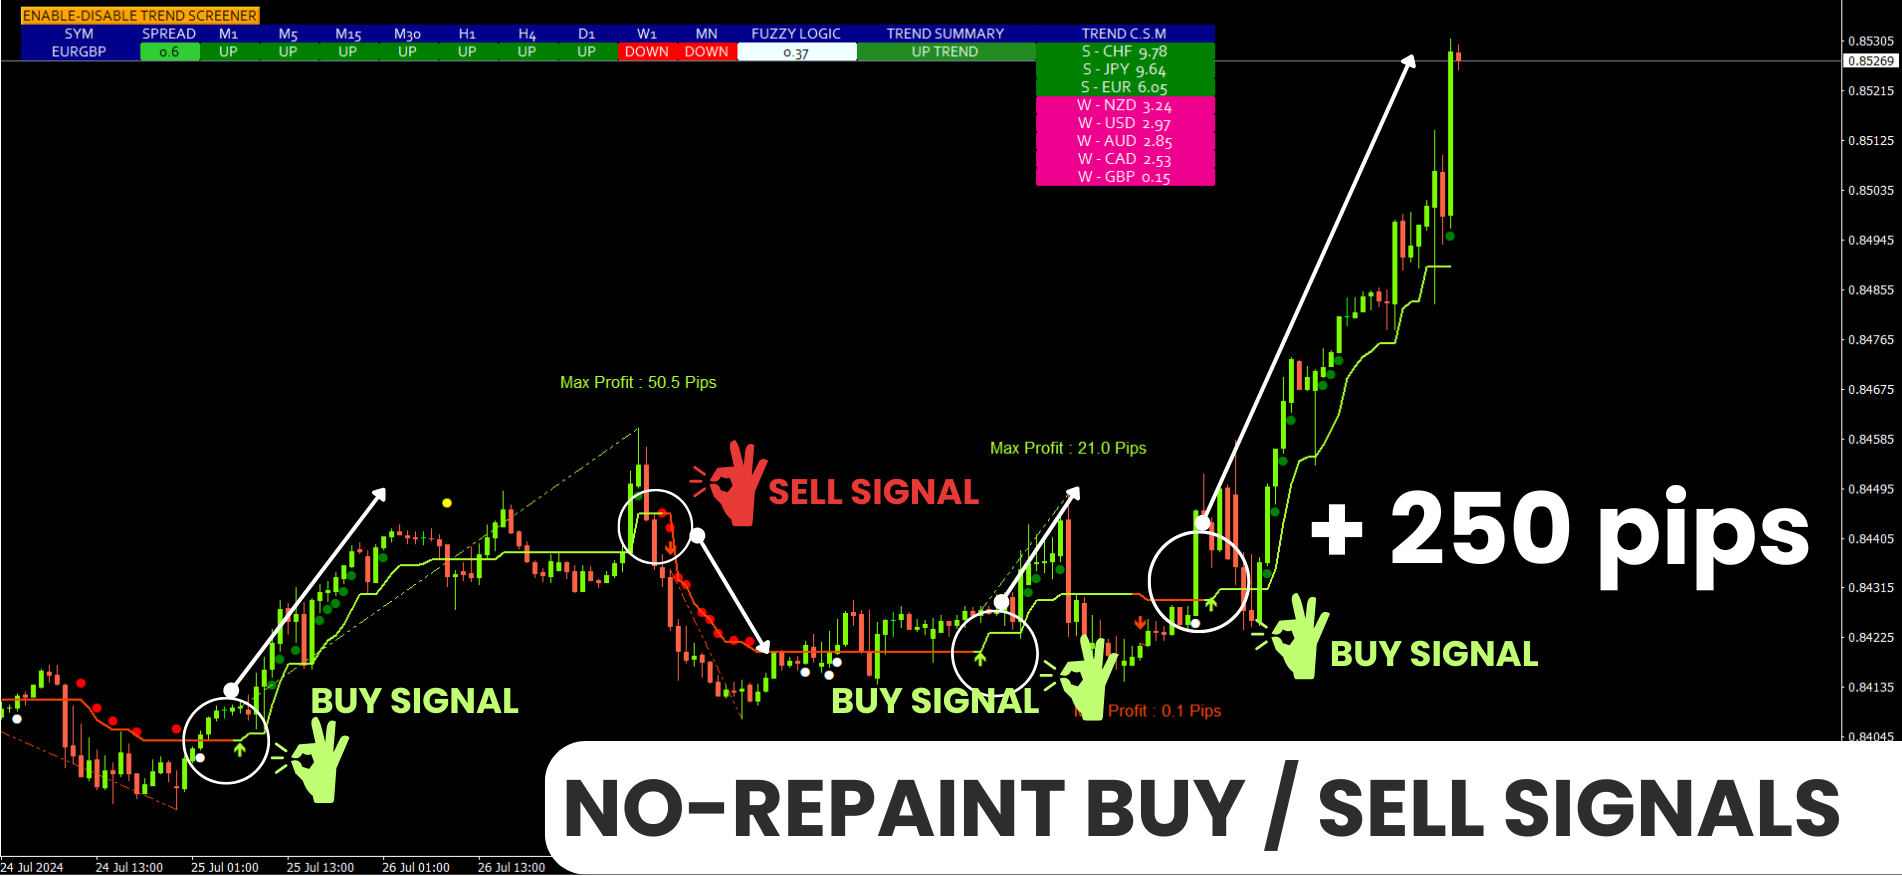
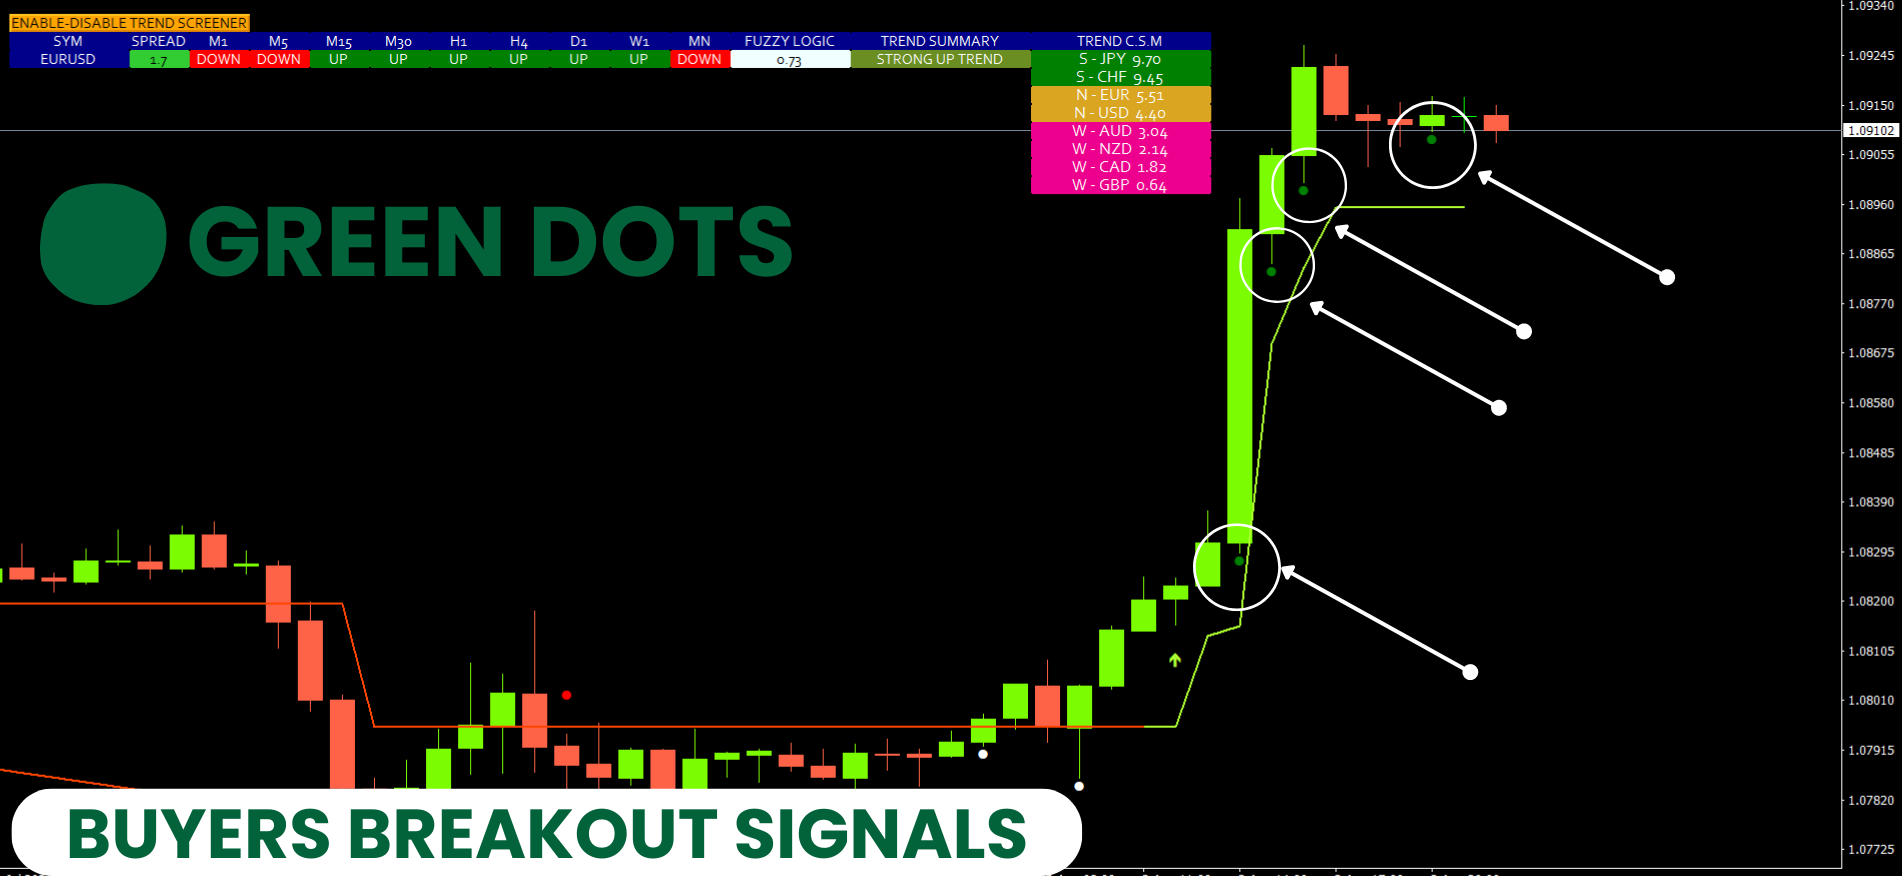
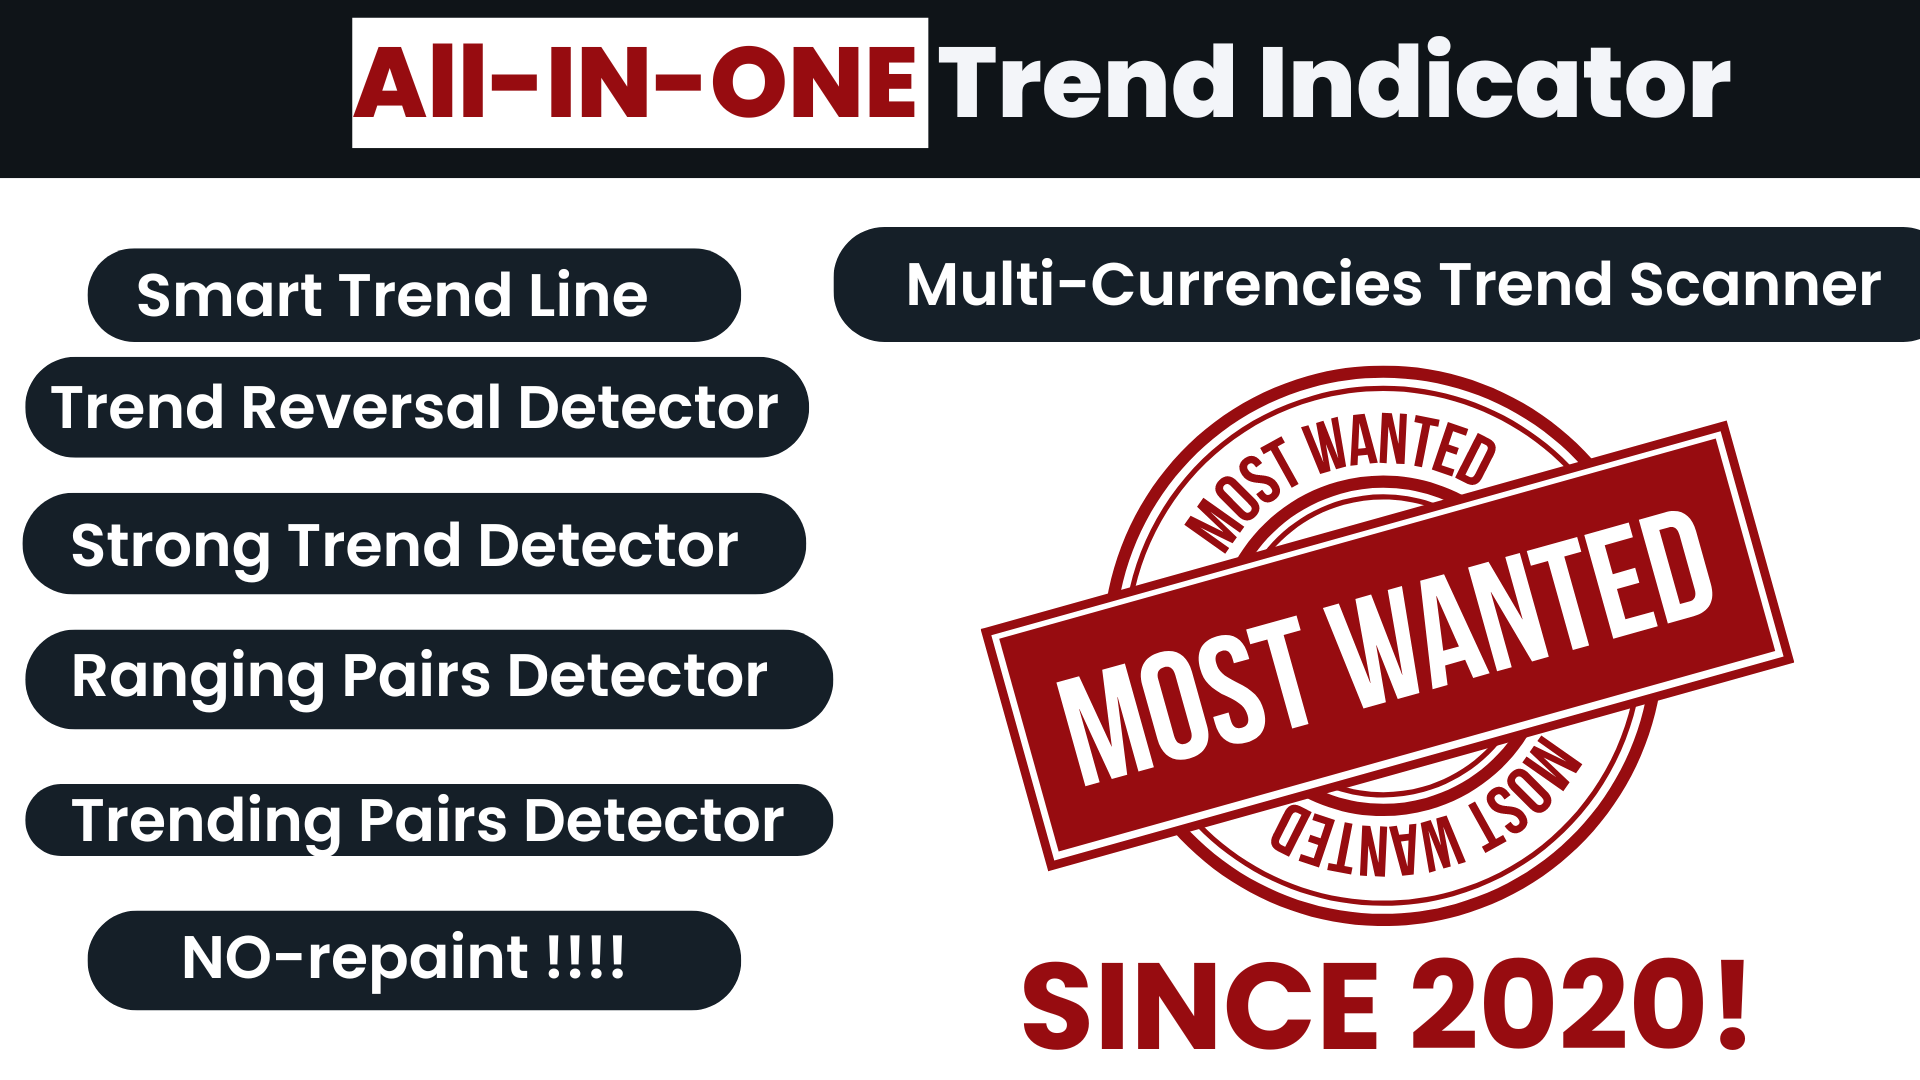
Trend Screener는 차트에 점이 있는 화살표 추세 신호를 제공하는 효율적인 지표 추세 추종 지표입니다. 추세 분석기 표시기에서 사용할 수 있는 기능:
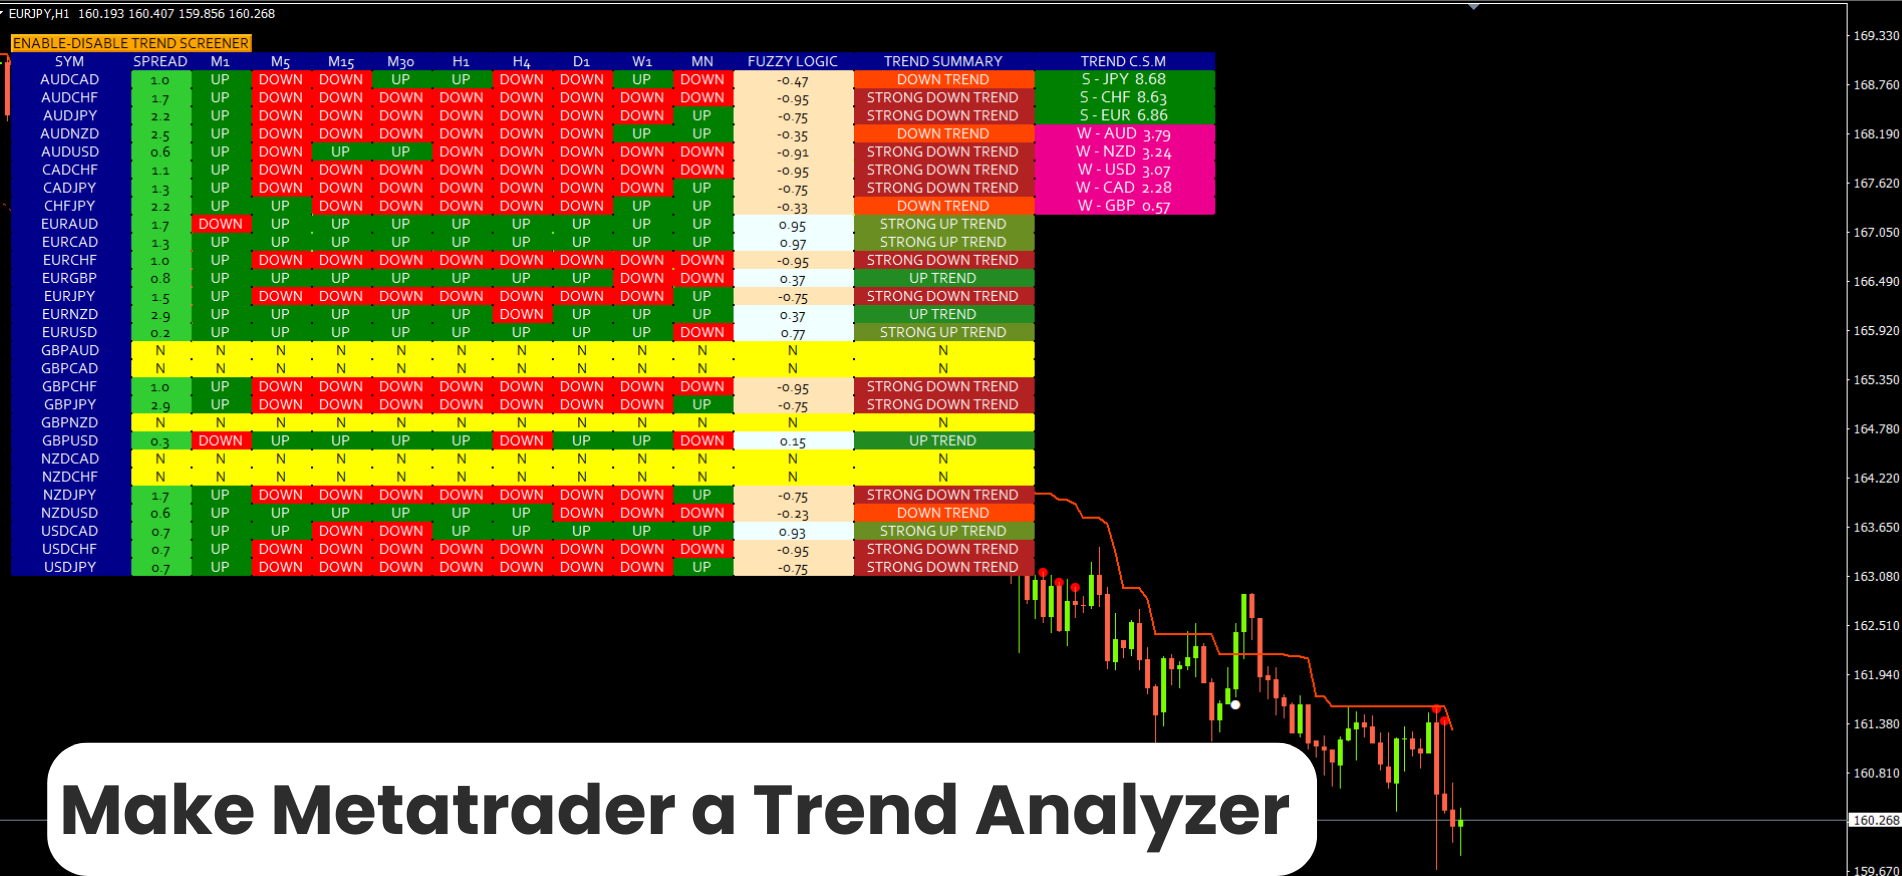
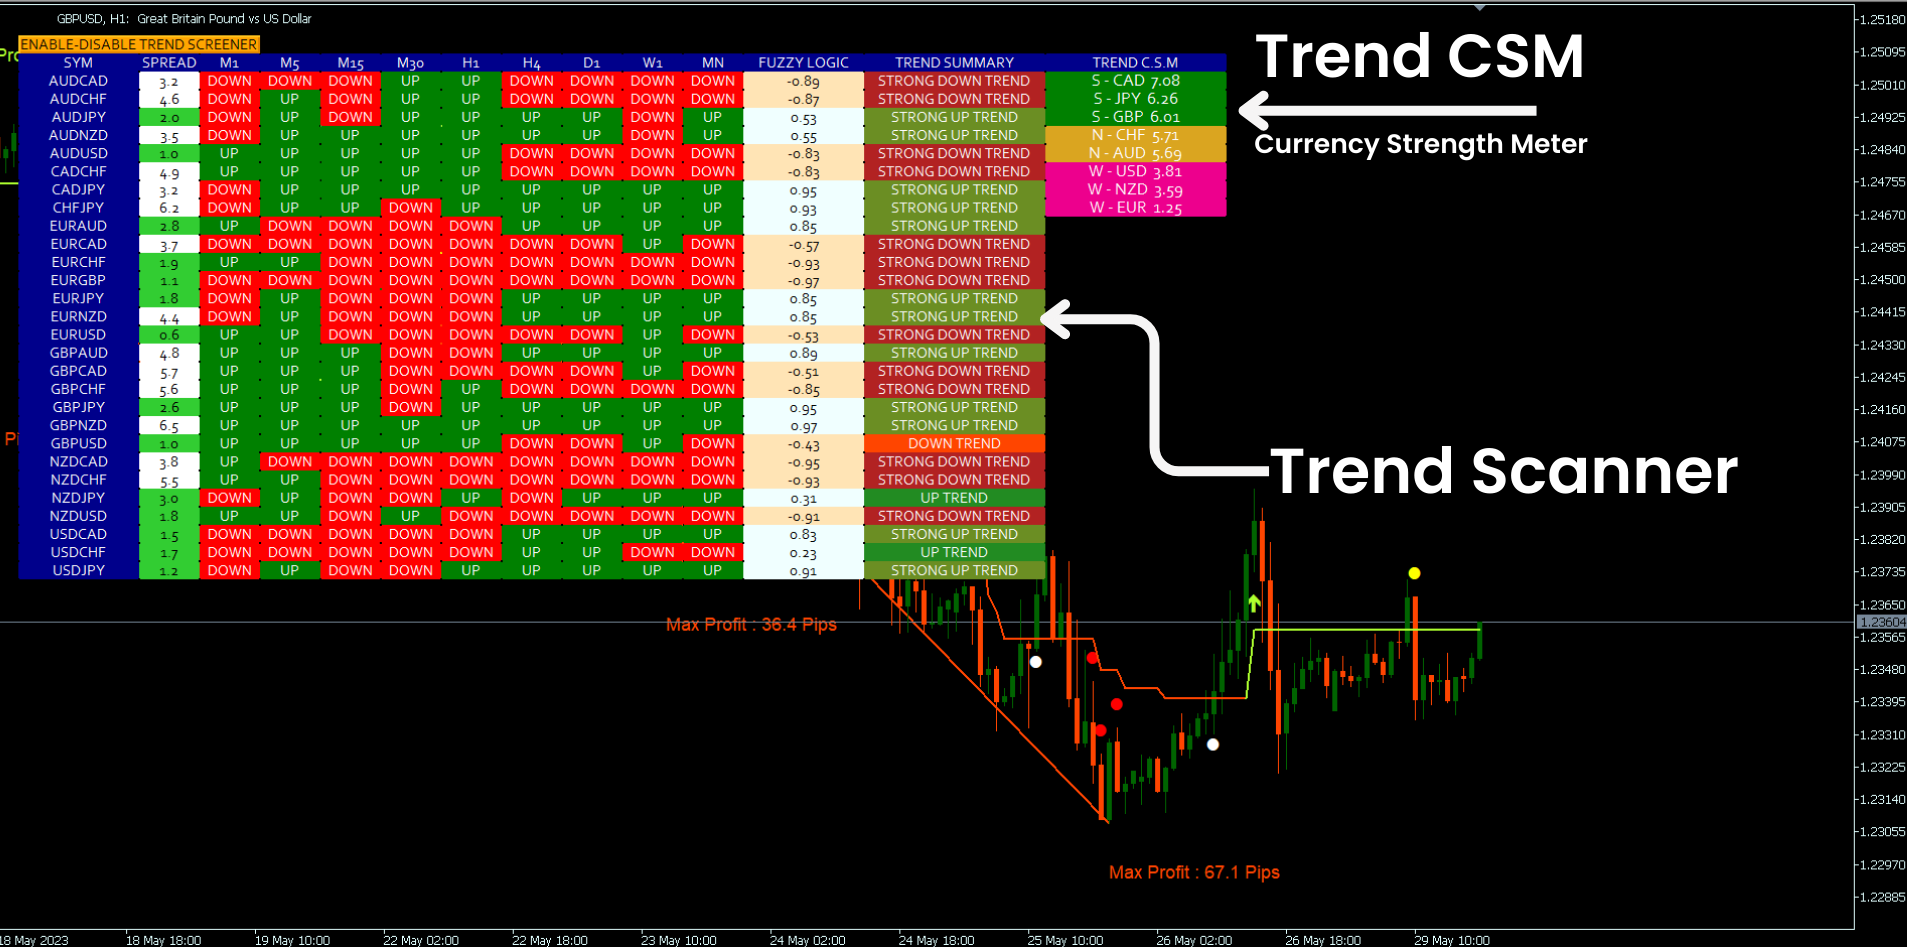
1. 트렌드 스캐너.
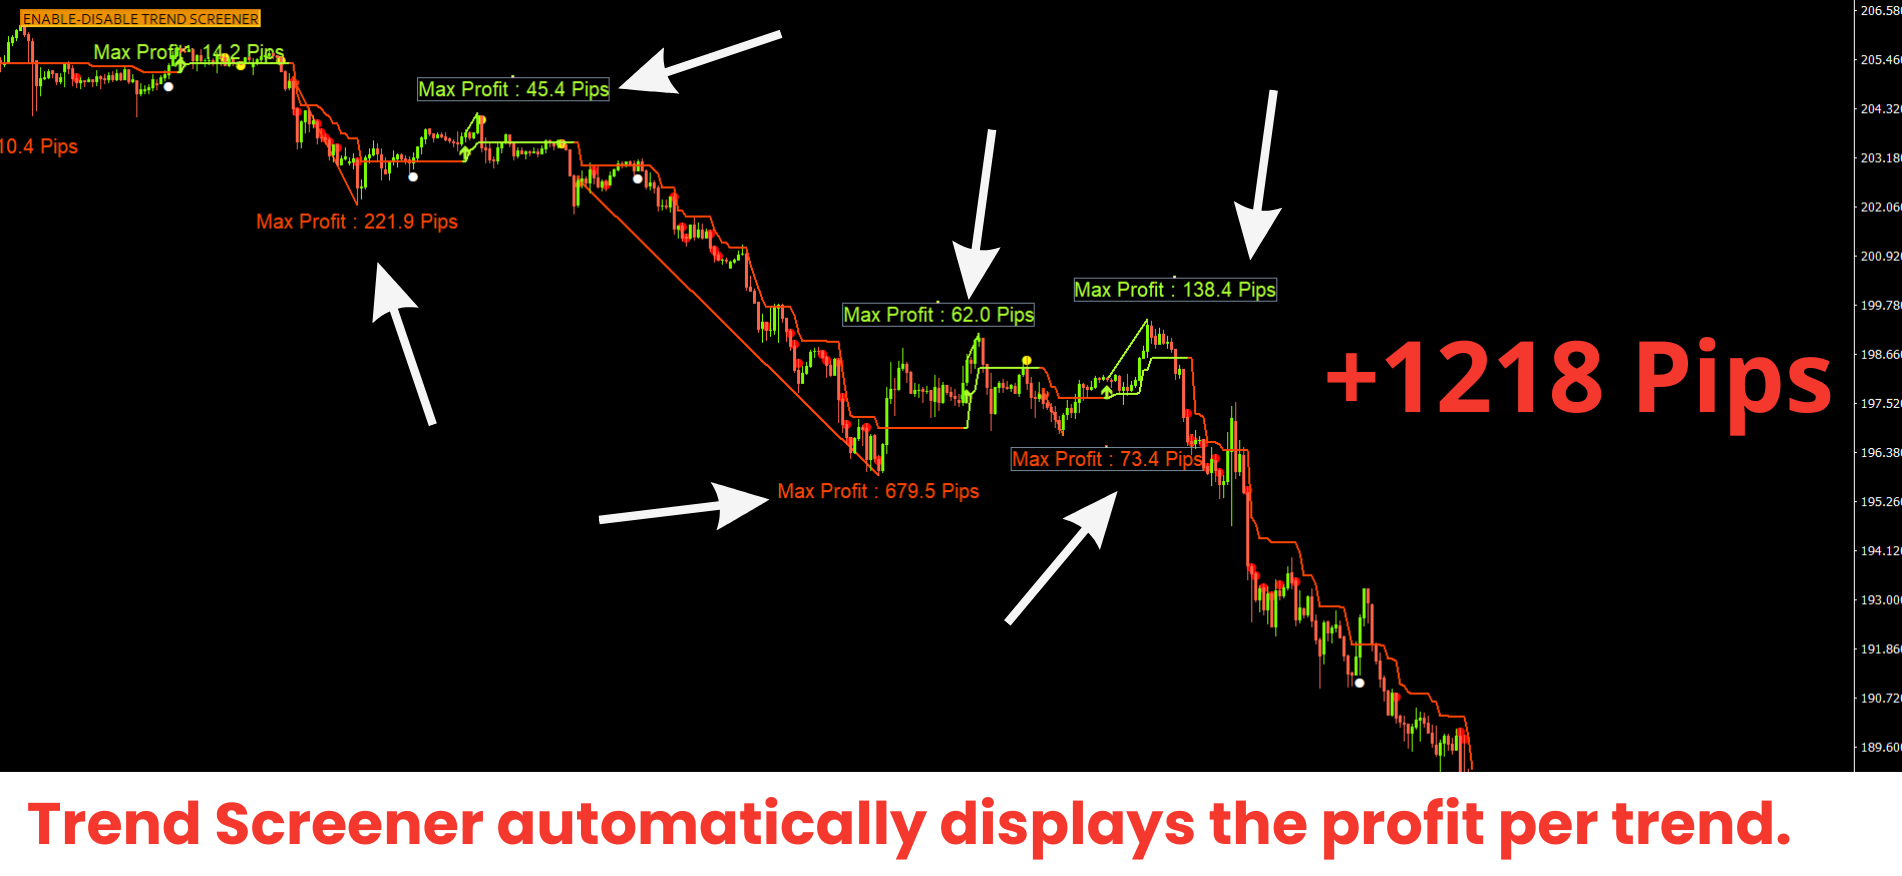
2. 최대 이익 분석이 있는 추세선.
3. 추세 통화 강도 측정기.
4. 경고가 있는 추세 반전 점.
5. 경고가 있는 강력한 추세 점.
6. 추세 화살표
Trend Screener Indicator가 있는 일일 분석 예, 일일 신호 성능...등은 여기에서 찾을 수 있습니다. 여기를 클릭하십시오.
MQL5 블로그에 액세스하면 분석 예제, 일일 신호 성능 등을 포함한 모든 프리미엄 지표를 찾을 수 있습니다. : 여기를 클릭하세요
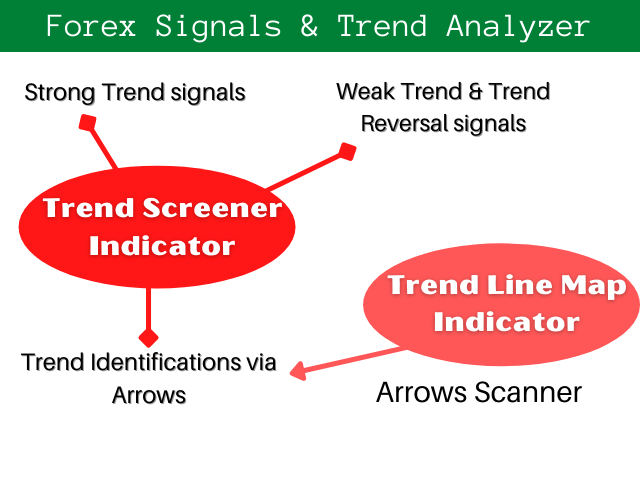
2가지 지표로 구성된 트렌드 시스템:
1. Trend Screener Indicator : 추세 대시보드, 차트의 추세선, 진입점 등을 표시합니다.
2. Trend Line Map Indicator: 대시보드로 매수 및 매도 표시, 활성 신호 손익...등.
추세선 지도 표시기 다운로드
Youtube 비디오 자습서:
MQL5 블로그를 확인하면 Trend Screener Indicator 사용 방법 및 거래 방법을 설명하는 많은 YouTube 비디오 자습서를 찾을 수 있습니다. 모든 비디오를 찾으려면 여기를 클릭하십시오.
주요 특징들
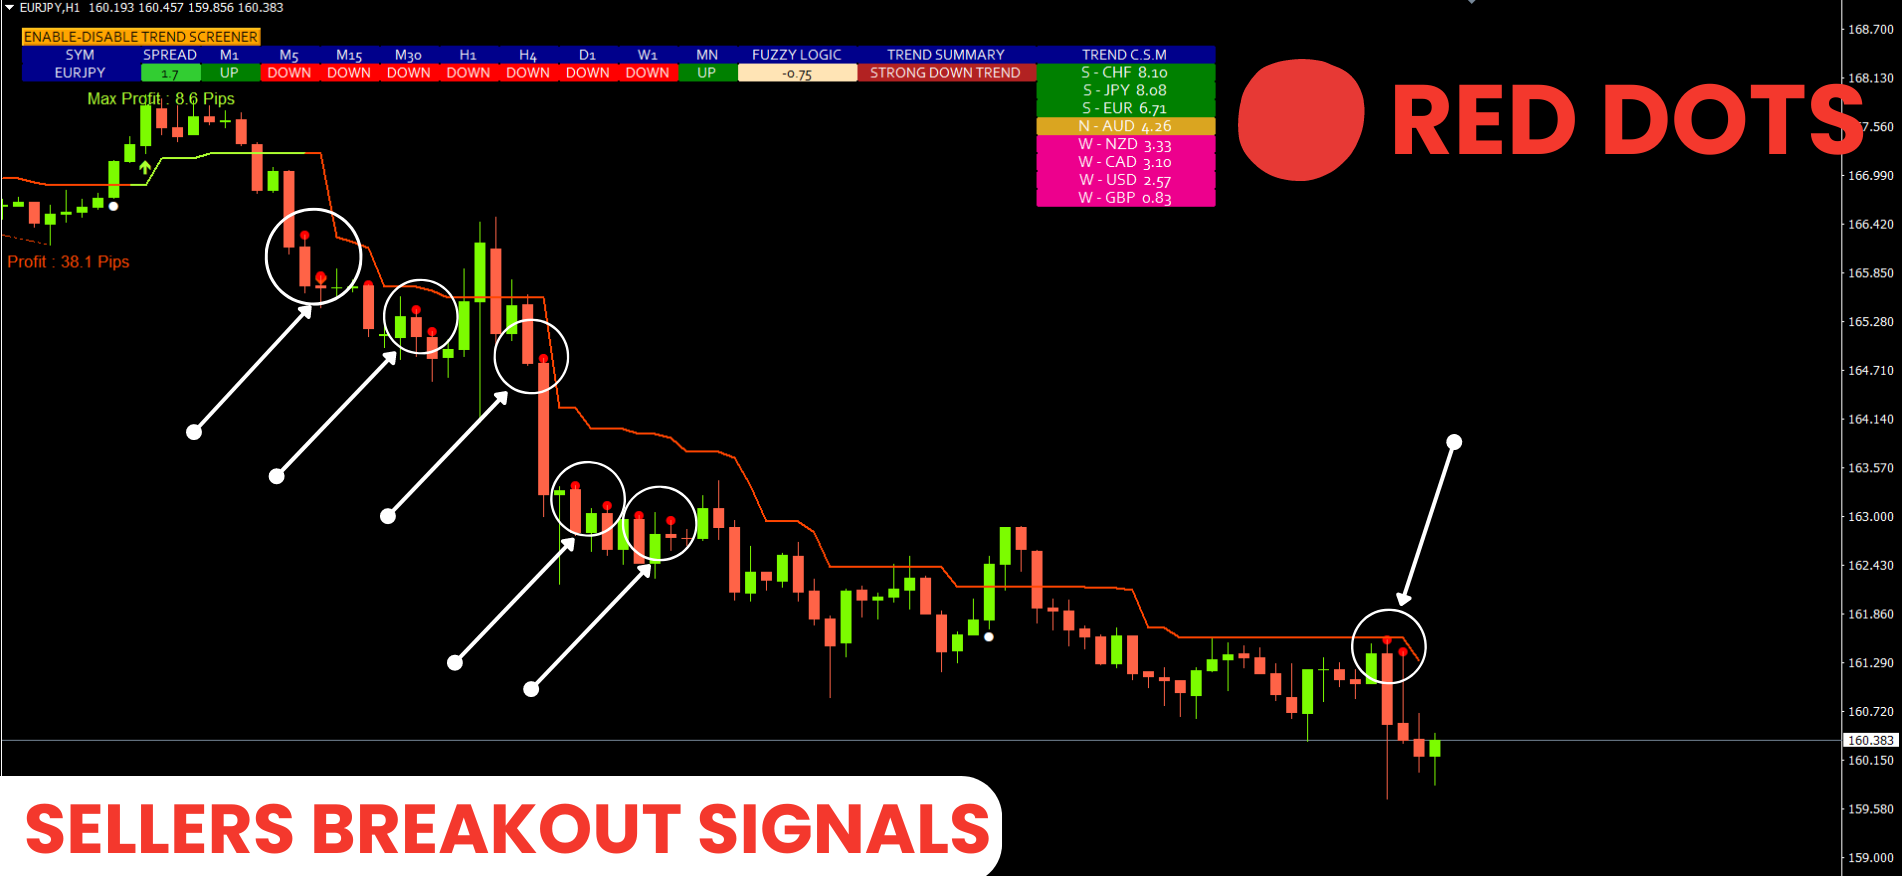
추세 강도 분석기.다중 시간대 및 다중 통화 추세 분석기.
트렌드 대시보드
추세 반전 신호. ( 도트 신호 )
강한 추세 신호. ( 도트 신호 )
추세선
문서( 지침 )
모든 Trend Screener 문서( 지침 ) 및 전략 세부 정보는 MQL5 블로그의 이 게시물에서 볼 수 있습니다. 여기를 클릭하십시오.
연락하다
질문이 있거나 도움이 필요하면 비공개 메시지를 통해 저에게 연락하십시오.
작가
SAYADI ACHREF, 핀테크 소프트웨어 엔지니어이자 Finansya의 설립자. 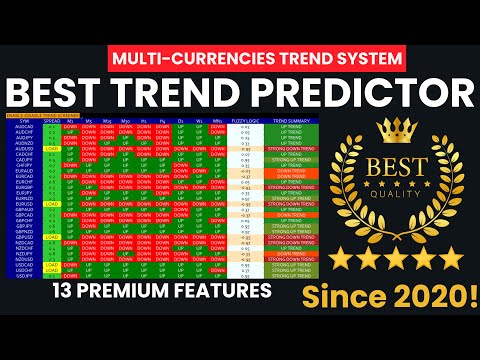


I have been using this trading system for three years. I've found that having all three indicators is significantly more effective, as they create a complete and comprehensive system.