Volume Profile Pro Signals
- インディケータ
-
Van Minh Nguyen
 Hello! I'm an independent EA developer with a passion for algorithmic trading and automated systems. I specialize in building Expert Advisors and indicators for the MetaTrader platform, with a focus on reliability, performance, and user-friendly design. I’m here to share quality trading tools and
 - バージョン: 3.1
- アップデート済み: 26 2月 2026
- アクティベーション: 10
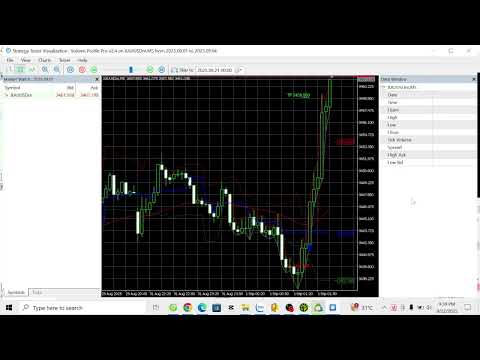
Volume Profile Pro Signals
精密な出来高分析と自動シグナル生成の統合。
機能概要
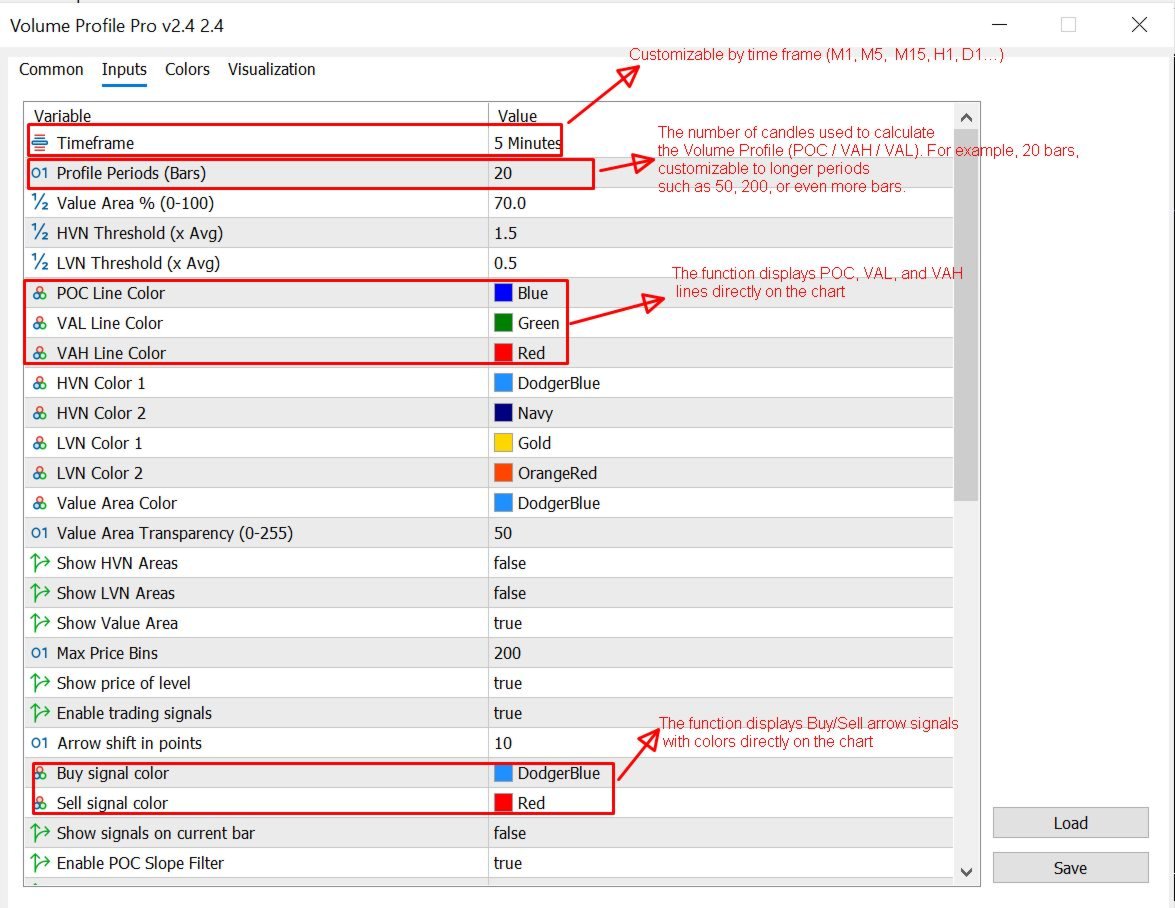
Volume Profile Pro Signals は、どの価格帯に実際の取引ボリュームが集中しているかをデータに基づきリアルタイムで可視化します。POC、VAH、VAL を強調表示し、HVN/LVN エリアも正確に識別します。これに基づき VAH/VAL のブレイクアウトをリアルタイムで検出し、ATR に基づく賢い SL/TP をプロットします。
プロファイルの解像度からアラート種別まで、すべての要素をトレードスタイルに合わせて細かく調整可能です。短期スキャルピングから複数日をまたぐポジショントレードまで対応します。
主な特徴
-
Price-by-Volume の視覚化:MT5 チャート上で Point of Control と Value Area を直接表示。
-
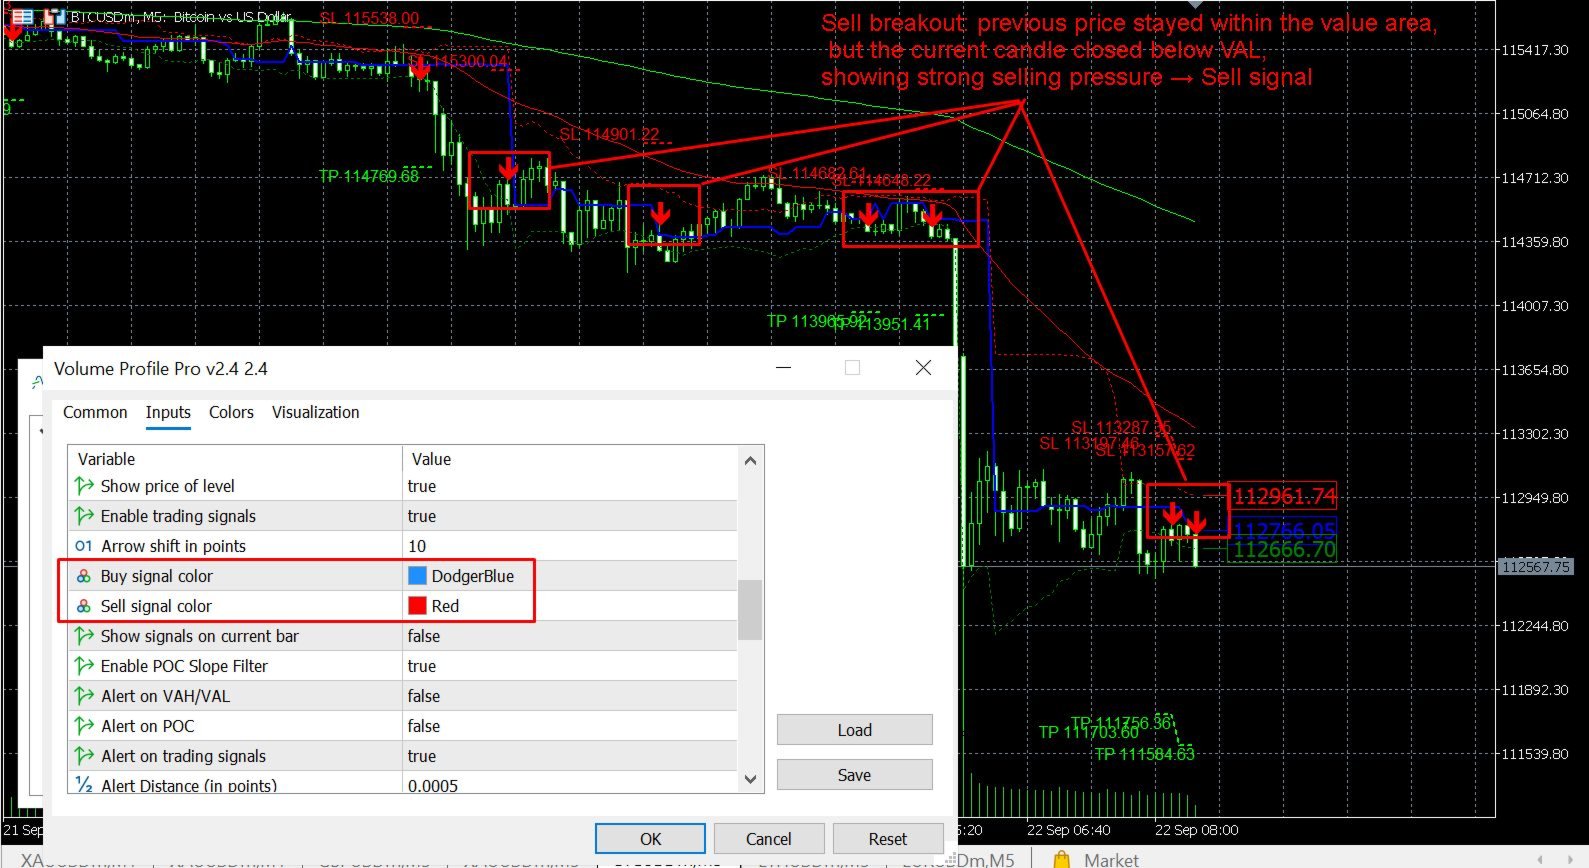
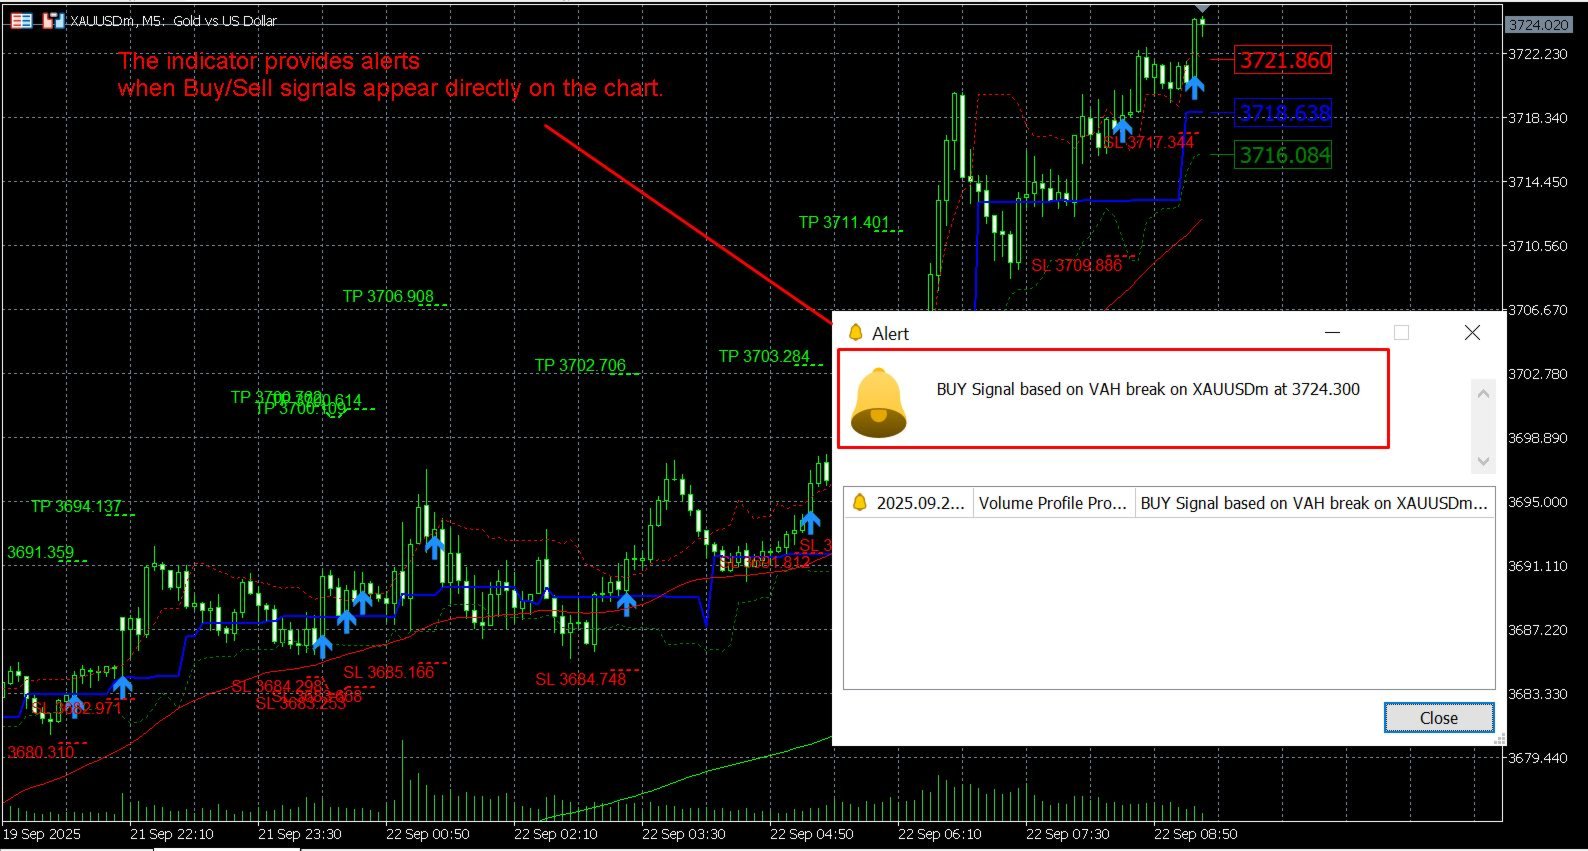
ブレイクアウトアラート:価格が VAH を上抜け、または VAL を下抜けた際に即時通知。
-
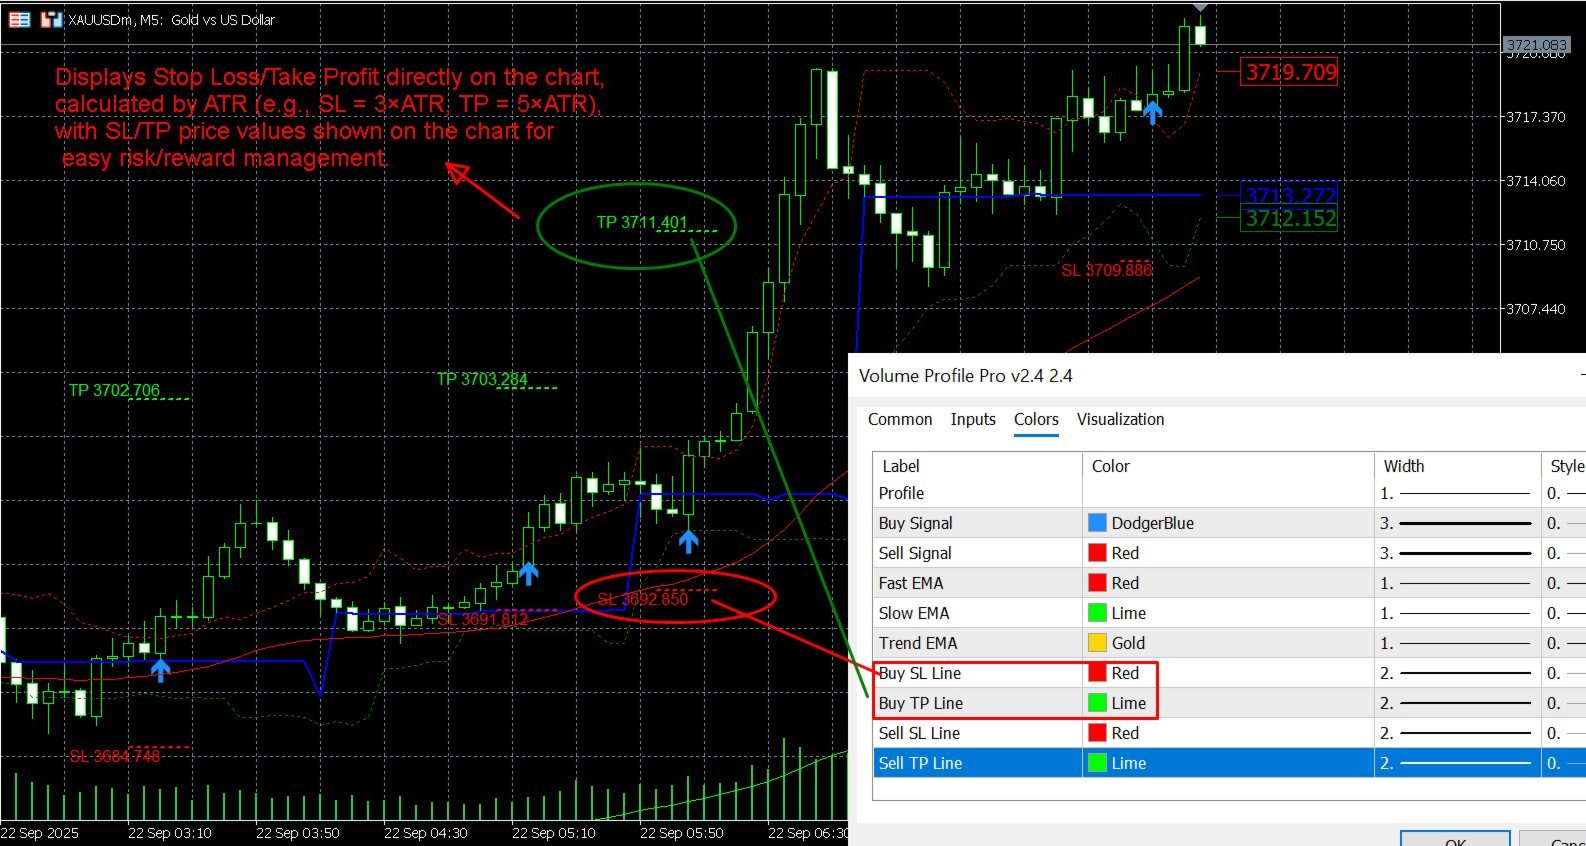
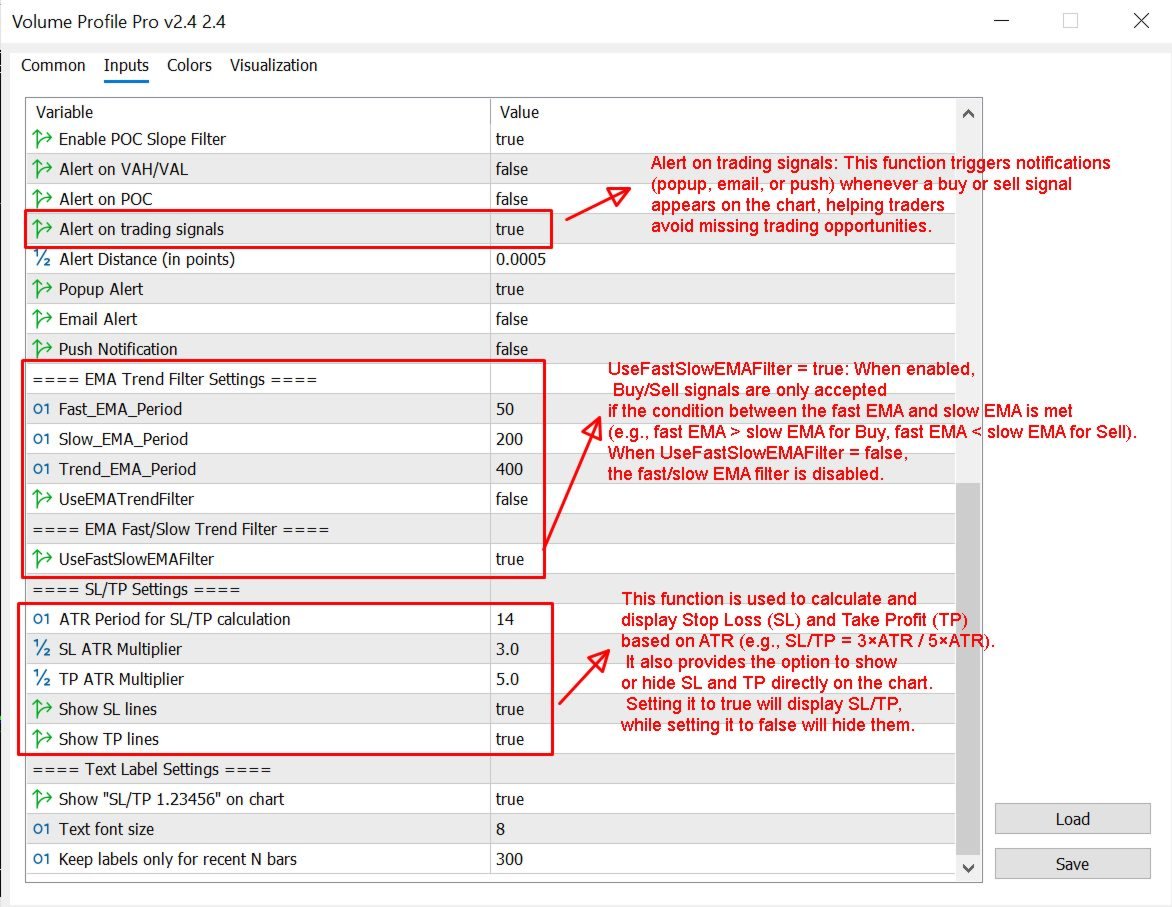
適応型リスクレベル:ATR に基づく自動 SL/TP 設定。
-
スマートフィルタ:EMA トレンドフィルタや POC 傾き確認で誤検出を低減。
-
HVN/LVN 認識:高ボリューム領域と低ボリューム領域を識別。
-
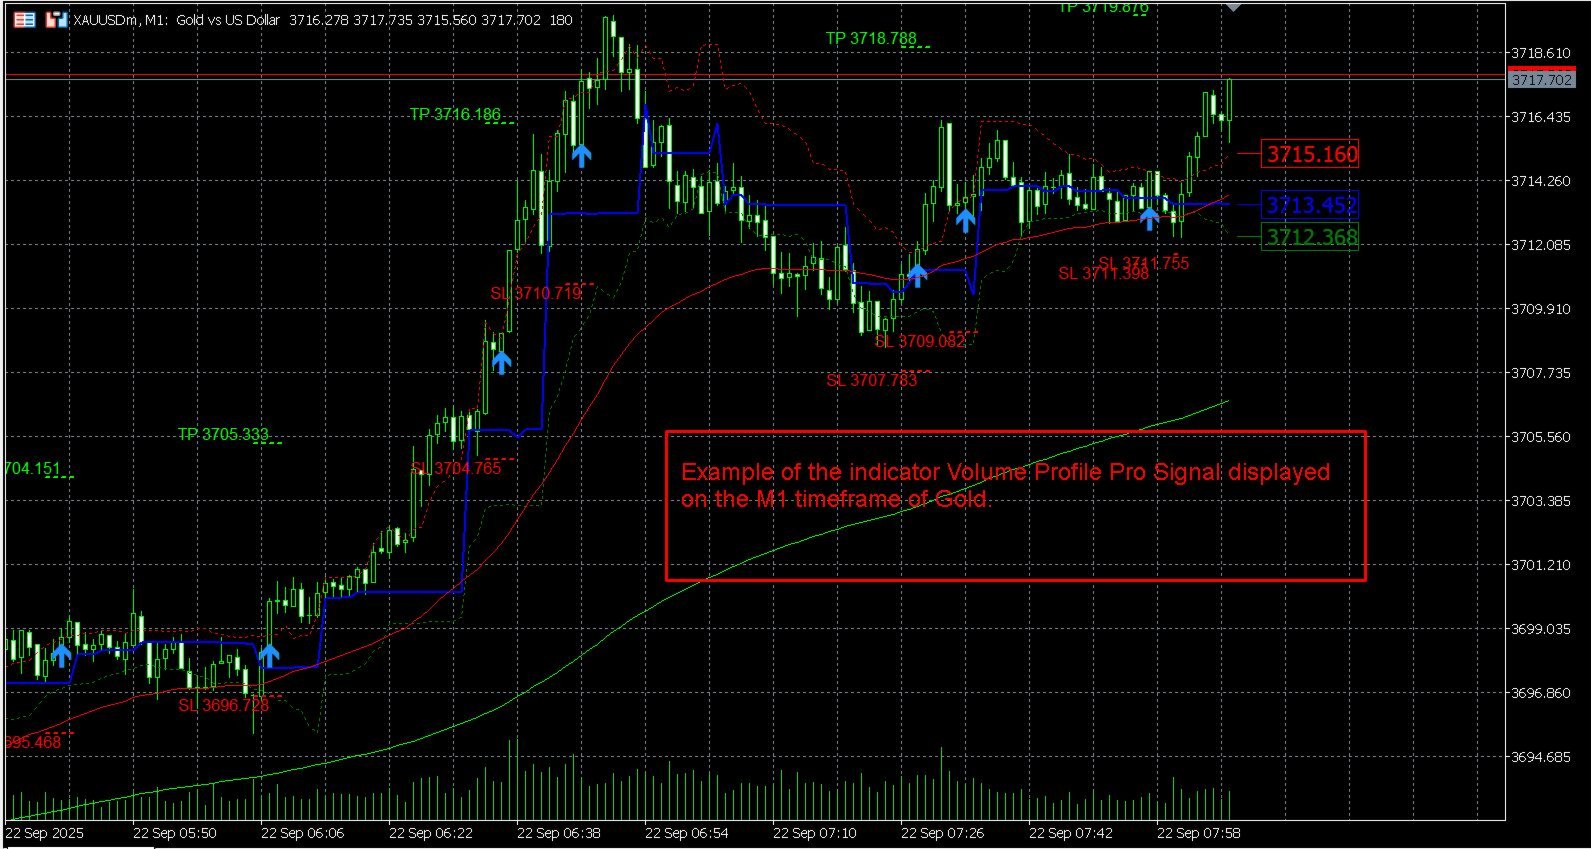
マルチタイムフレーム対応:複数チャートで効率よく動作。
実際の使い方
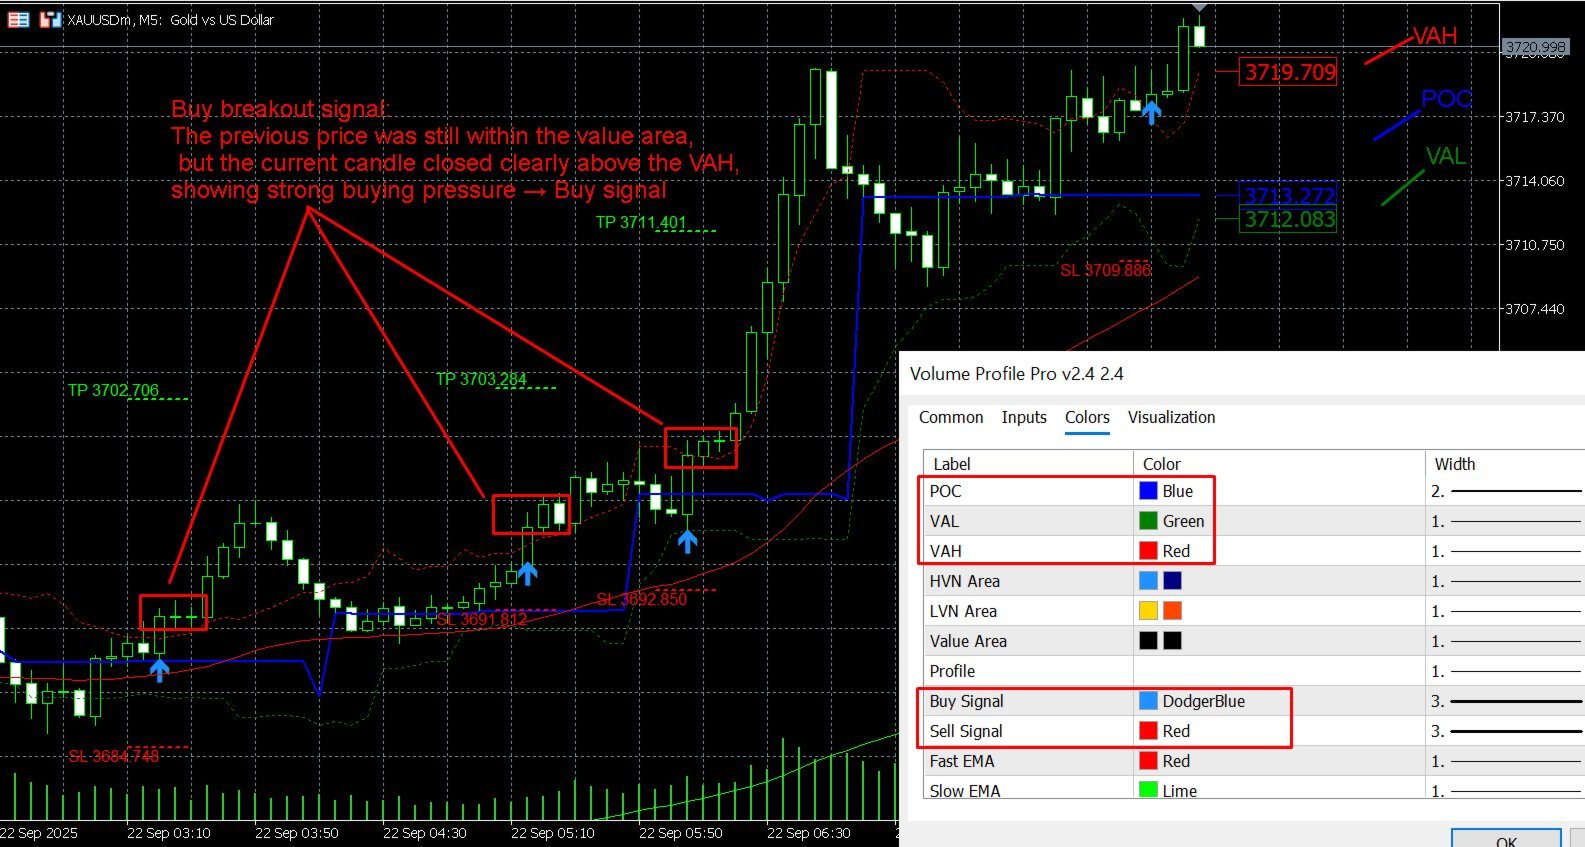
手動でプロファイルを描いたり出来高バーを監視する代わりに、インジケーターが動的なプロファイルを継続更新します。価格が VAH を超える/VAL を下回ると、選択した EMA フィルタの確認が取れた場合に Buy/Sell の矢印を描画し、SL/TP エリアを表示して popup/email/push で通知できます。
軽量設計でメモリ負荷が小さく、複数チャート同時稼働時でも安定しています。
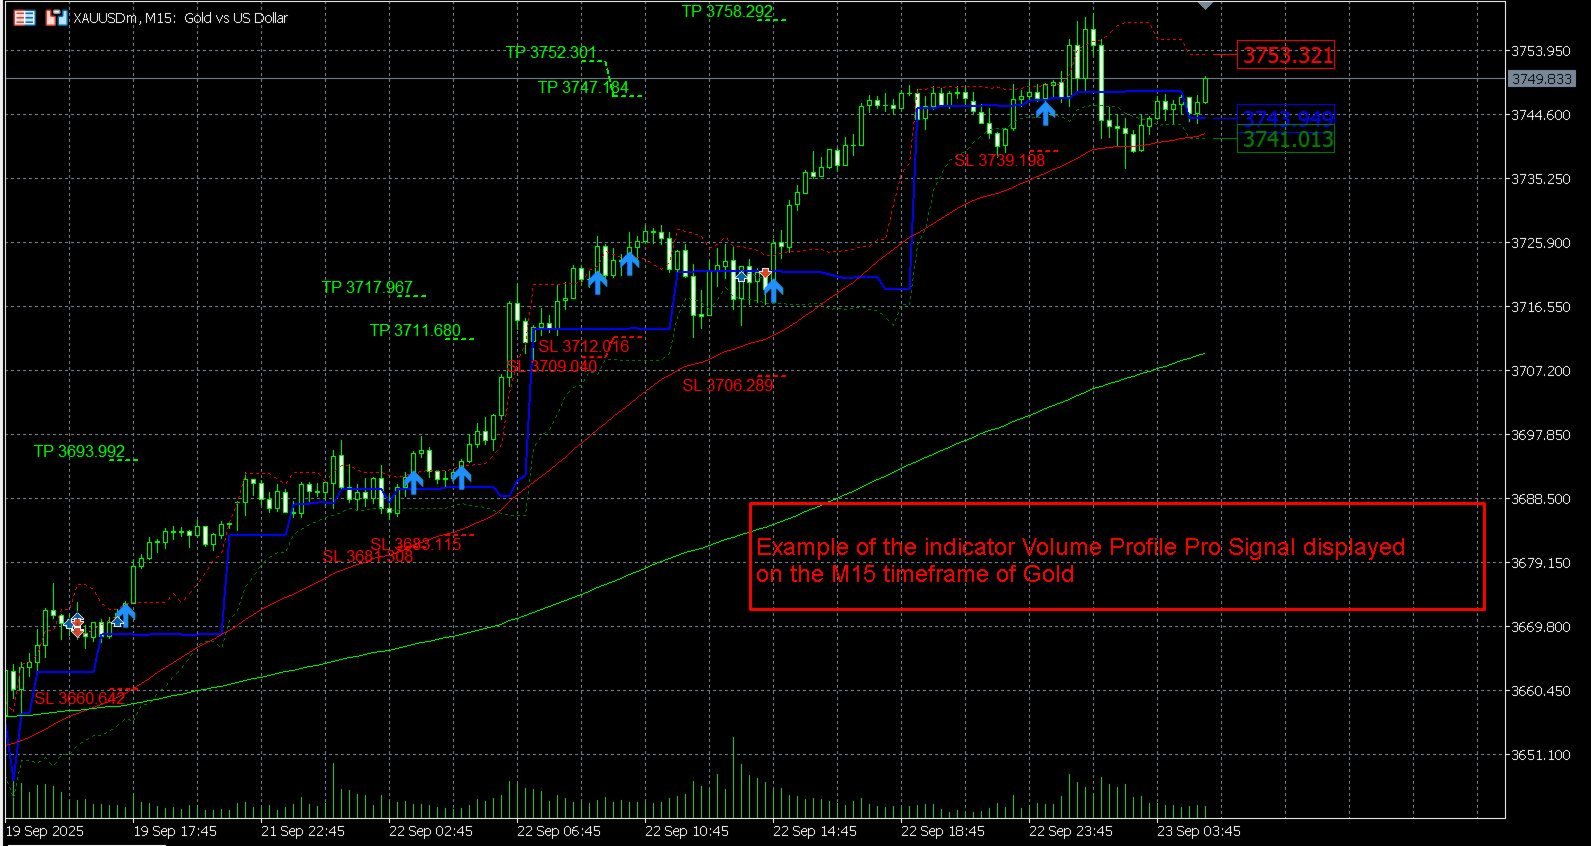
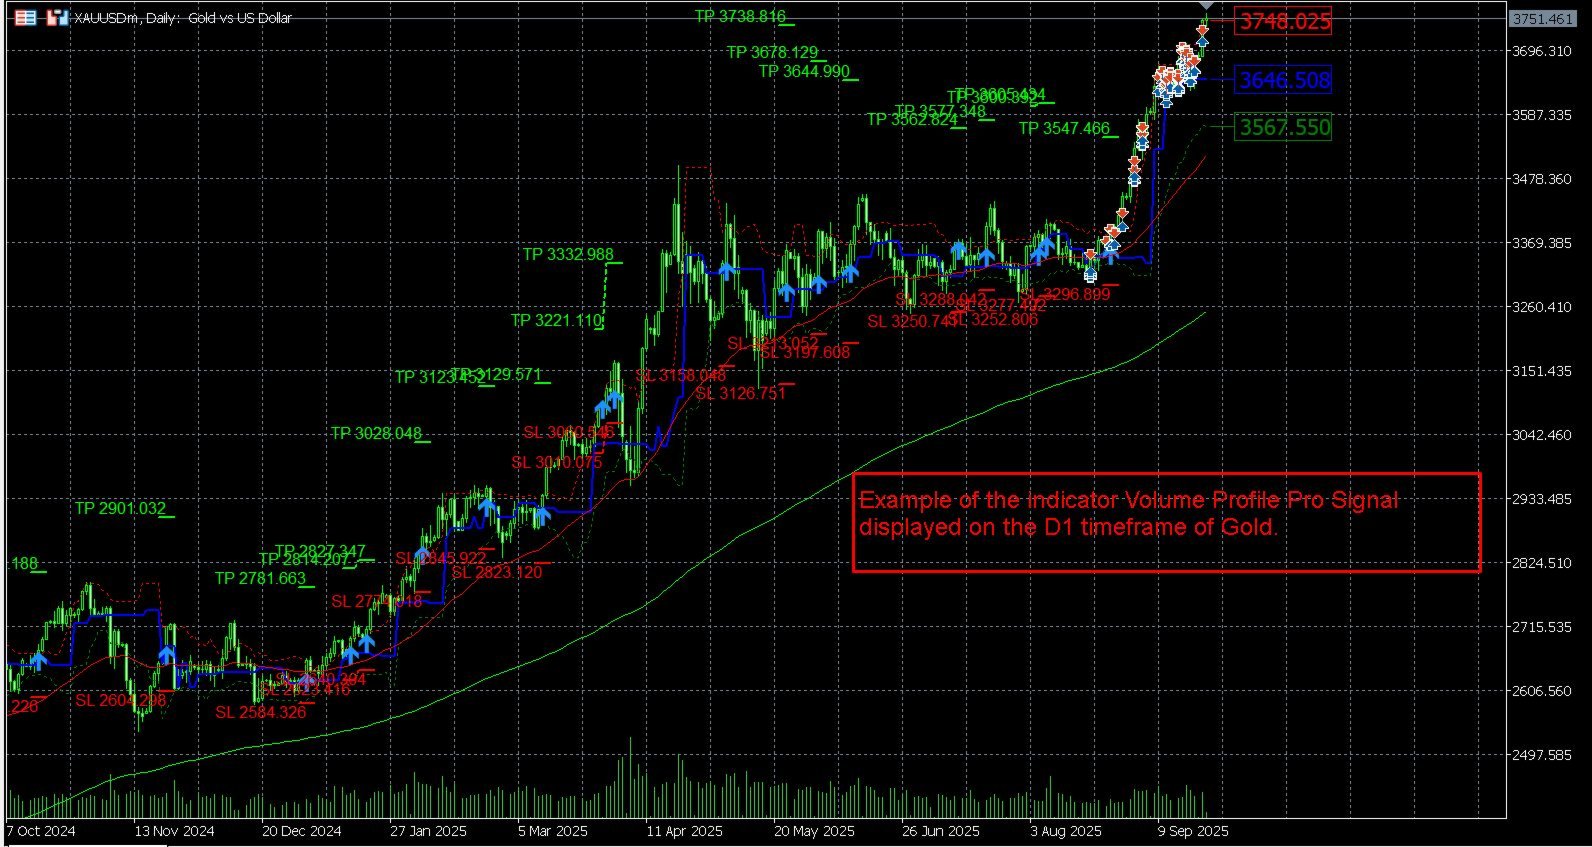
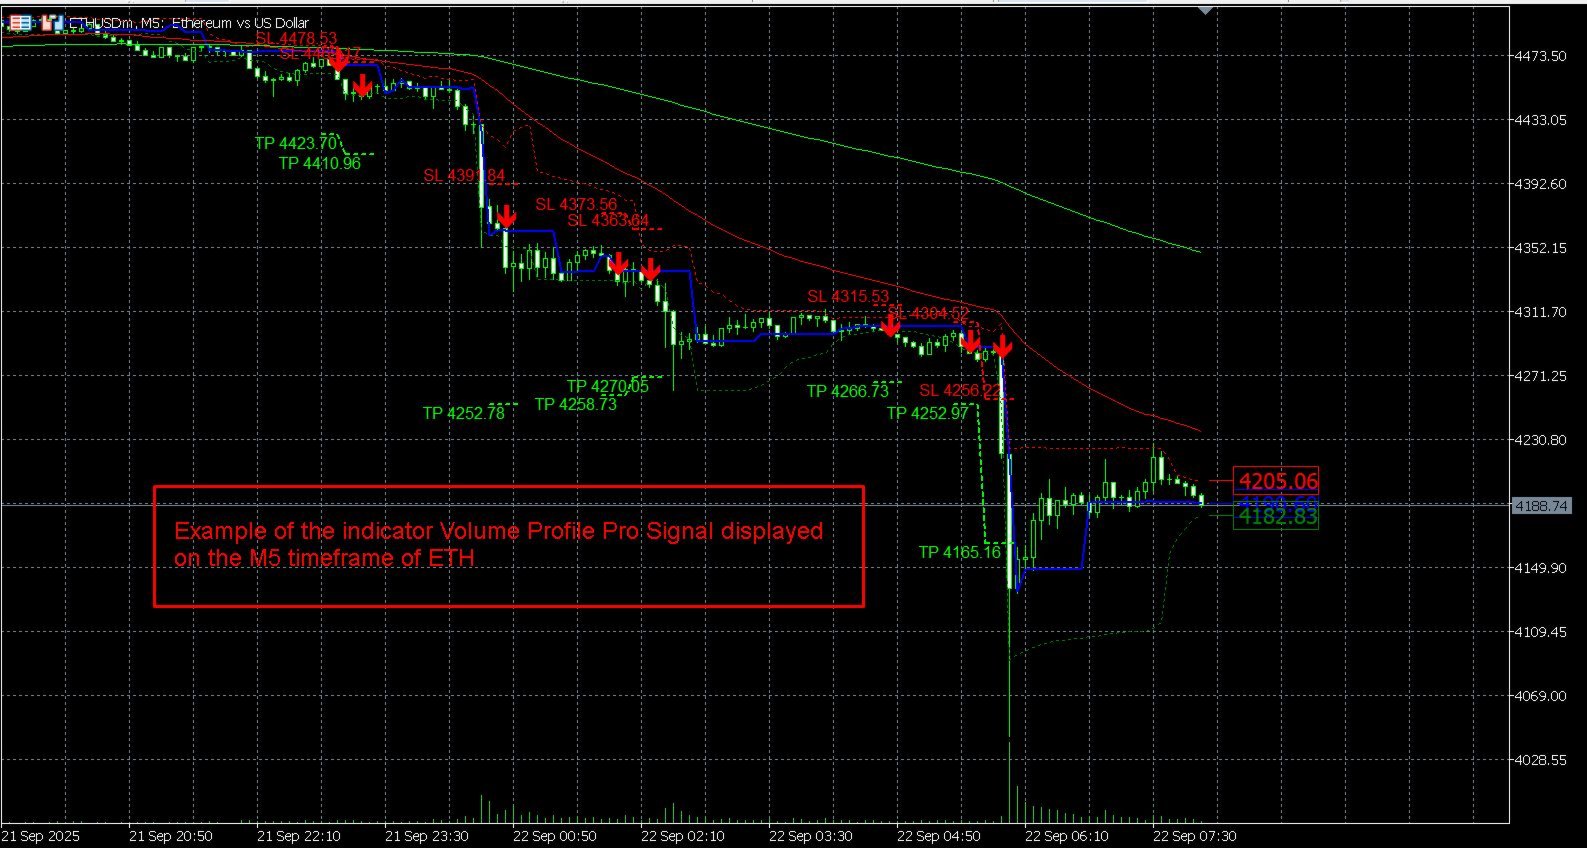
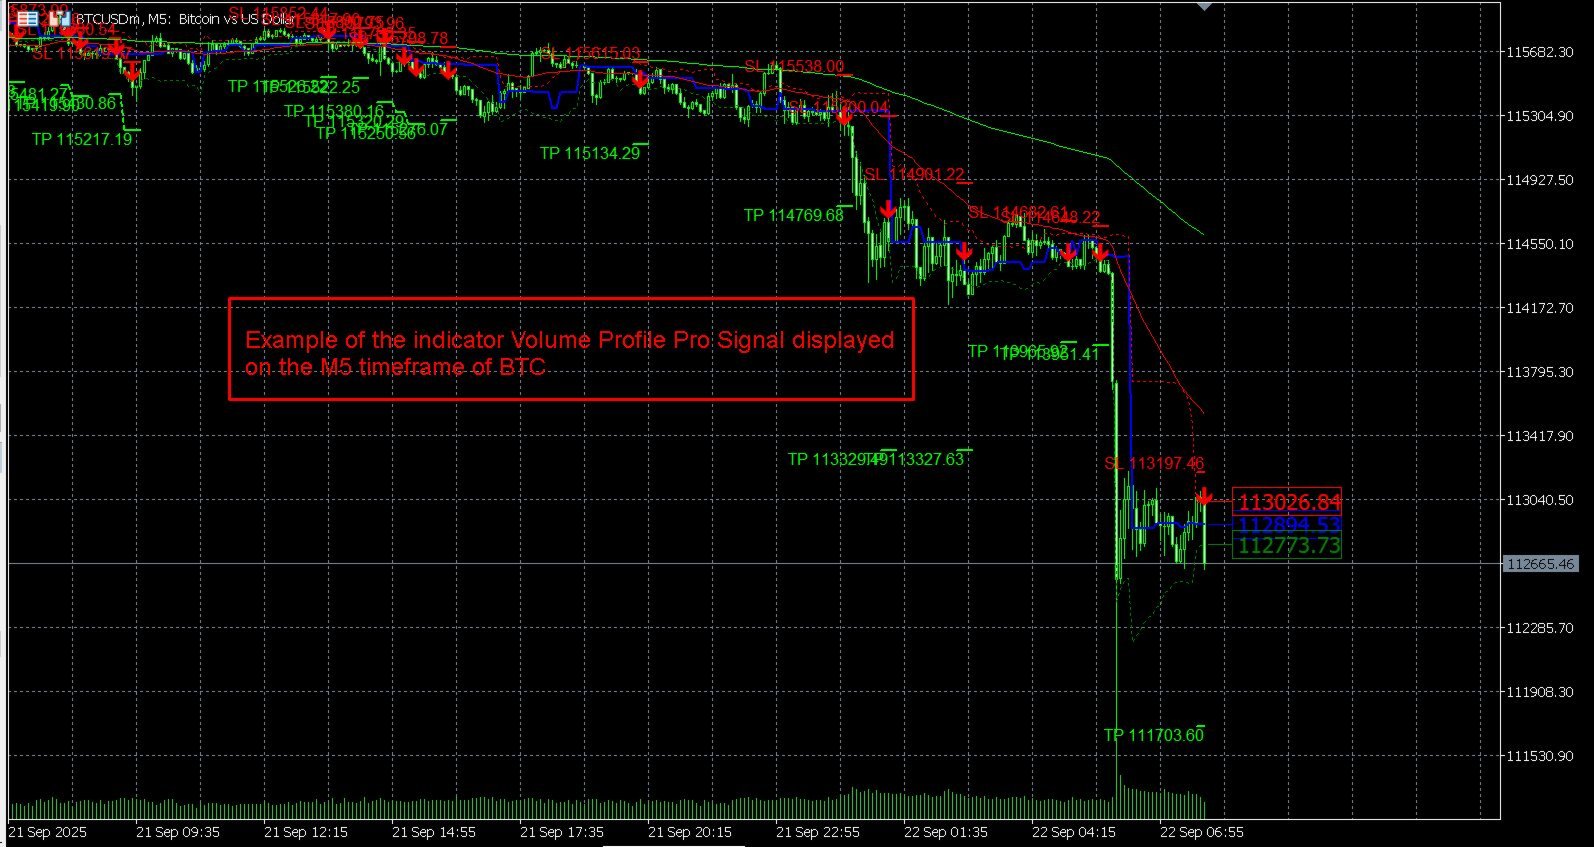
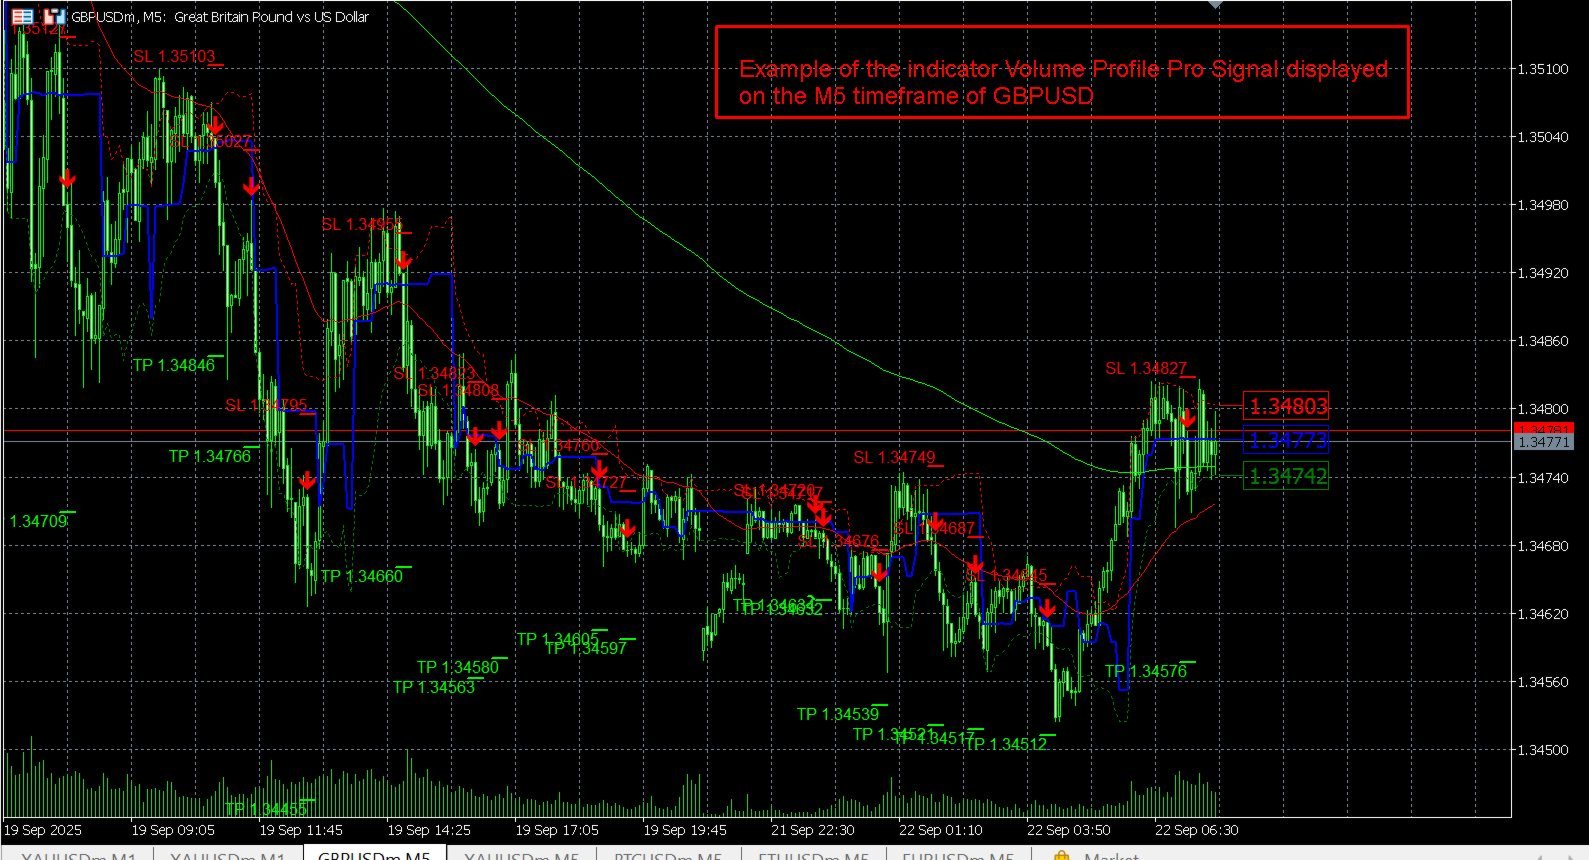
実例
M5 で 20 バーのプロファイルを監視。EMA トレンドが強気の中で価格が VAH を突破。インジケーターは新しい POC を描画し、チャート上に緑色の Buy 矢印と ATR ベースの SL/TP を表示します。VAL 下抜けでは逆のロジックでショートシグナルが出ます。
数分で設定
-
インジケーターをチャートにアタッチ。
-
ProfilePeriods、ValueAreaPercent、ATR パラメータを調整。
-
フィルタ(Fast/Slow/Trend EMA、POC slope)を有効/無効。
-
通知をオンにし、テンプレート保存。
推奨タイムフレーム
-
スキャルピング: M1–M15
-
スイング: H1–D1
カスタマイズ項目
プロファイル密度、ビン数、Value Area 比率;POC/VAH/VAL/HVN/LVN 線の色・太さ;SL/TP ラベル表示の切替;アラート管理と出来高フィルタを分けて設定。
差別化ポイント
多くのボリュームツールはバー単位の出来高を表示するのみですが、本インジケーターは価格レンジ毎に構造化して表示します。内蔵のシグナルロジックにより、単なる分析を超えた意思決定支援となります。
サポート
-
クイックガイド及びスクリーンショットは製品ページに掲載。
-
技術的な質問は MQL5 メッセージ経由で作者へ連絡してください。
最終注記
Volume Profile Pro Signals は、出来高構造・トレンド確認・自動リスク指標を一つの視覚フレームで統合したいトレーダーに最適です。