Volume Profile Pro Signals
- 指标
-
Van Minh Nguyen
 Hello! I'm an independent EA developer with a passion for algorithmic trading and automated systems. I specialize in building Expert Advisors and indicators for the MetaTrader platform, with a focus on reliability, performance, and user-friendly design. I’m here to share quality trading tools and
 - 版本: 3.1
- 更新: 26 二月 2026
- 激活: 10
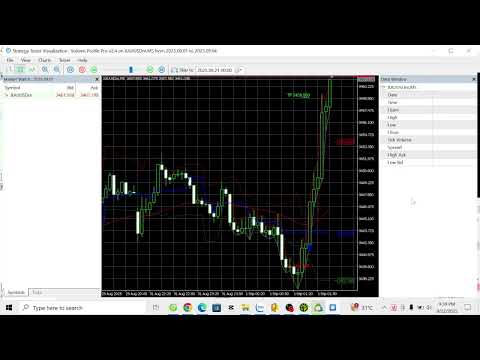
Volume Profile Pro Signals
精确的量价分析与自动信号生成相结合。
功能概述
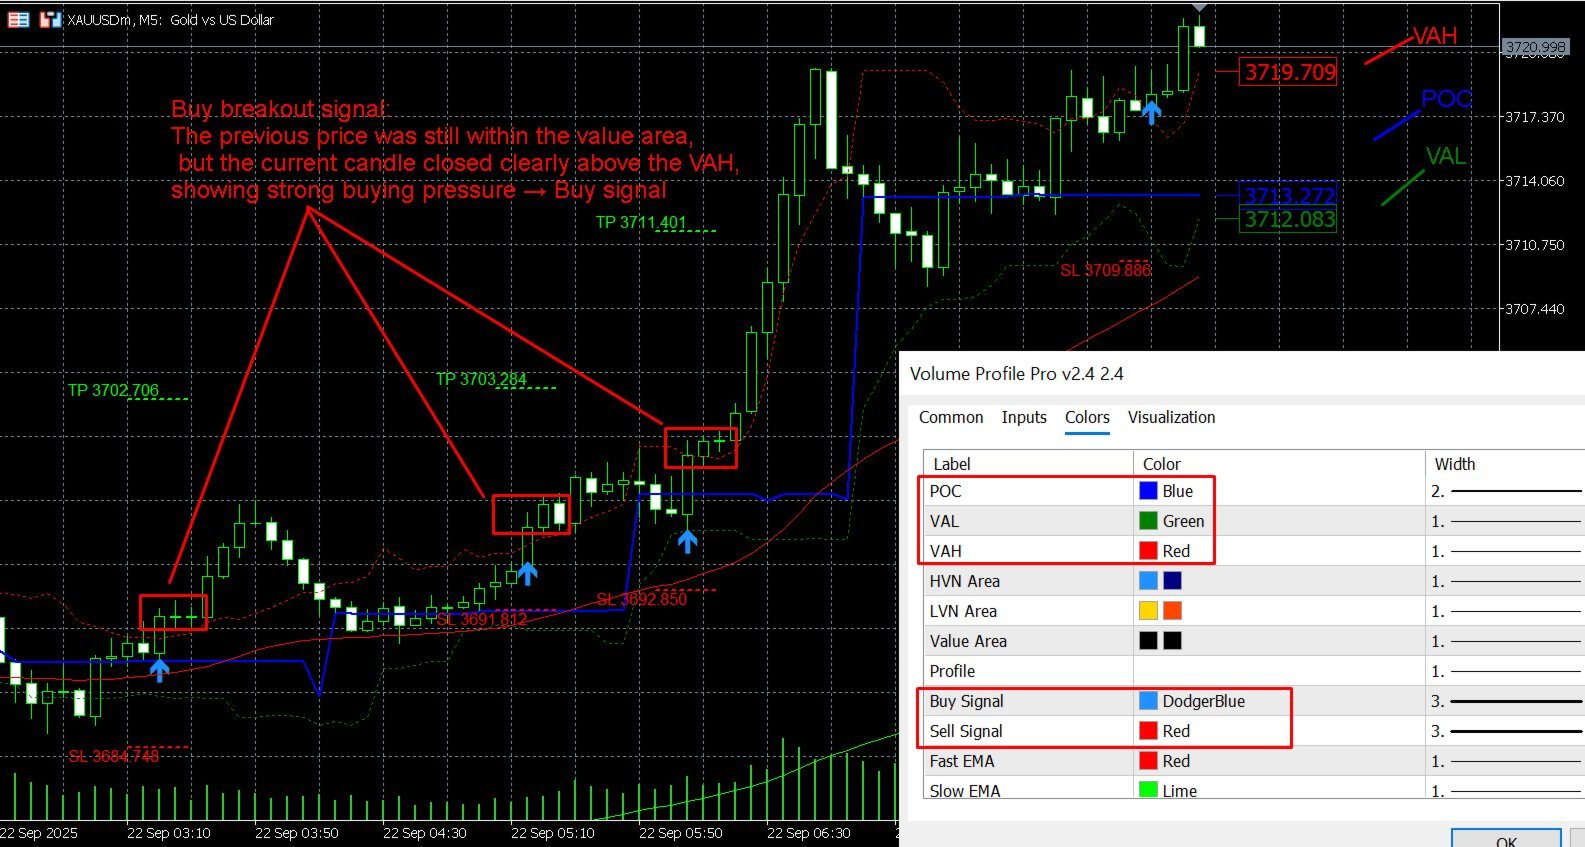
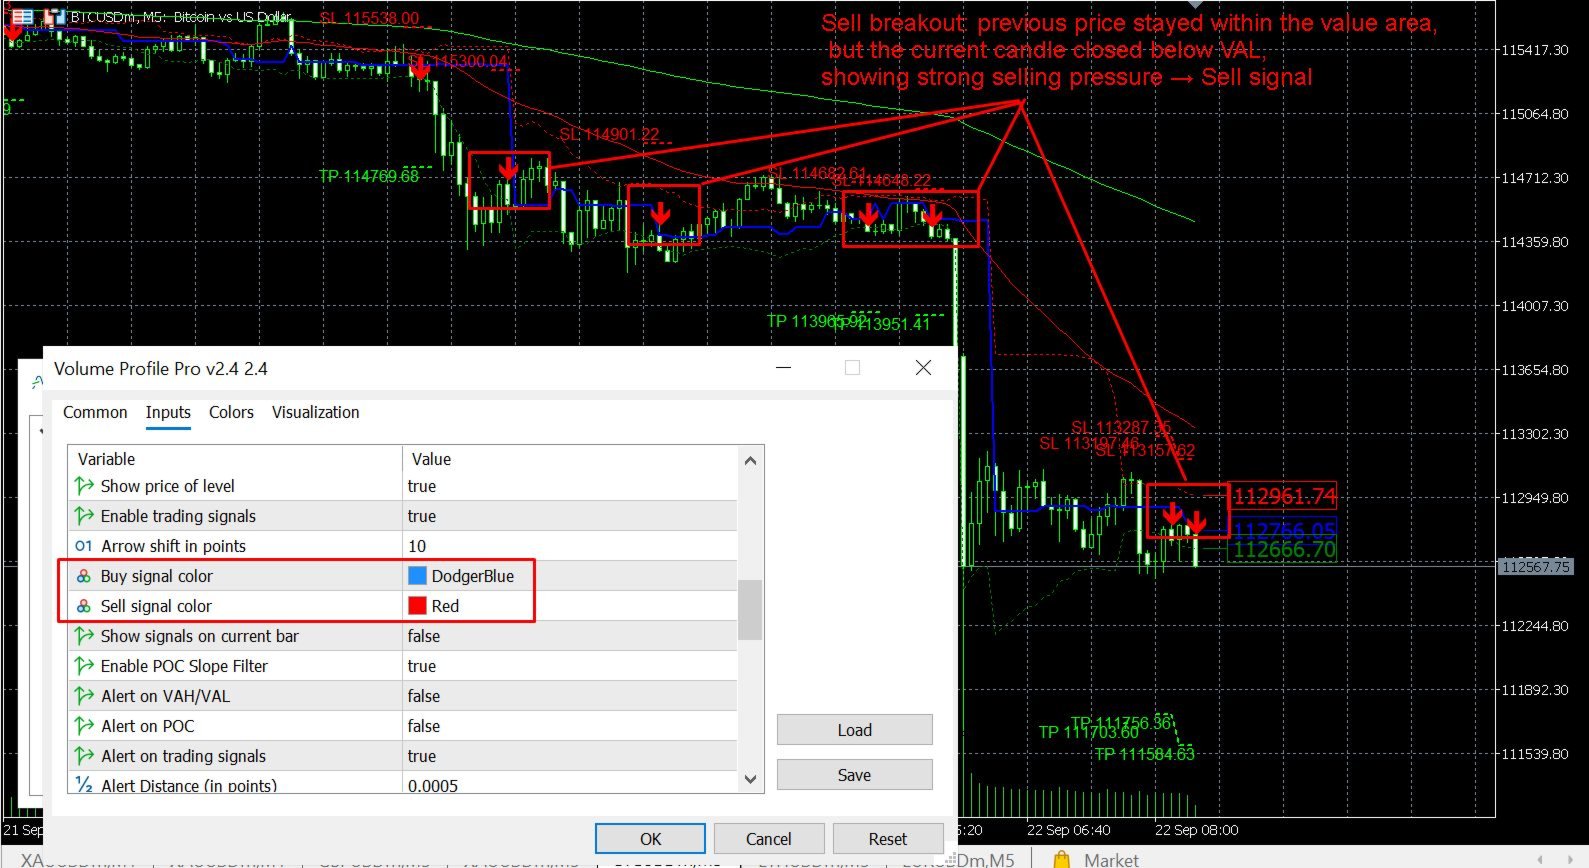
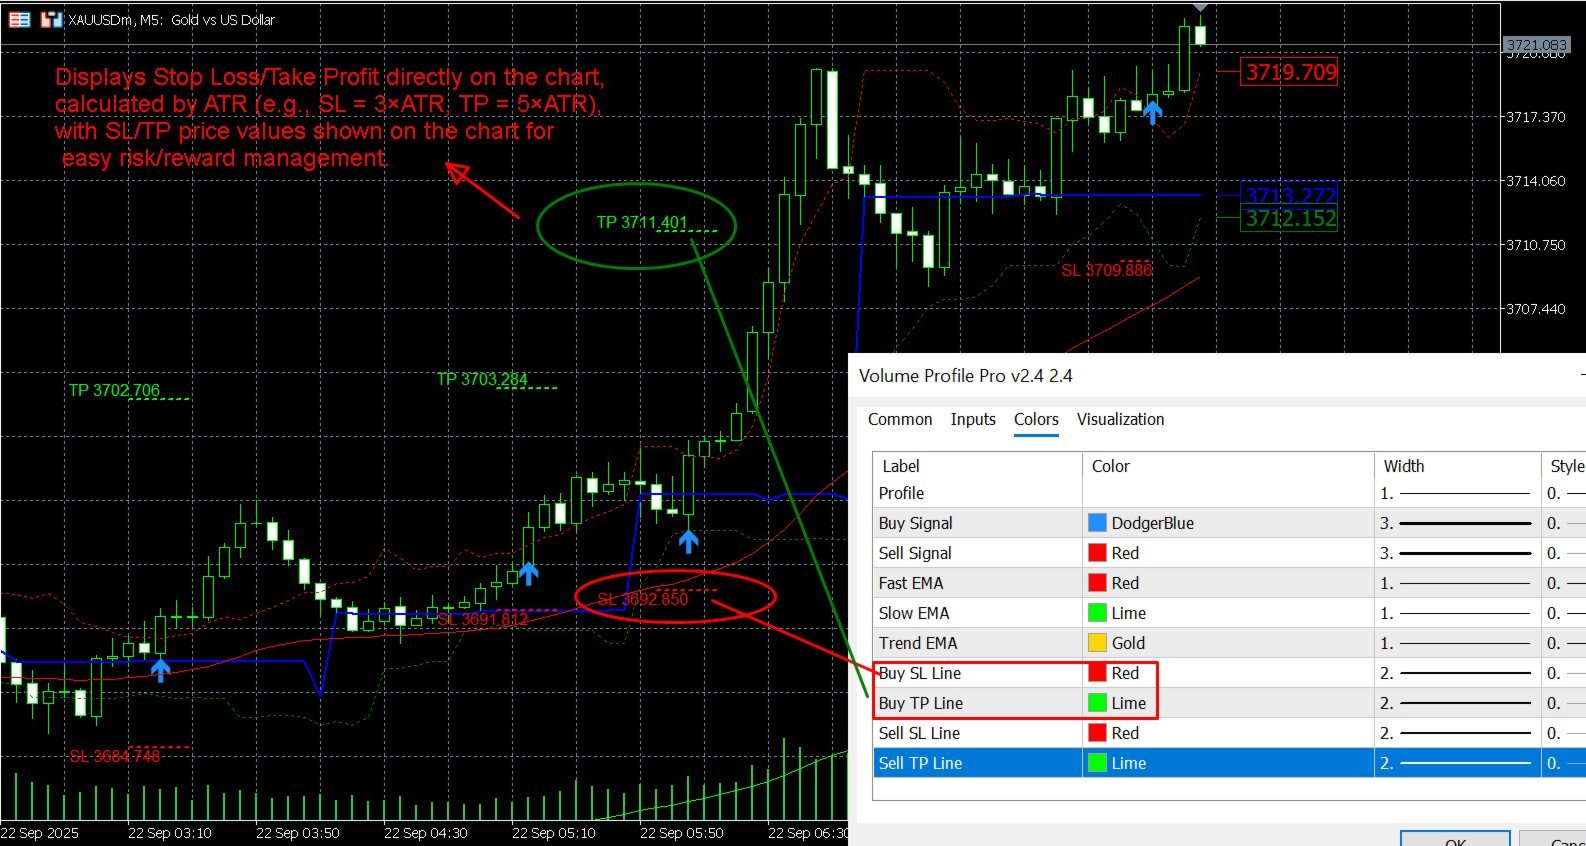
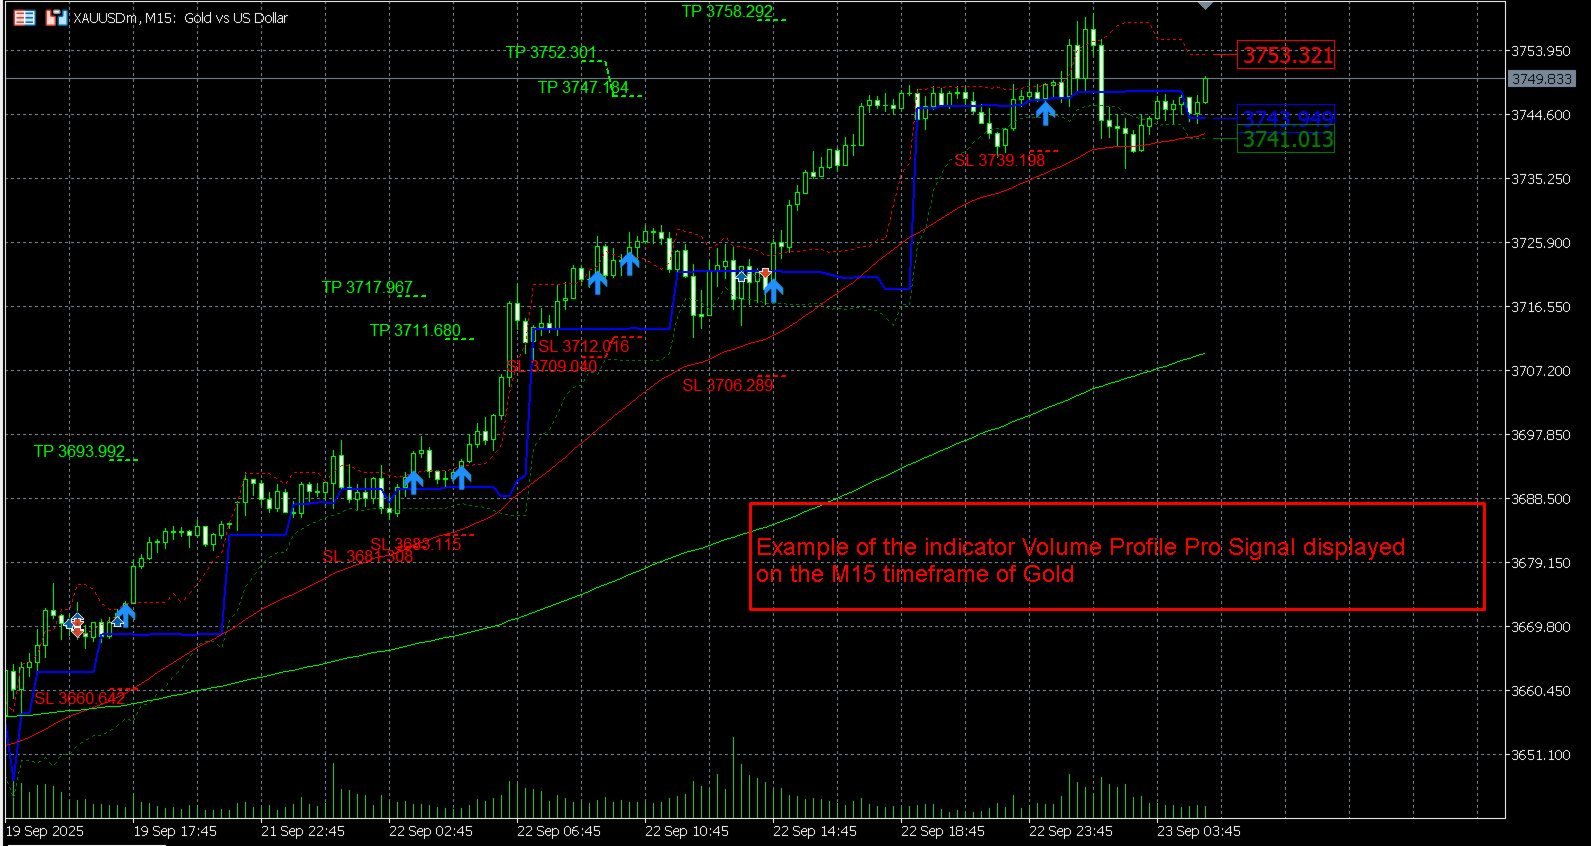
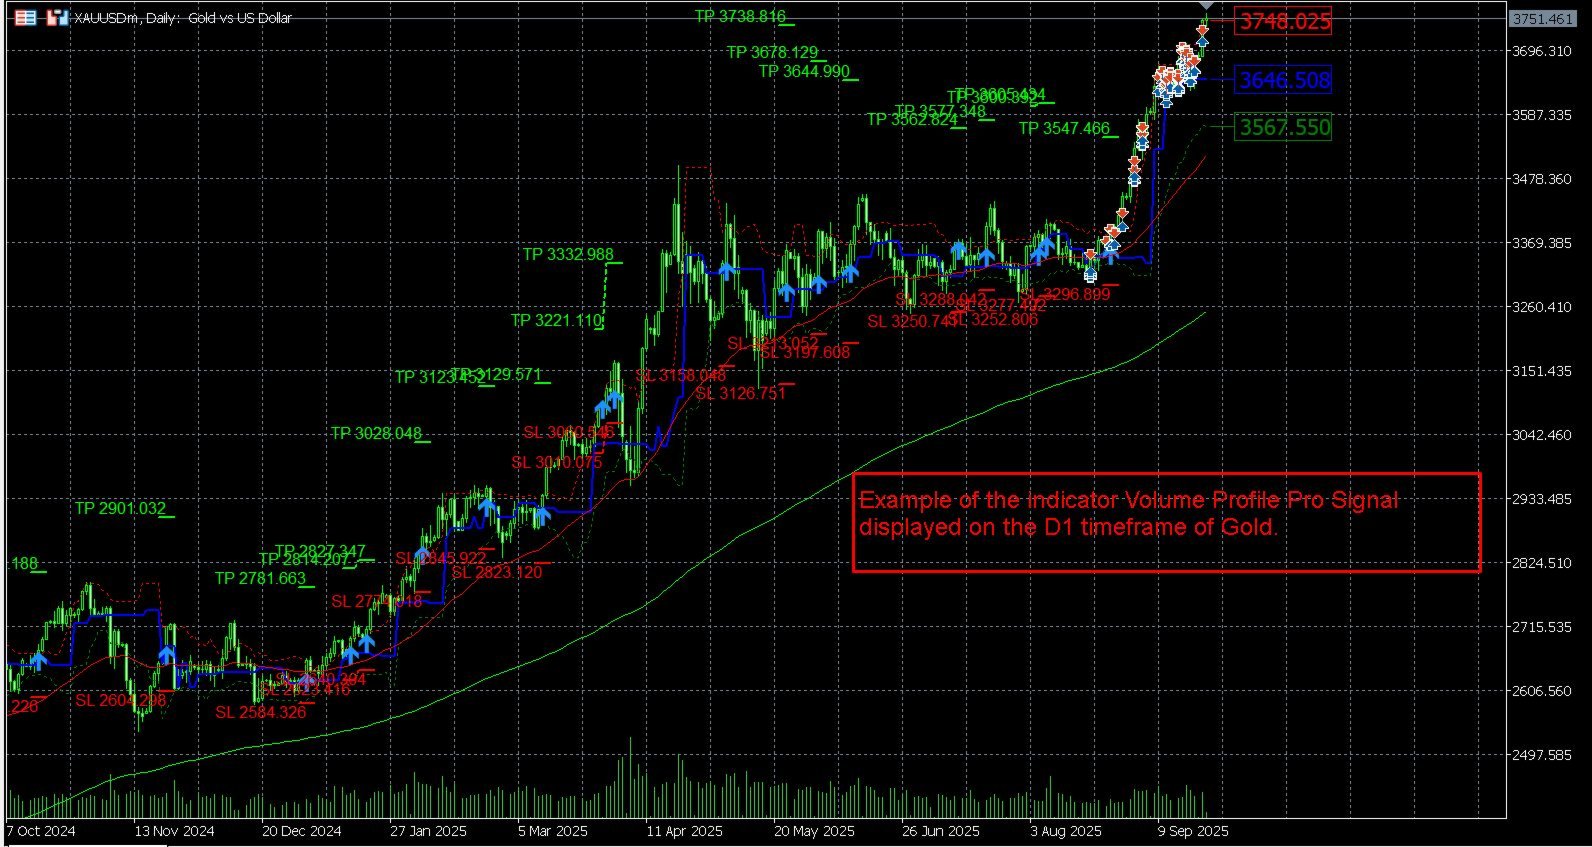
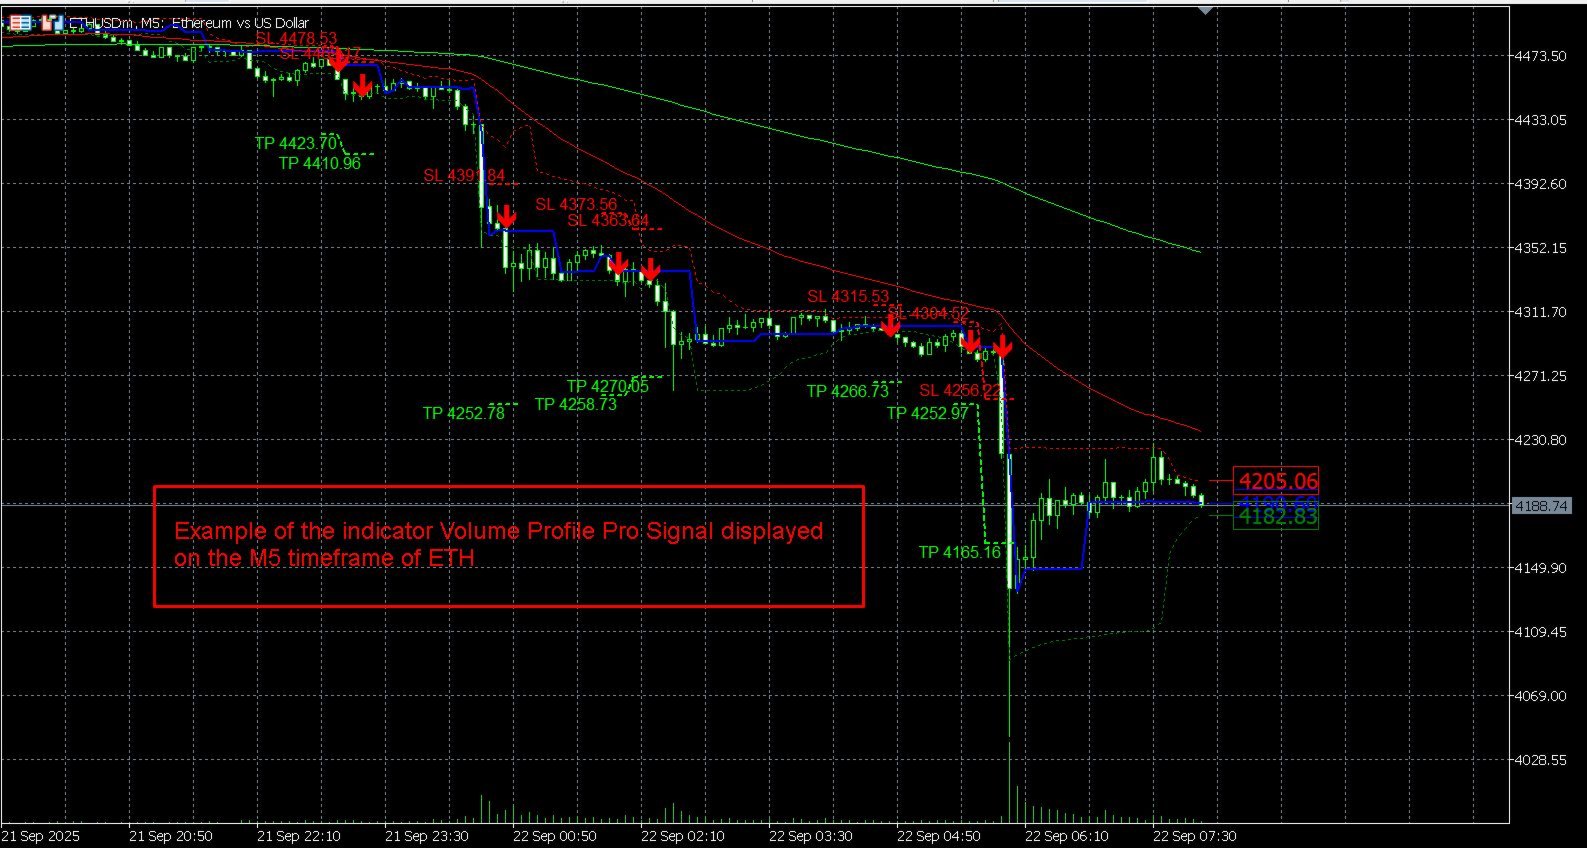
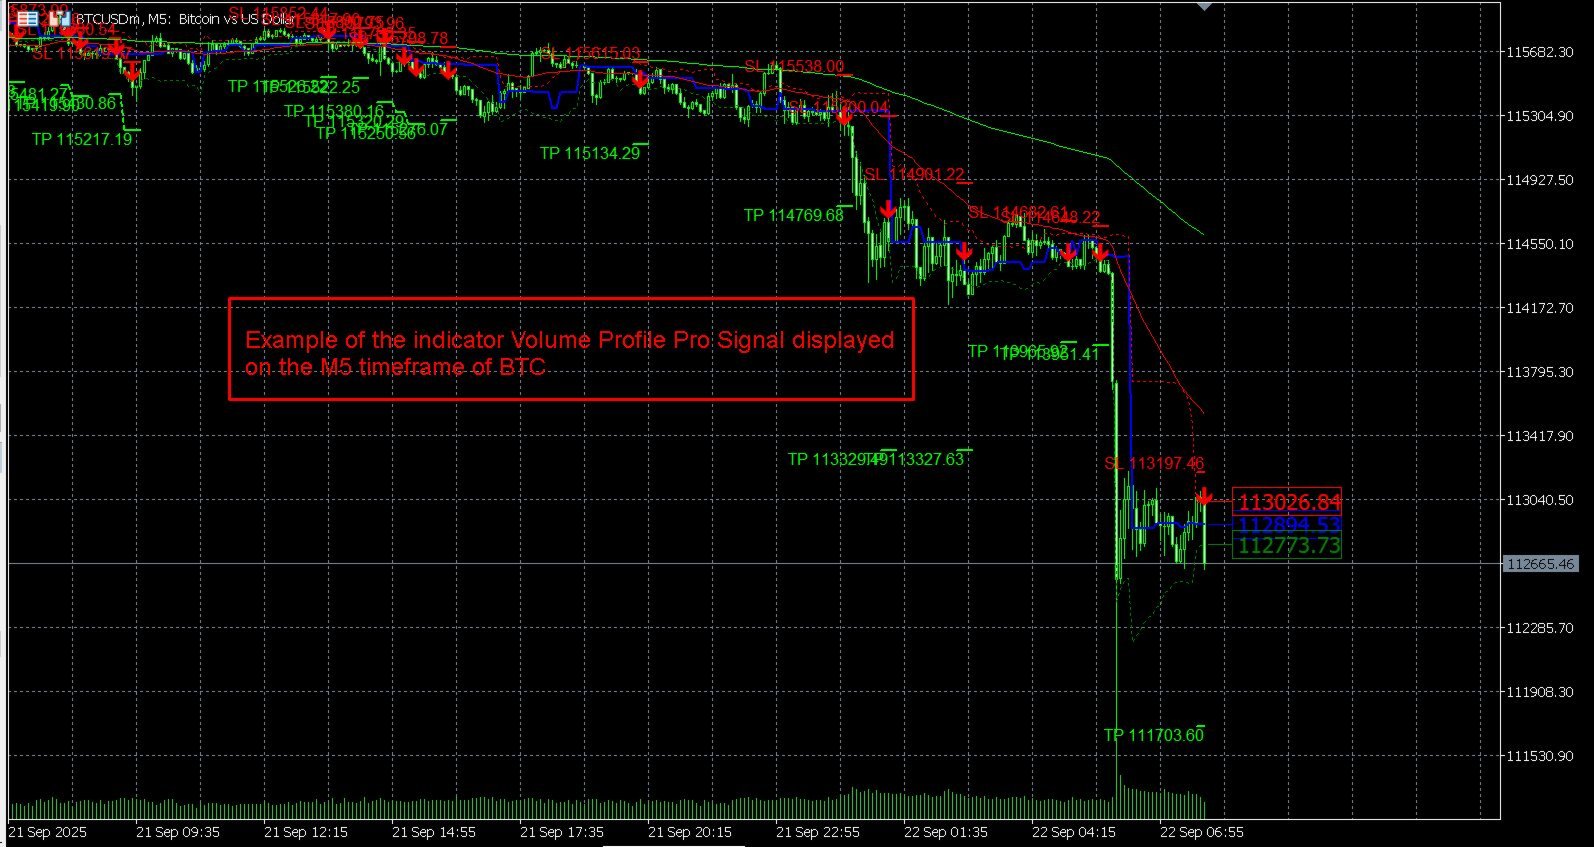
Volume Profile Pro Signals 构建实时、数据驱动的量价分布图,揭示价格被接受或拒绝的市场区域。它高亮显示 POC、VAH、VAL,并精准识别 HVN/LVN 区域。在此基础上生成实时的 VAH/VAL 突破信号,并根据 ATR 波动性绘制智能 SL/TP 水平。
所有设置 —— 从剖面分辨率到提醒方式 —— 均可调整以适配你的交易风格,无论是快速抢短线还是多日持仓的波段交易。
核心亮点
-
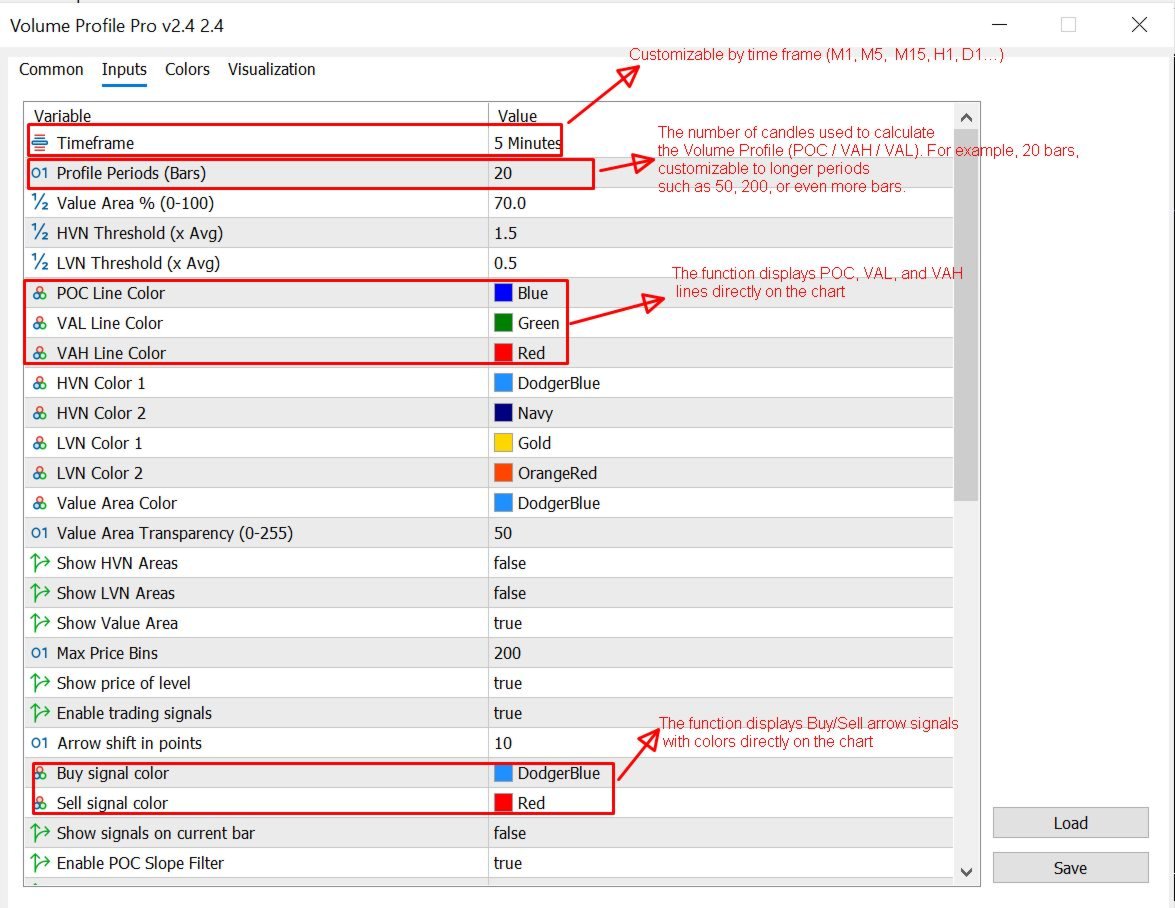
按价位的成交量洞察:在 MT5 图表上直观绘制 Point of Control 和 Value Area。
-
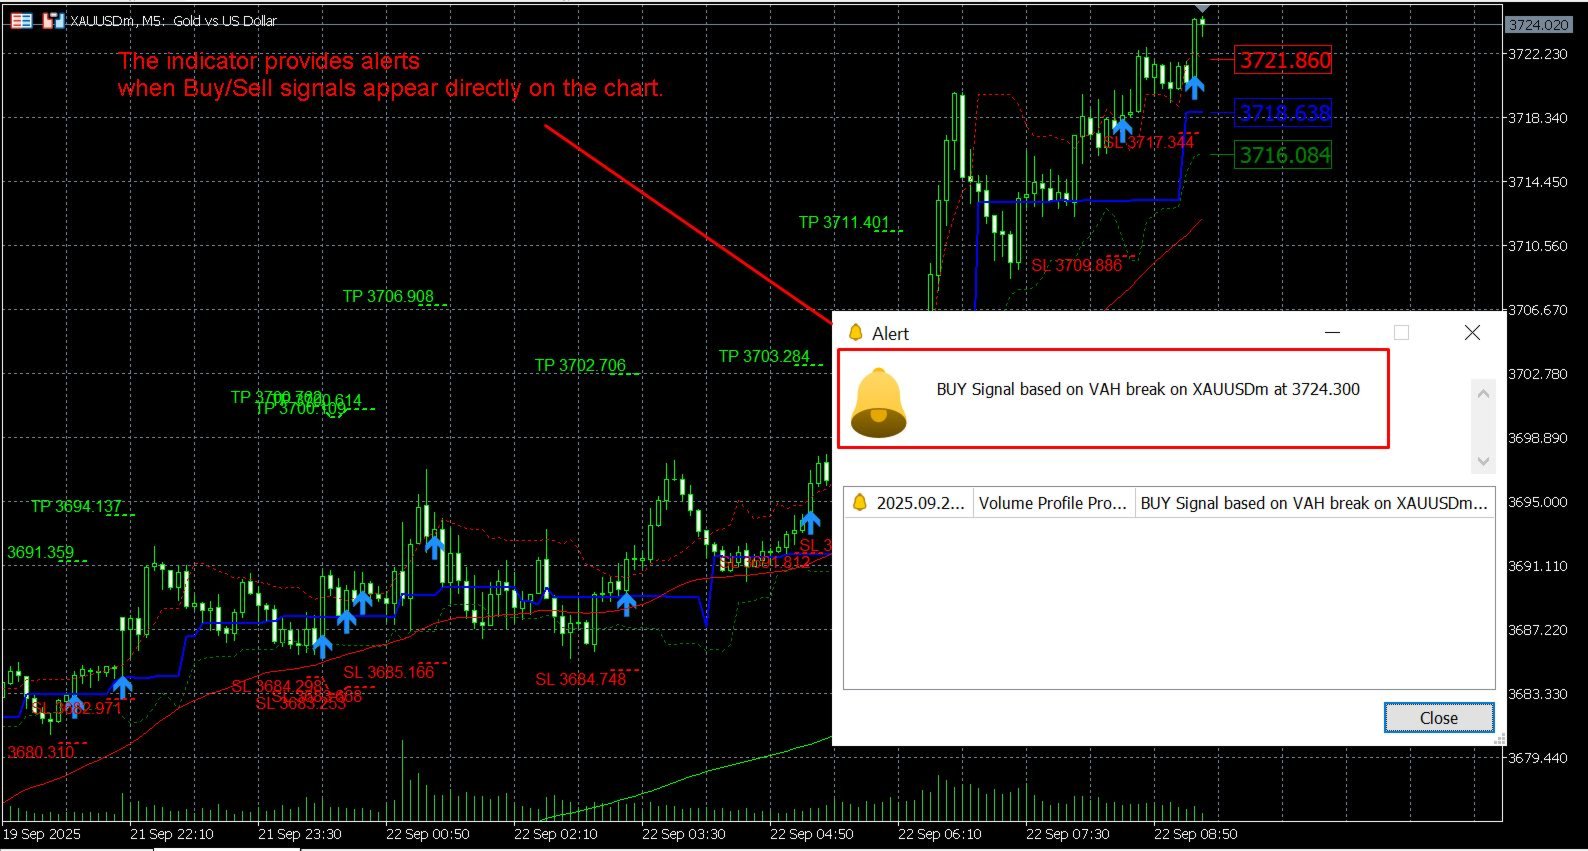
突破提醒:当价格收盘超过 VAH 或跌破 VAL 时即时发出信号。
-
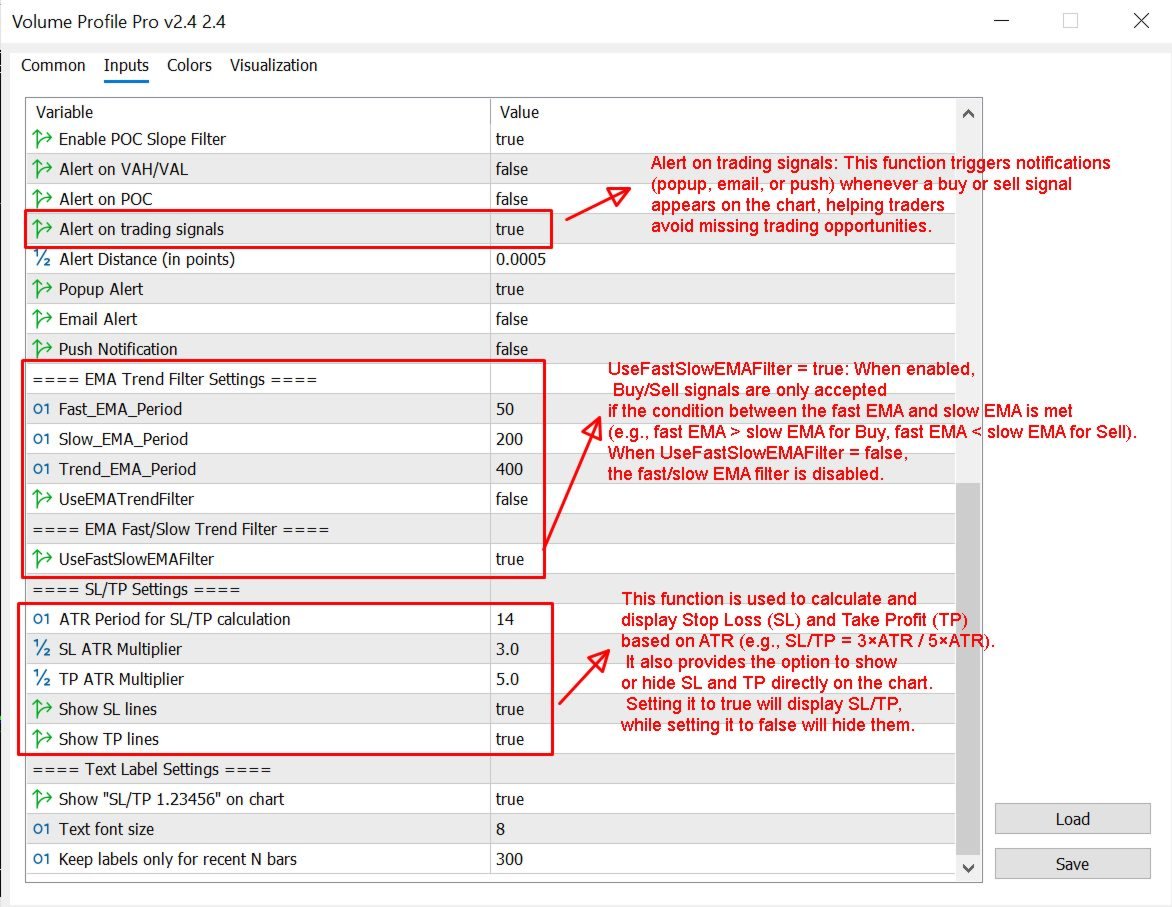
自适应风险水平:基于 ATR 自动计算的止损与止盈。
-
智能过滤:EMA 趋势过滤器与可选的 POC 斜率确认减少误报。
-
HVN/LVN 识别:区分高活跃与低量区,提供更明确的交易背景。
-
多时间框架兼容:可在多个图表和时间框架上高效运行。
使用场景
指标持续更新市场的动态剖面,无需手动绘制或单独查看成交量柱。当价格突破 VAH 或 VAL,且所选 EMA 过滤器确认时,指标会绘制明确的买/卖箭头、定义 SL/TP 区域,并可通过弹窗、邮件或推送通知你。
该工具设计轻量、节省内存,即便在多图同时运行也能保持稳定。
实战示例
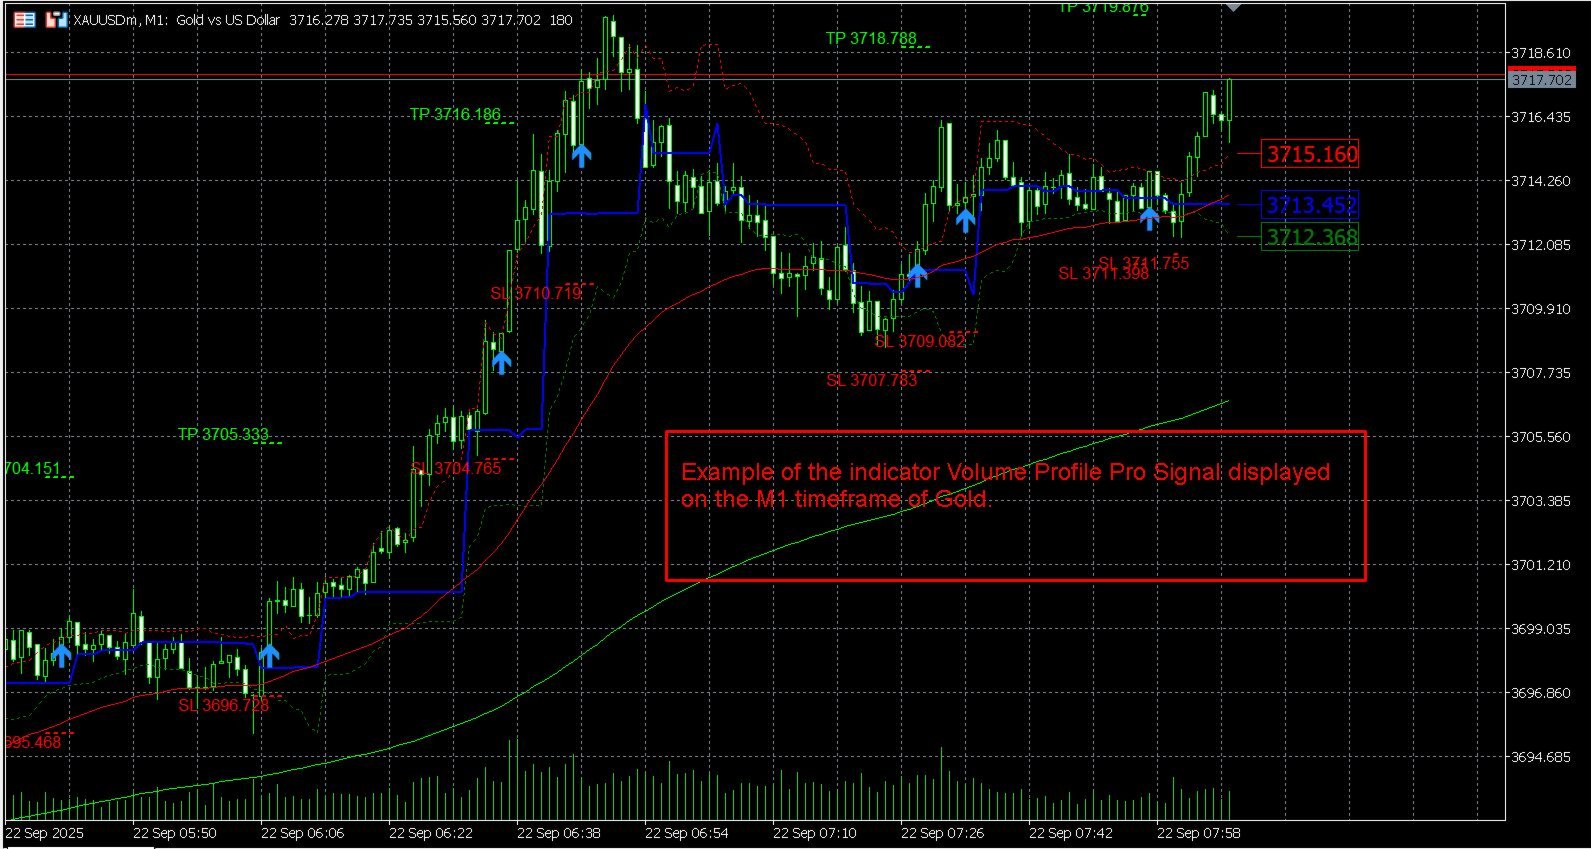
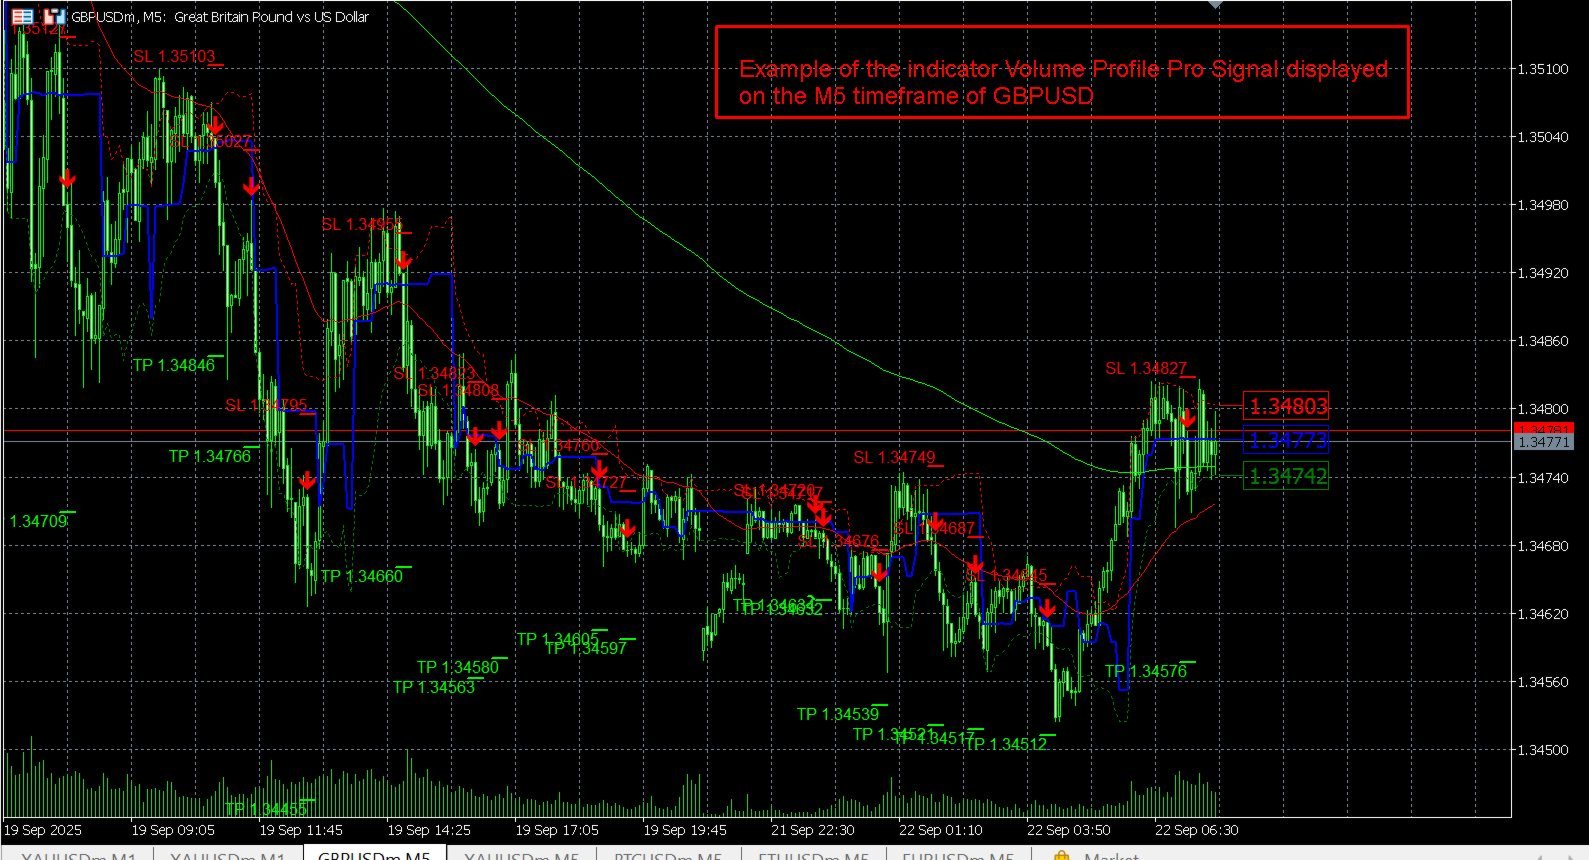
交易者在 M5 上使用 20 根柱的 profile。价格在 EMA 趋势看涨时突破 VAH。指标绘制新的 POC,并在图表上显示绿色买入箭头及基于 ATR 的 SL/TP。相同逻辑适用于价格跌破 VAL 的卖出情形。
快速设置
-
将指标附加至目标图表。
-
调整 ProfilePeriods、ValueAreaPercent 与 ATR 参数。
-
启用/禁用过滤器:Fast/Slow/Trend EMA、POC slope。
-
打开所需通知。
-
保存模板以便重复使用。
推荐时段
-
短线/剥头皮:M1–M15
-
波段:H1–D1
可定制项
剖面密度、箱数、Value Area 百分比;POC/VAH/VAL/HVN/LVN 线的颜色与宽度;SL/TP 文本标签开关;告警与成交量过滤单独设置。
独特之处
多数成交量工具仅显示按柱的成交量。Volume Profile Pro Signals 将这些信息组织为清晰的结构区间,让交易者看见市场真正重视的价格位置。结合内置信号逻辑,它不仅是分析工具,更是决策支持。
支持
-
产品页含快速指南和截图。
-
技术问题请通过 MQL5 消息联系作者。
结语
Volume Profile Pro Signals 适合那些希望将量价结构、趋势确认与自动化风险指引融合于单一可视化框架的交易者 — 无论是日内波动还是更长趋势,它都能为 MT5 图表带来专业级的清晰度。