Volume Profile Pro Signals

Volume Profile Pro Signals 
정밀한 볼륨 분석과 자동 신호 생성의 결합.

기능 요약
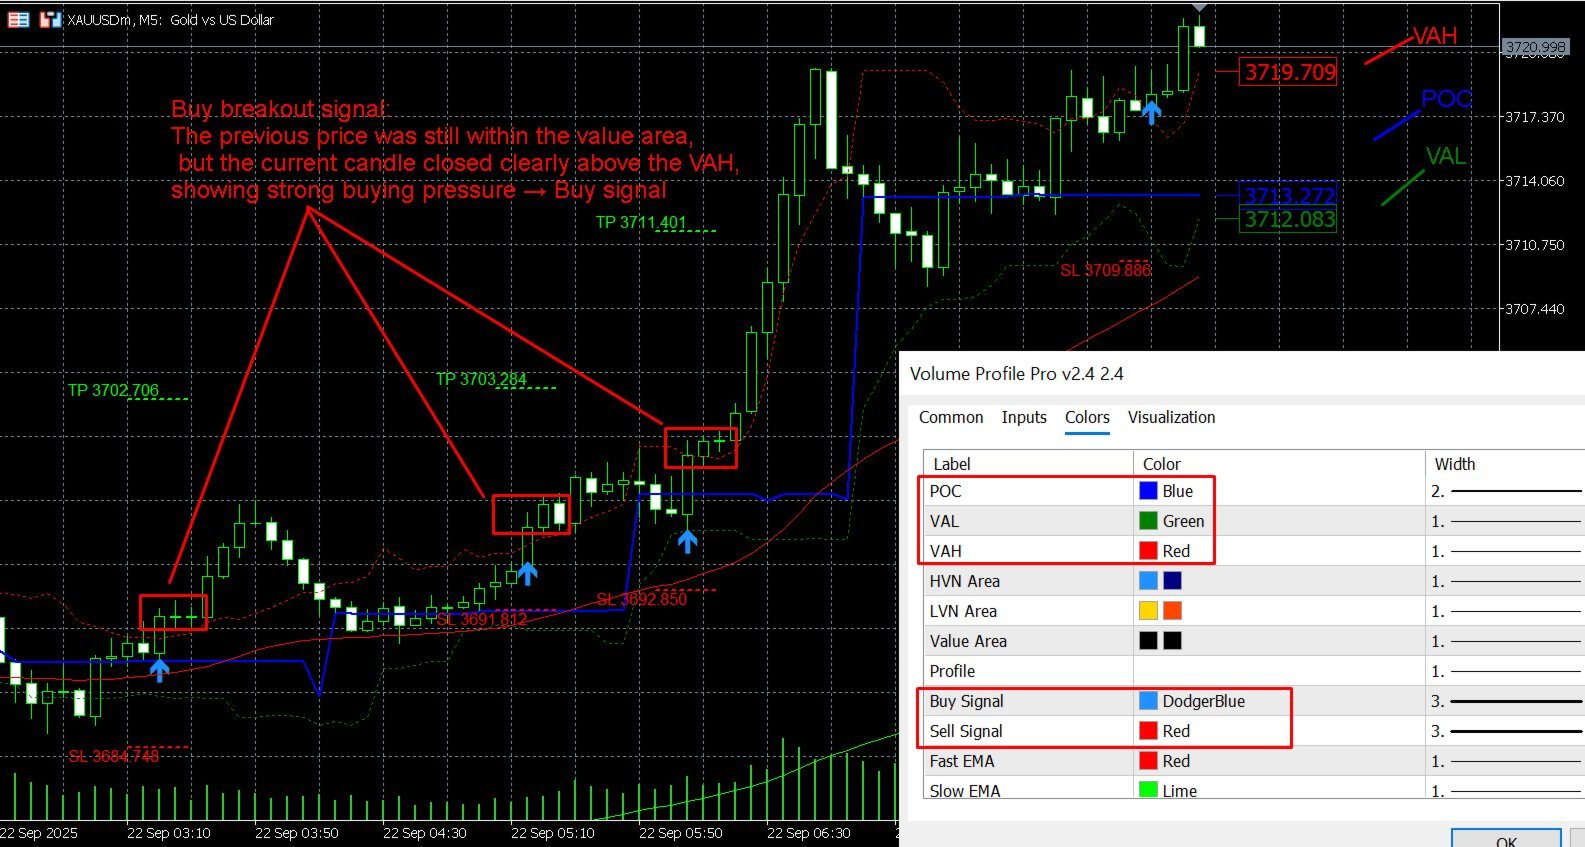
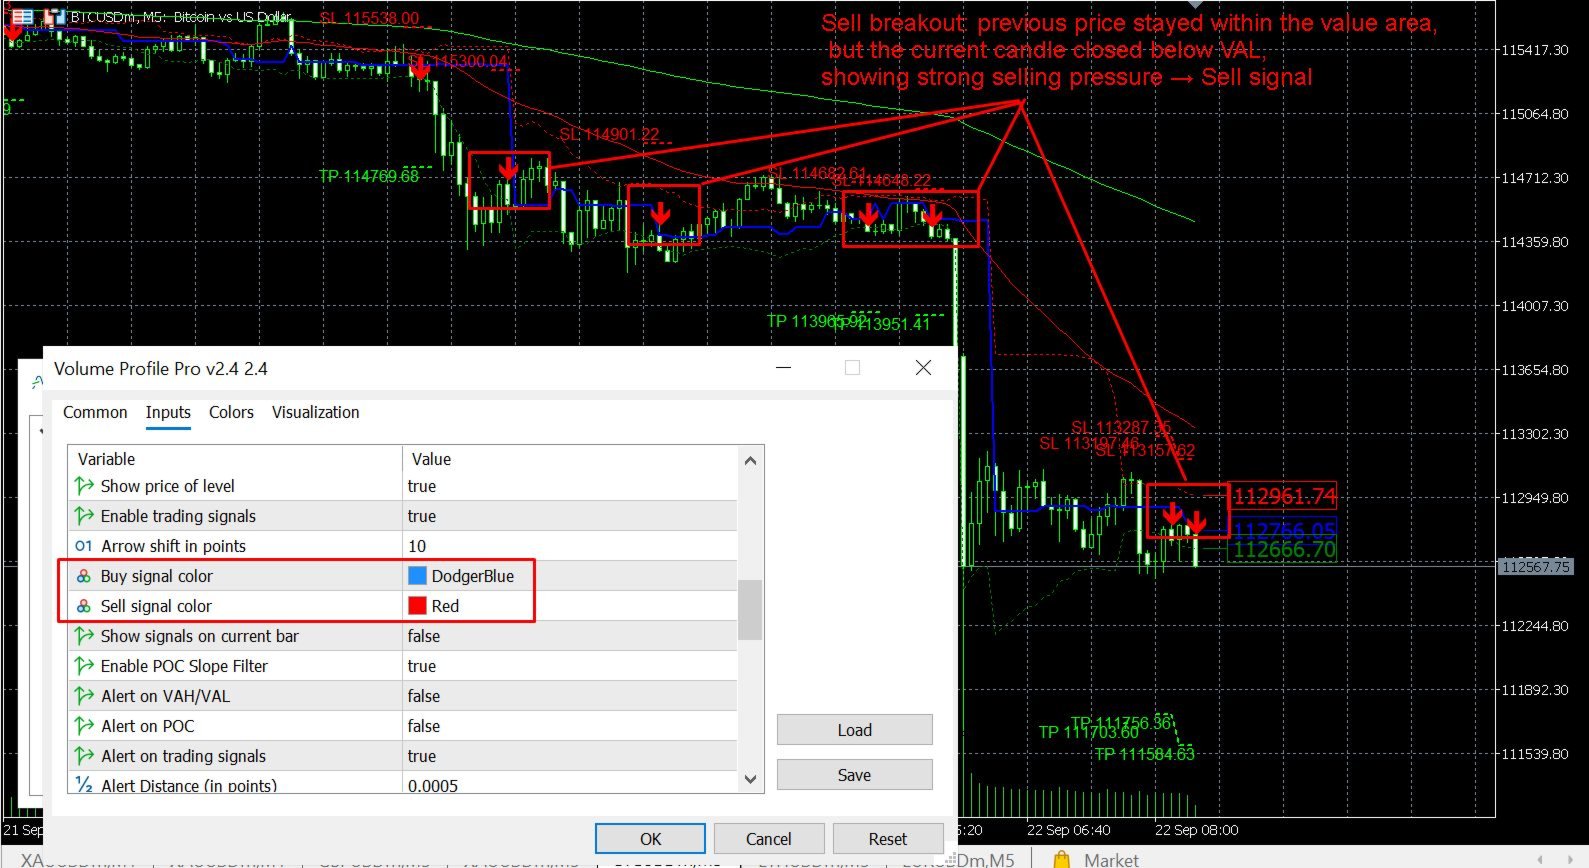
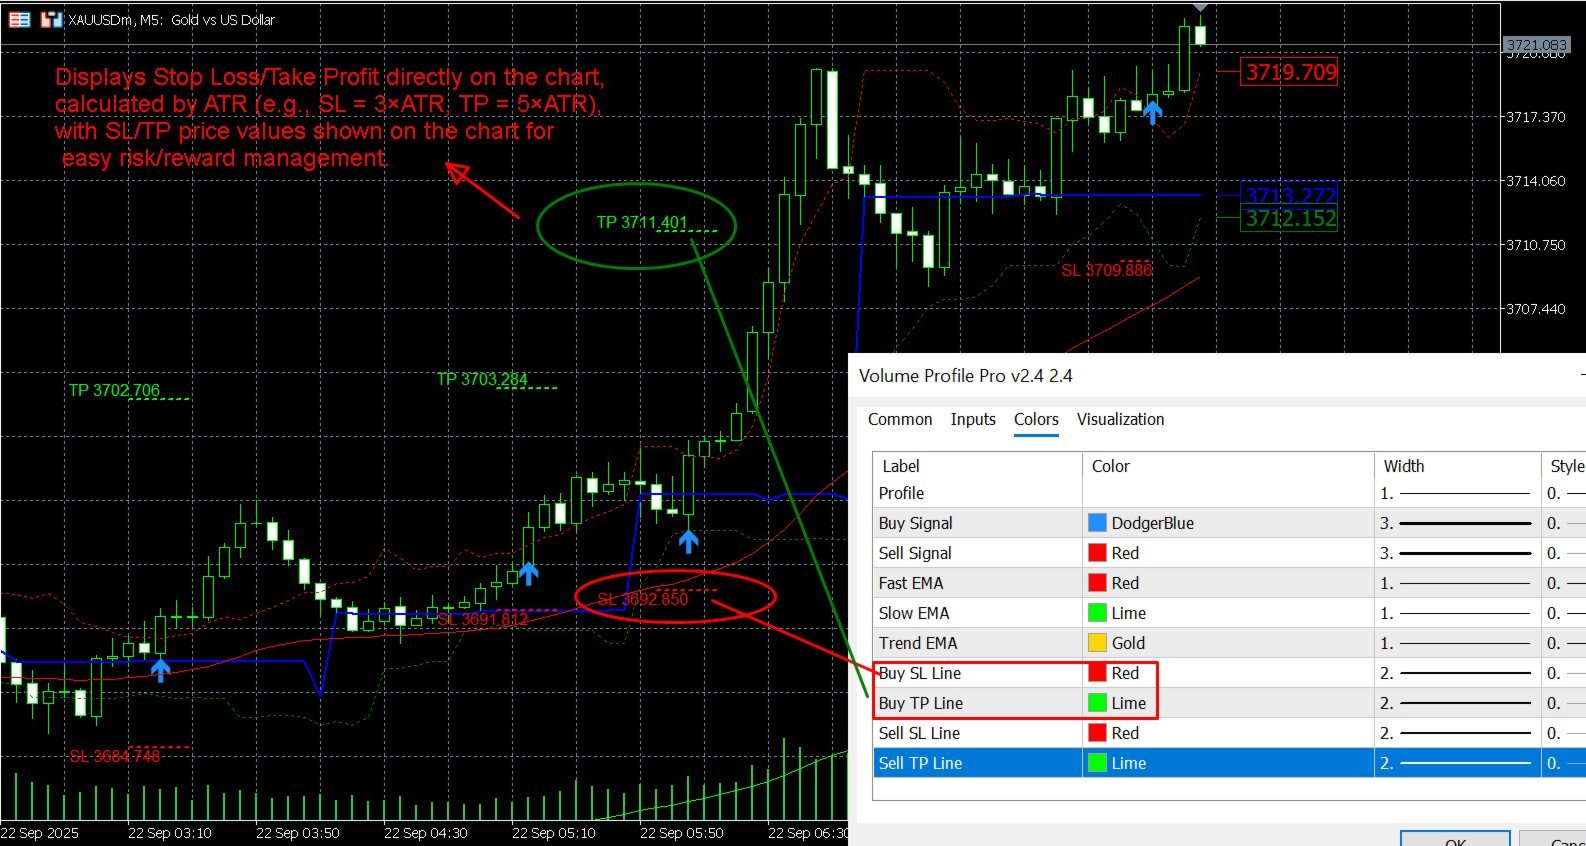
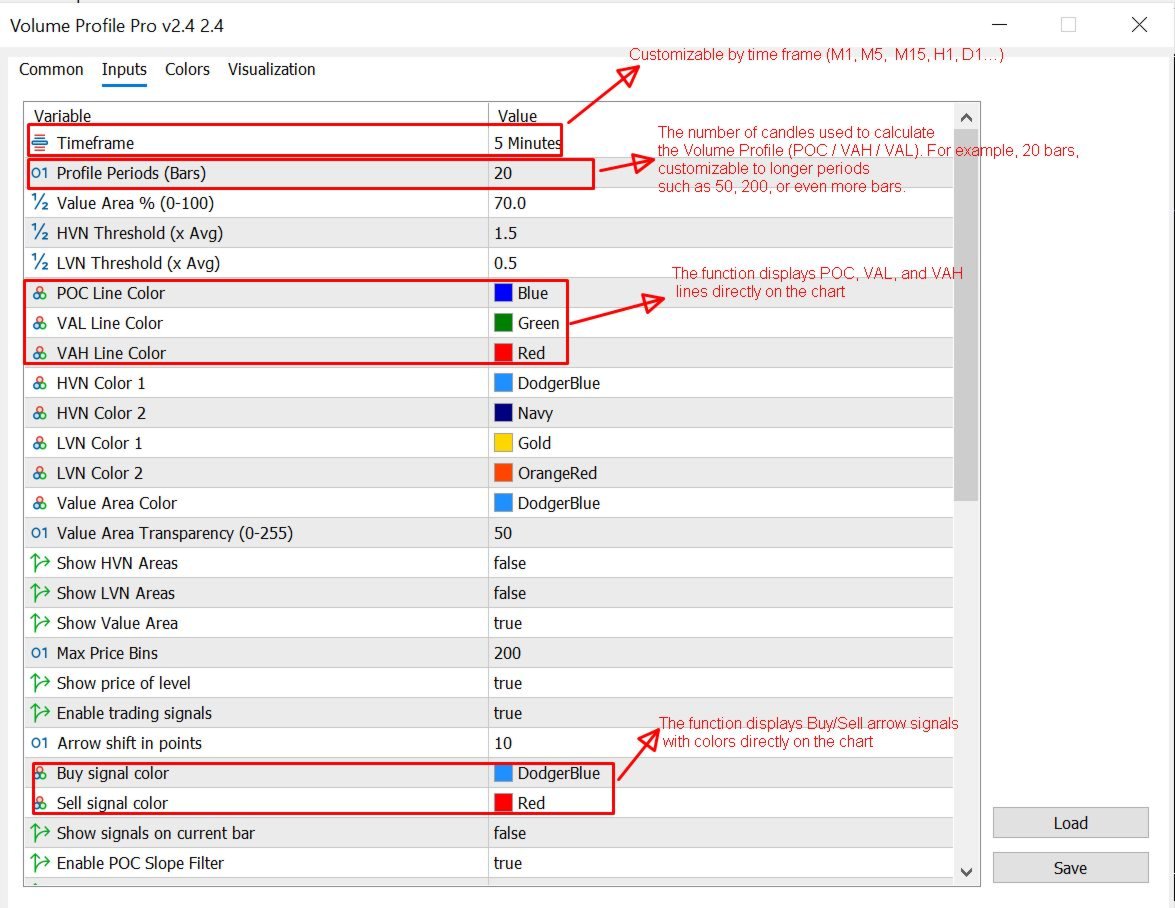
Volume Profile Pro Signals는 실제 거래량이 어느 가격대에서 발생하는지 실시간으로 데이터 기반의 프로파일을 구성하여, 가격이 받아들여지거나 거부되는 시장 구역을 드러냅니다. POC, VAH, VAL을 강조 표시하고 HVN/LVN 구역을 정확히 식별합니다. 이를 바탕으로 VAH/VAL 돌파 시 실시간 신호를 생성하고 ATR 변동성으로부터 스마트한 SL/TP 수준을 플롯합니다.

프로파일 해상도부터 알림 형식까지 모든 구성 요소를 거래 스타일에 맞춰 조정할 수 있습니다 — 빠른 스캘핑이나 며칠간의 포지션 트레이딩 모두에 적합합니다.

핵심 포인트

  • 가격대별 볼륨 인사이트: MT5 차트에서 POC 및 Value Area를 시각적으로 표시.

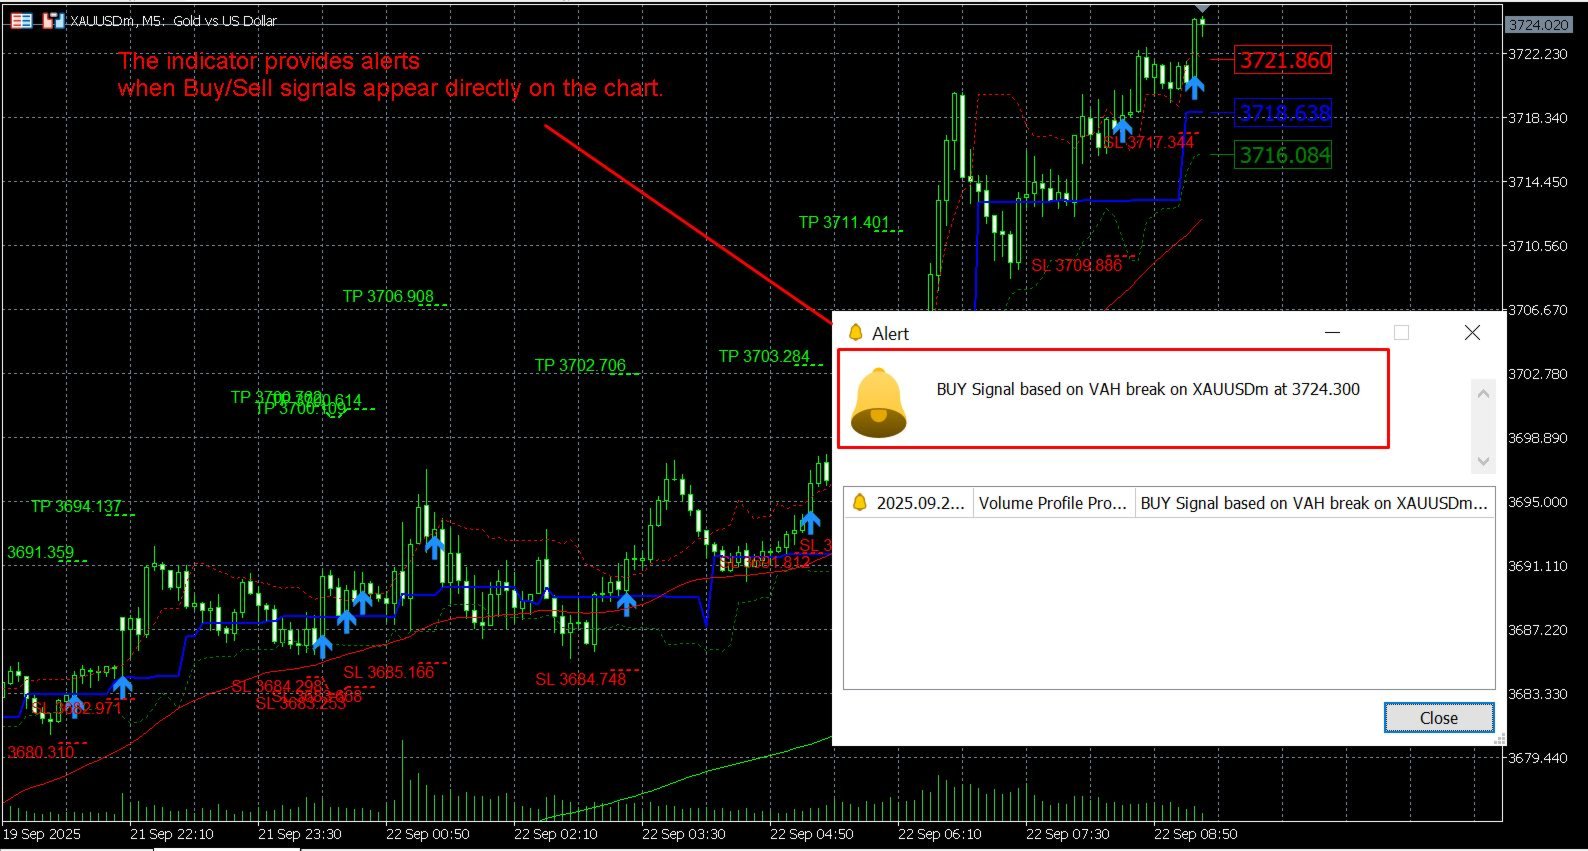
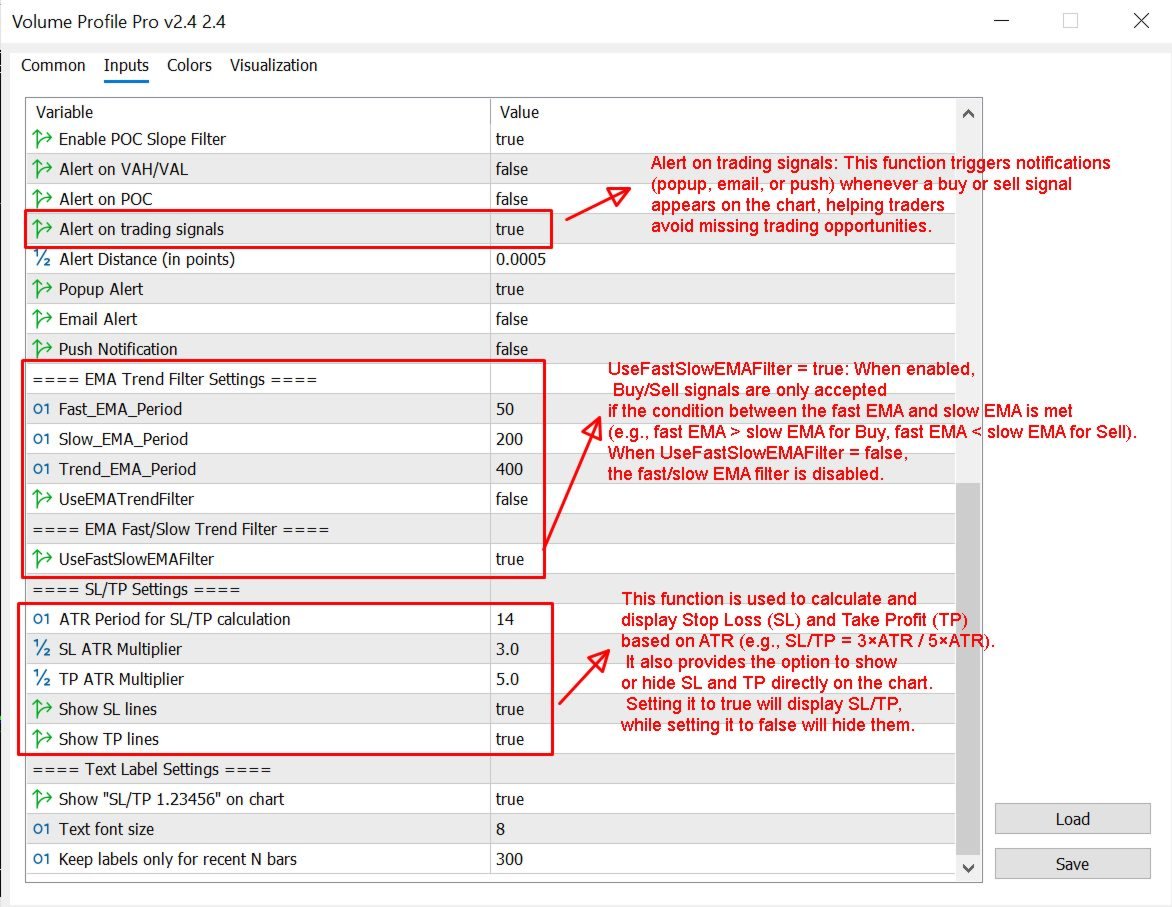
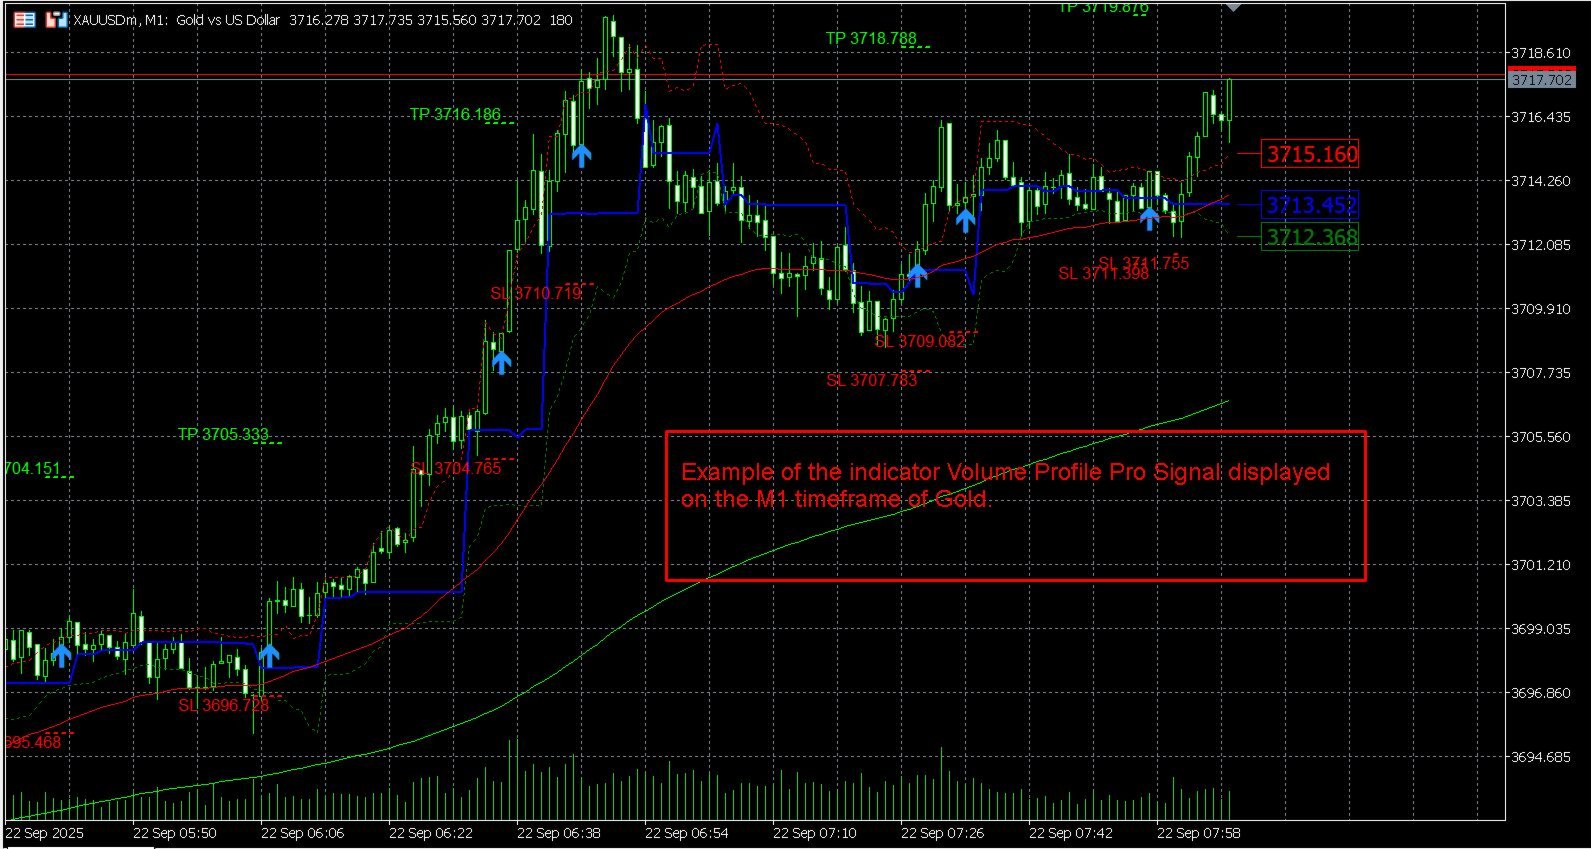
  • 돌파 알림: 가격이 VAH 위 또는 VAL 아래로 종가 마감 시 즉시 신호 발생.

  • 적응형 리스크 수준: ATR 기반 SL/TP 자동 계산.

  • 스마트 필터: EMA 트렌드 필터 및 선택적 POC 기울기 확인으로 오탐 감소.

  • HVN/LVN 인식: 고활동/저볼륨 구간 구분으로 거래 맥락 향상.

  • 다중 타임프레임 호환: 여러 차트/타임프레임에서 효율적으로 동작.

트레이더 이용 방식
수동으로 프로파일을 그리거나 볼륨 바를 확인할 필요 없이 지표가 동적 프로파일을 지속 업데이트합니다. 가격이 VAH 상향 돌파 또는 VAL 하향 돌파하고 선택한 EMA 필터가 확인되면 명확한 매수/매도 화살표를 표시하고 SL/TP 구역을 정의하며 popup/email/push 로 알릴 수 있습니다.

경량화된 설계로 메모리 효율적이며 여러 차트 동시 실행 시에도 안정적으로 작동합니다.
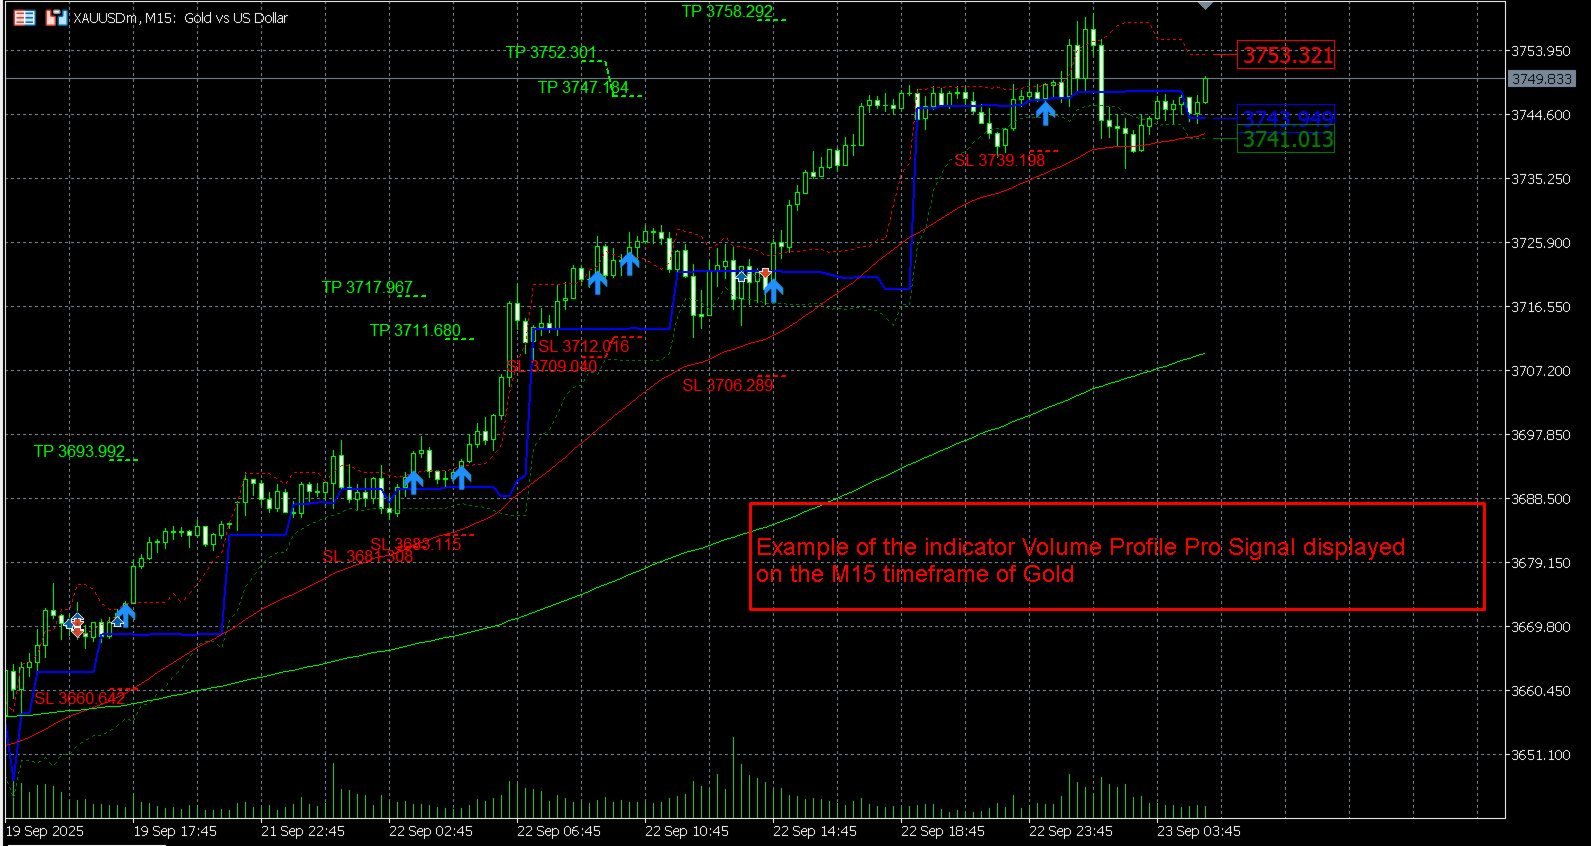
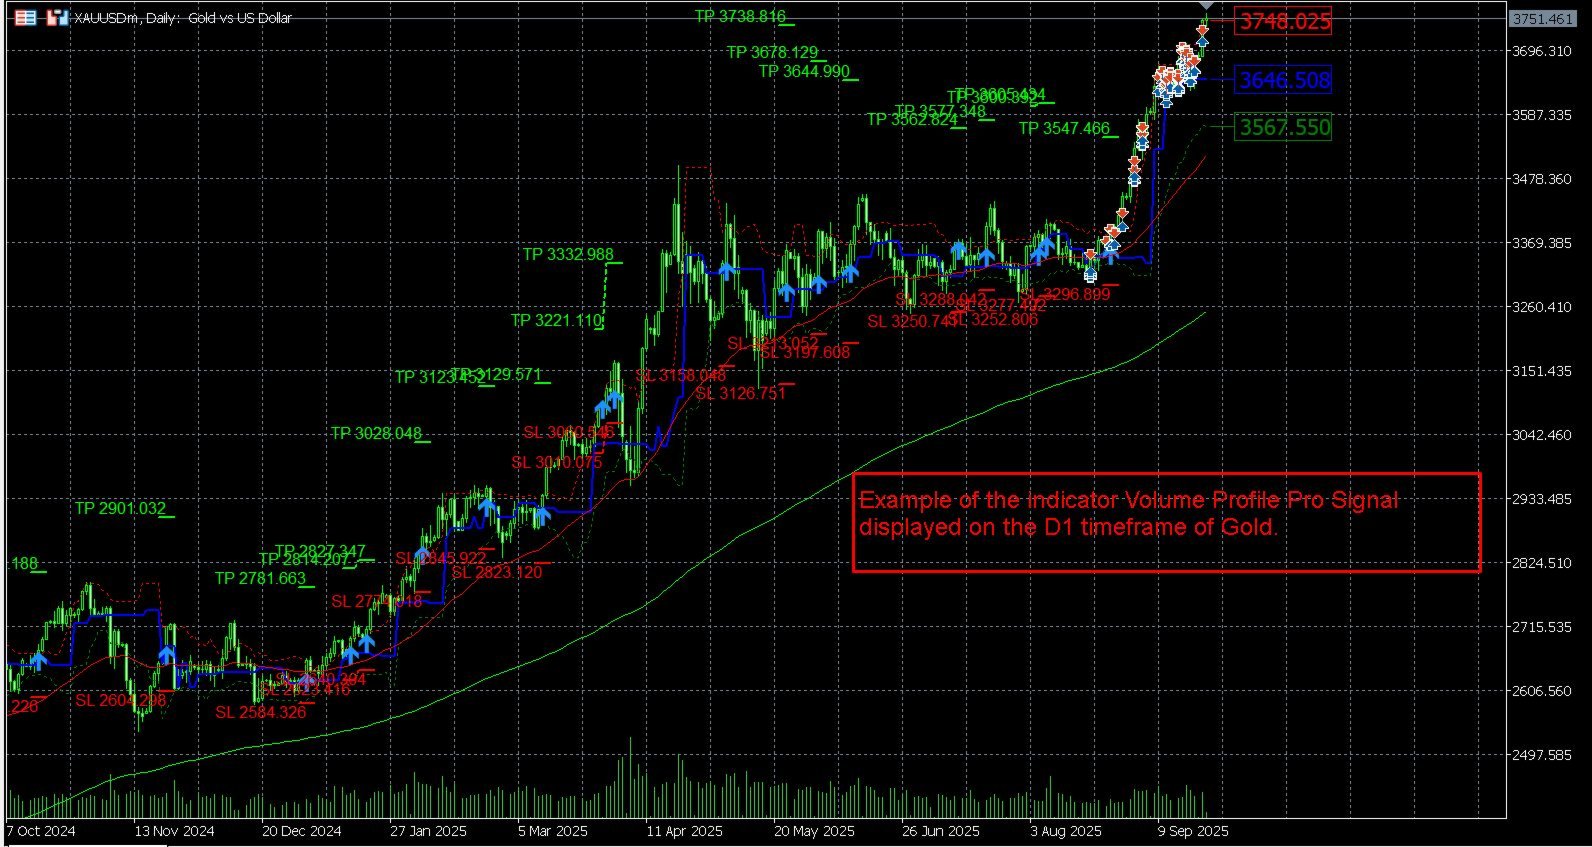
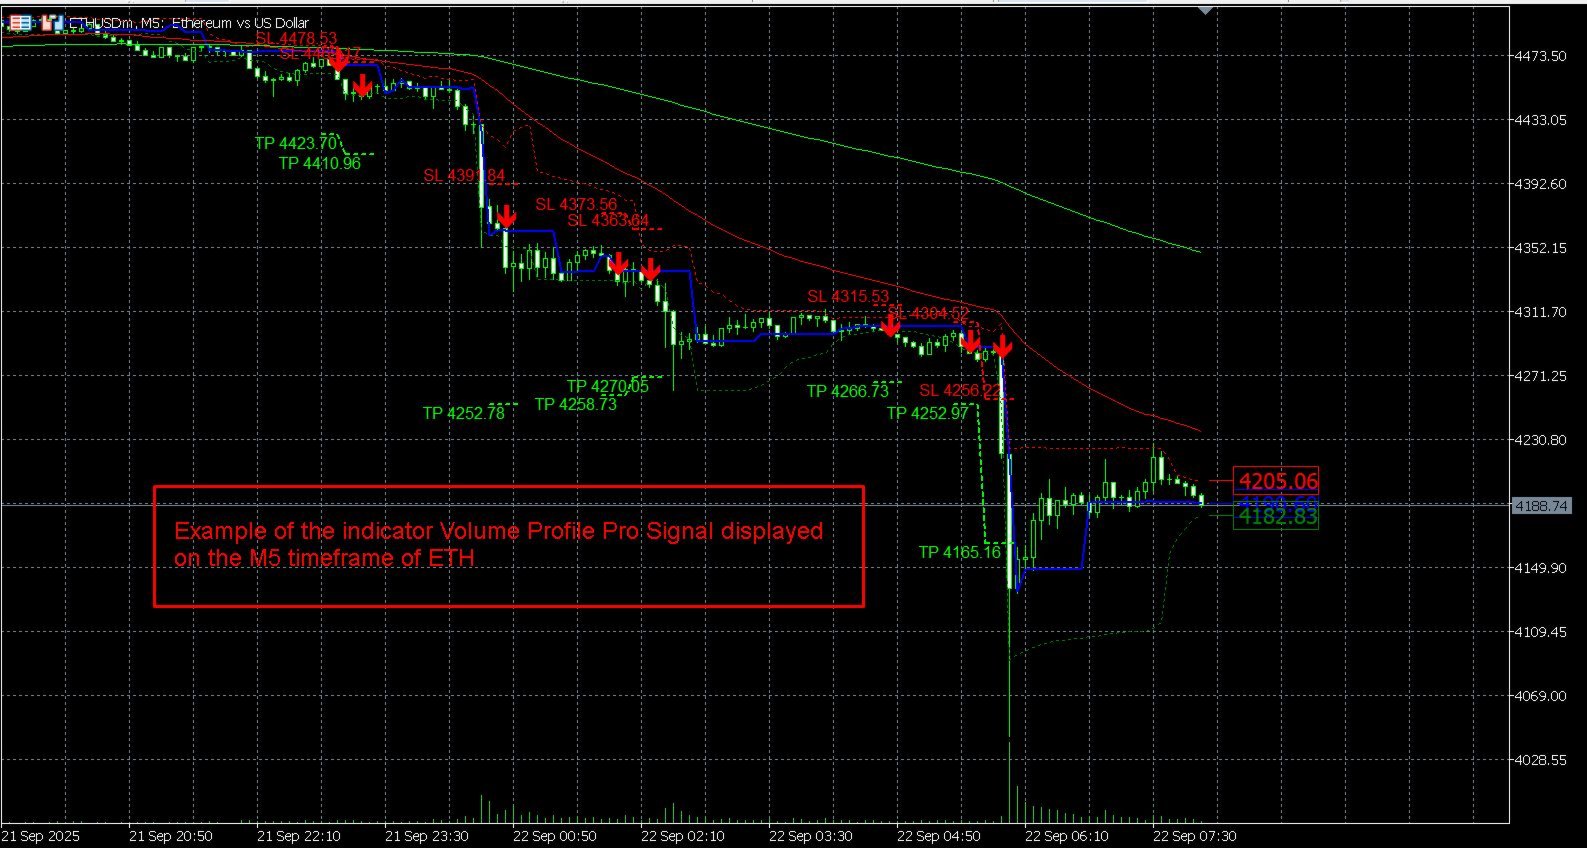
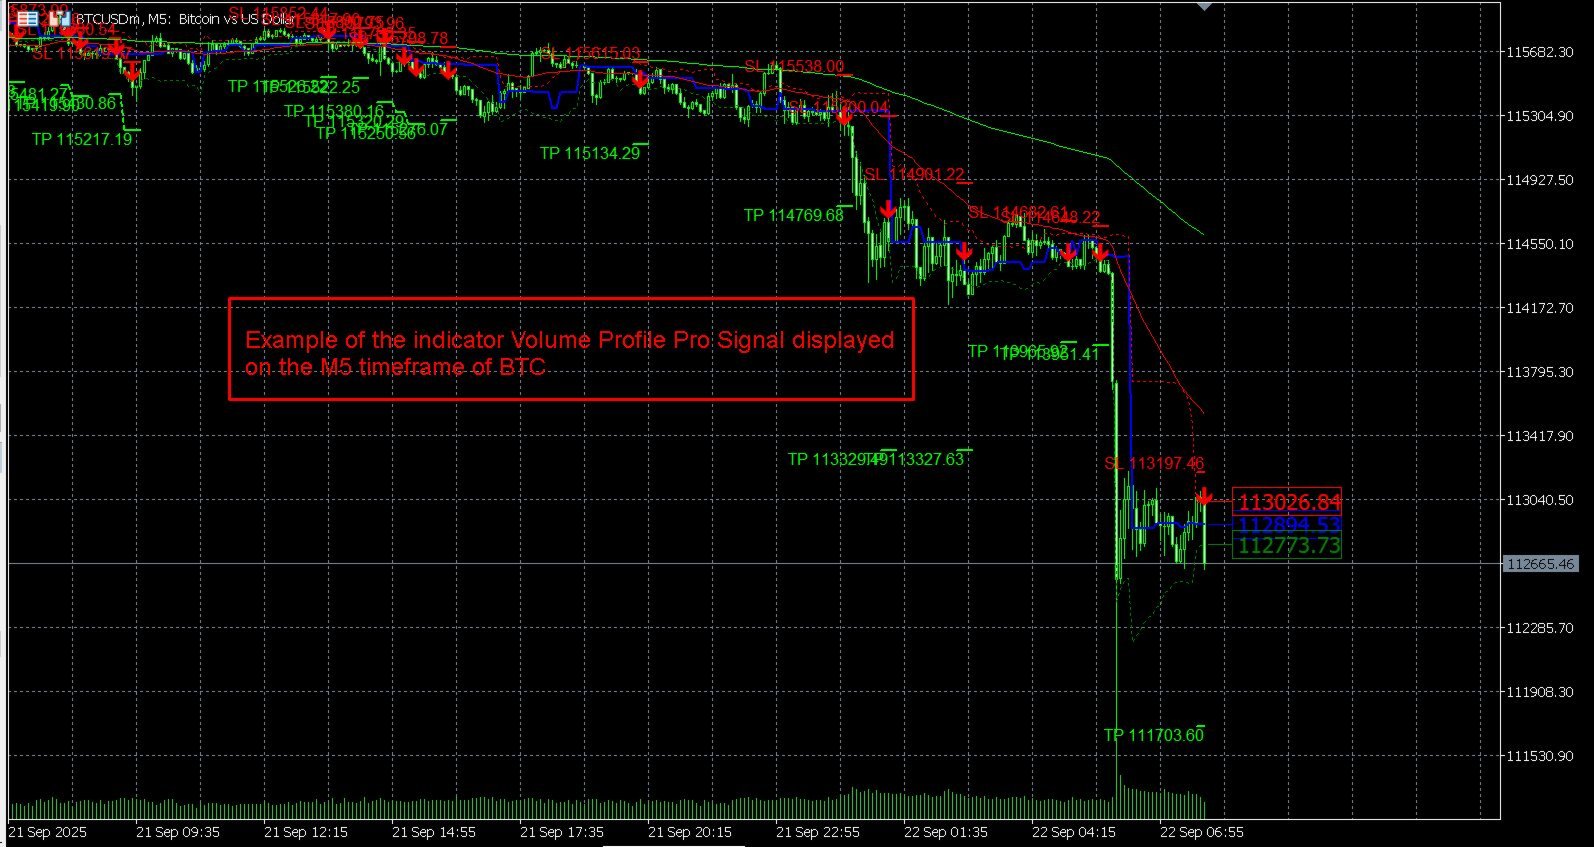
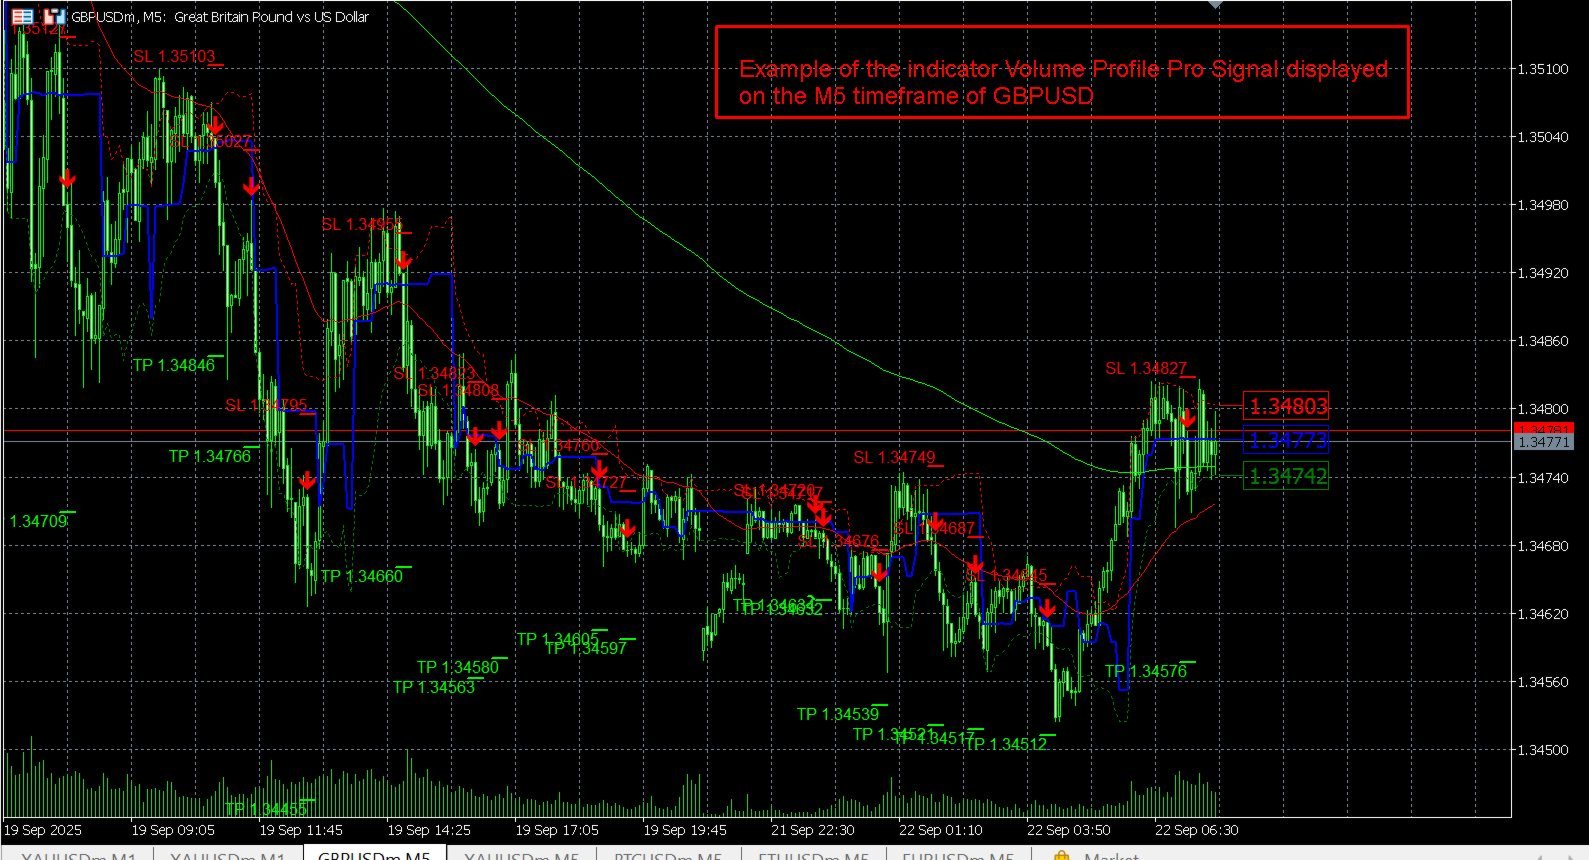
실전 예시
트레이더가 M5에서 20바 프로파일을 모니터. EMA 추세가 상승일 때 가격이 VAH를 돌파. 지표는 신규 POC를 그리며 차트에 초록색 매수 화살표와 ATR 기반 SL/TP를 표시. VAL 아래에서는 동일한 논리로 숏 신호가 발생합니다.

빠른 설정

  • 인디케이터를 차트에 적용.

  • ProfilePeriods, ValueAreaPercent, ATR 파라미터 조정.

  • 필터 활성화/비활성: Fast/Slow/Trend EMA, POC slope.

  • 원하는 알림 켜기.

  • 템플릿 저장.

권장 타임프레임

  • 스캘핑: M1–M15

  • 스윙: H1–D1

커스터마이즈 옵션
프로파일 밀도, 빈 수, Value Area 비율; POC/VAH/VAL/HVN/LVN 선 색상 및 굵기; SL/TP 텍스트 라벨 토글; 알림 관리 및 볼륨 필터의 별도 설정.

차별점
대부분의 볼륨 도구는 바별 활동만 표시하지만, 본 인디케이터는 가격 구간별 구조를 명확히 보여줍니다. 내장 신호 로직으로 단순 분석을 넘어 실제 의사결정 지원을 제공합니다.

지원

  • 제품 페이지에 빠른 시작 가이드 및 스크린샷 포함.

  • 기술 문의는 MQL5 메시지로 작성자에게 연락하세요.


추천 제품
Haven Volume Profile
Maksim Tarutin
4.63 (8)
Haven Volume Profile은 거래량 분포를 기반으로 중요한 가격 수준을 식별하는 데 도움이 되는 다기능 볼륨 프로파일 분석 지표입니다. 시장을 더 잘 이해하고 중요한 진입 및 퇴장 지점을 식별하려는 전문 트레이더를 위해 설계되었습니다. 기타 제품 ->  여기 주요 기능: Point of Control (POC) 계산 - 최대 거래 활동 수준으로, 가장 유동성이 높은 수준을 식별하는 데 도움이 됩니다 Value Area 정의 (높은 활동 영역) 및 사용자 지정 가능한 거래량 비율로 거래 범위를 보다 정확하게 평가할 수 있습니다 틱 거래량과 실제 거래량 모두 지원, 다양한 시장 유형과 거래 전략에 적합 계산 기간(일 수)의 유연한 설정으로 모든 시간 프레임에 도구를 적용할 수 있습니다 터미널의 밝은 테마와 어두운 테마에 자동 적응하여 사용자 인터페이스의 시각적 경험을 향상시킵니다 레벨 시각화가 명확하고 스타일과 색상을 사용자 지정할 수 있어 빠른 의사 결정을 돕습니다 이 지표
FREE
Volume Profile Advance
Israr Hussain Shah
Daily & Composite Volume Profile   This is a professional-grade market profile tool designed for MetaTrader 5. It utilizes a   Dual-Profile System   to visualize supply, demand, and liquidity concentrations. Key Features Left Side: Daily Session Profiles Automatically identifies the start and end of every trading day. Generates a unique Volume Profile for each individual day. Allows you to see how value migrated from yesterday to today (e.g., Is today's volume higher or lower than yesterday?).
Volume Profile Trading System is NOT just another volume indicator. It's a   complete trading ecosystem   that combines professional volume profile visualization with an intelligent automated trading strategy.  While other indicators show you   WHERE   volume is concentrated, Volume Profile Trading System  shows you   WHERE ,   WHEN , and   HOW   to trade it! displaying real volume distribution by price instead of time. It helps traders identify fair value zones, institutional activity, and high
Blahtech Supply Demand MT5
Blahtech Limited
4.54 (13)
Was: $299  Now: $99  Supply Demand uses previous price action to identify potential imbalances between buyers and sellers. The key is to identify the better odds zones, not just the untouched ones. Blahtech Supply Demand indicator delivers functionality previously unavailable on any trading platform. This 4-in-1 indicator not only highlights the higher probability zones using a multi-criteria strength engine, but also combines it with multi-timeframe trend analysis, previously confirmed swings a
Color Histogram Volume Set
Ricardo Almeida Branco
Do you use volume in your reading of the market? Certainly many traders use it, and do not imagine operating without it. The Color Histogram Volume Set indicator allows the user to choose the value that he considers interesting to monitor. When you pass this you will have visual confirmation and if you want you will also have the audible alert that is given by the indicator. Of course, there are other ways to try to find a high volume, such as assessing whether the volume is above av
VP hidden
Emr Aljnaby
4.33 (12)
The indicator works to convert normal volume into levels and determine financial liquidity control points. It is very similar in function to Fixed Volume Profile. But it is considered more accurate and easier to use than the one found on Trading View because it calculates the full trading volumes in each candle and in all the brokers present in MetaTrade, unlike what is found in Trading View, as it only measures the broker’s displayed prices. To follow us on social media platforms: telegram
FREE
Delta Profile Volume
Teresinha Moraes Correia
기술 설명 – MetaTrader 5용 Delta Profile Delta Profile 은 MetaTrader 5에서 정의된 캔들 범위 내의 거래량 흐름을 세부적으로 분석하기 위해 설계된 지표입니다. 이 도구는 각 가격 수준에서 양의 거래량(상승과 관련) 과 음의 거래량(하락과 관련) 간의 불균형을 구조화하고 시각화합니다. 이를 통해 사용자는 실제로 거래가 집중되는 가격 영역과 시장 불균형이 형성되는 구간을 명확하게 파악할 수 있습니다. 핵심 개념 지표는 가격 레벨 을 인식하고 이를 양의 거래량, 음의 거래량 및 순 델타(양-음 차이)로 분류합니다. 각 가격 레벨은 수평 막대 로 차트에 표시되며, 거래가 집중되는 구간을 직관적으로 보여줍니다. 사용자는 분석할 캔들의 개수 , 가격 반올림 정밀도 , 최대 표시 레벨 수 , 표시 옵션 등을 직접 설정할 수 있습니다. 주요 기능 가격 레벨 매핑 : 사용자가 지정한 자릿수에 맞게 가격을 반올림하여 거래량을 집계합니다. 순 델타 계산 : 양
CVD SmoothFlow Pro
Thalles Nascimento De Carvalho
CVD SmoothFlow Pro - 모든 자산에 대한 무제한 볼륨 분석! CVD SmoothFlow Pro 는 정밀하고 무제한의 볼륨 분석을 원하는 트레이더를 위한 최적의 솔루션입니다. Cumulative Volume Delta (CVD) 계산과 고급 노이즈 필터링을 활용하여, Pro 버전은 모든 금융 자산 거래에 필요한 유연성과 정확성을 제공합니다. CVD SmoothFlow Pro가 제공하는 기능: 명확한 분석 : 시장 노이즈를 필터링하고 모든 금융 자산에서 중요한 볼륨 변동을 강조합니다. ️ 정확한 계산 : 매수와 매도 차이를 모니터링하여 외환, 지수, 암호화폐 등 자산의 볼륨 행동을 상세히 제공합니다. 직관적인 인터페이스 : 데이터가 명확하게 제시되어 분석이 쉽고 효율적입니다. 트렌드 식별 : 시장 트렌드를 자신 있게 식별하여 정보에 기반한 결정을 지원합니다. 실용적인 적용: 모든 자산의 실시간 매수자와 매도자 균형을 모니터링합니다. 볼륨을 기반
Market Profile Heat indicator  — is a classic Market Profile implementation that can show the price density over time, outlining the most important price levels, value area, and control value of a given trading session. This indicator can be attached to timeframes between M1 and D1 and will show the Market Profile for daily, weekly, monthly, or even intraday sessions. Lower timeframes offer higher precision. Higher timeframes are recommended for better visibility. It is also possible to use a fr
Blahtech Market Profile MT5
Blahtech Limited
5 (10)
Was: $249  Now: $99   Market Profile defines a number of day types that can help the trader to determine market behaviour. A key feature is the Value Area, representing the range of price action where 70% of trading took place. Understanding the Value Area can give traders valuable insight into market direction and establish the higher odds trade. It is an excellent addition to any system you may be using. Inspired by Jim Dalton’s book “Mind Over Markets”, this indicator is designed to suit the
BoxInside MT5
Evgeny Shevtsov
5 (4)
This indicator calculates the volume profile and places labels that correspond to the VAH, VAL and POC levels, for each candle individually. Indicator operation features The indicator works on the timeframes from M3 to MN, but it uses the history data of smaller periods: M1 - for periods from M3 to H1, M5 - for periods from H2 to H12, M30 - for the D1 period, H4 - for the W1 period, D1 - for the MN period. The color and location of the VAL, VAH and POC labels on the current candle are considere
FREE
Overview Market Volume Profile Modes is a powerful MT5 volume distribution indicator that integrates multiple Volume Profile variants. Users can switch between different analysis modes through a simple menu selection. This indicator helps traders identify key price levels, support and resistance zones, and market volume distribution. Core Concepts • POC (Point of Control): The price level with the highest volume concentration, representing the market's accepted "fair value" area • VAH (Value A
Aggression Volume
Flavio Javier Jarabeck
4.29 (17)
Aggression Volume Indicator is the kind of indicator that is rarely found in the MQL5 community because it is not based on the standard Volume data provided by the Metatrader 5 platform. It requires the scrutiny of all traffic Ticks requested on the platform... That said, Aggression Volume indicator requests all Tick Data from your Broker and processes it to build a very special version of a Volume Indicator, where Buyers and Sellers aggressions are plotted in a form of Histogram. Additionally,
FREE
Advanced Volume Profile Analysis Tool for MetaTrader 5 The Kecia Volume Profile Order Finder provides traders with volume profile analysis capabilities. This MT5 indicator combines volume profile visualization with statistical calculations to help identify potential trading opportunities and suggests entry, stop loss, and take profit levels based on market structure. Market Profile Visualization Transform your chart with customizable volume profile visualizations: Multiple visualization options
BoxChart MT5
Evgeny Shevtsov
5 (7)
The market is unfair if only because 10% of participants manage 90% of funds. An ordinary trader has slim changes to stand against these "vultures". This problem can be solved. You just need to be among these 10%, learn to predict their intentions and move with them. Volume is the only preemptive factor that faultlessly works on any timeframe and symbol. First, the volume appears and is accumulated, and only then the price moves. The price moves from one volume to another. Areas of volume accumu
AvgVolumes
Marco Montemari
5 (1)
This indicator is based on Volumes standard indicator, calculates the average of Volumes based on the last N bars set by users, and if the value of the volume is bigger then a set % respect the average a different color will be used. The indicator is shown in a separate indicator window. This version has now a limitation in setting the % about the threshold. If you are interested to set threshold consider to buy the PRO version ( https://www.mql5.com/en/market/product/35925 ) If you want to use
FREE
VisualVol EURUSD
Maxim Kuznetsov
The indicator highlights the points that a professional trader sees in ordinary indicators. VisualVol visually displays different volatility indicators on a single scale and a common align. Highlights the excess of volume indicators in color. At the same time, Tick and Real Volume, Actual range, ATR, candle size and return (open-close difference) can be displayed. Thanks to VisualVol, you will see the market periods and the right time for different trading operations. This version is intended f
FREE
Price Volume Distribution 가격 수준별 거래량 분포를 분석하는 Volume Profile 지표. MT5용 POC, Value Area, 거래량 급등 및 존 기반 신호 필터링을 표시합니다. 개요 Price Volume Distribution은 MetaTrader 5용 거래량 분석 지표입니다. M1 타임프레임 데이터를 사용하여 가격 수준별 거래량 분포를 계산하고 표시하며, 히스토그램 바와 참조선을 통해 시각적 표현을 제공합니다. 시스템 이해를 위한 사용자 가이드   |   기타 언어 사용자 가이드 주요 기능 지표가 식별하는 항목: - Point of Control (POC): 가장 높은 거래량의 가격 수준 - Value Area High/Low (VAH/VAL): 거래량의 70%를 포함하는 가격 범위 - 거래량 급등: 비정상적으로 높은 활동의 가격 수준 - 거래량 집중에 기반한 지지 및 저항 존 프로파일 모드 세 가지 계산 모드 제공: 1. 세션 모드:
Quantum Tick Volumes Indicator for MT5
QUANTUM TRADING SOFTWARE LIMITED
5 (1)
Many Forex traders assume there is no volume in the foreign exchange market. And they would be correct. There is no central exchange, not yet anyway. And even if there were, what would it report? What there is however is activity, and this is captured as tick volume. After all, volume is simply displaying activity, the buyers and sellers in the market. So for volume read activity, and for activity read volume – simple. The MT5 platform delivers tick data which the Quantum Tick Volumes indicator
Volume Profile V6
Andrey Kolesnik
4.67 (3)
시장 매물대 지표(Volume Profile) + 스마트 오실레이터. 통화 쌍, 주식, 선물, 암호화폐 등 거의 모든 종목에서 작동하며, 실제 거래량(Real Volume)과 틱 거래량(Tick Volume)을 모두 지원합니다. 프로파일 생성 범위를 일주일이나 한 달 등으로 자동 설정할 수 있을 뿐만 아니라, 두 개의 수직선(빨간색과 파란색)을 이동하여 수동으로 범위를 설정할 수도 있습니다. 히스트그램 형태로 표시되며, 특정 가격 수준의 히스토그램 너비는 해당 가격대에서 발생한 거래량을 의미합니다. Mode level line color 파라미터를 사용하면 가격이 반등할 가능성이 높은 주요 매물대 수준을 자동으로 표시할 수 있으며, Maximum color 파라미터는 설정된 전체 범위에서 거래가장 많이 발생한 최대 거래량 수준을 별도로 보여줍니다. 스마트 오실레이터는 과매수 및 과매도 구간을 표시합니다. 여러 지표로부터 오는 정보를 분석하고, 처리된 데이터를 바탕으로 과매수 및 과매
The VWAP indicator is our version of the popular Volume-Weighted Average Price indicator. The VWAP is the ratio between the value traded (price multiplied by the number of volume traded) and the total volume traded over a specific time period. As a result, it measures the average price of the instrument much better than the simple moving average. Although there are many ways to use the VWAP, most investors use it to calculate the daily average.  The indicator works in five modes: Moving  - In
VolumeProfile MT5
Robert Hess
4.14 (7)
Description: The Volume Profile displays detailed informations of historical trading activities at certain price levels (Market Profile). Locate the areas with the best prices in the market and get an advantage over other market participants. Features: Customizable Market Profile Shows the "fair" Value Area with 70% of all Volume Shows critical low volume zones Shows VPOC, VAL and VAH Points integrated resource management to reduce the load while working with multiple charts Works on all timefr
Value Chart Candlesticks
Flavio Javier Jarabeck
4.69 (13)
The idea of a Value Chart indicator was presented in the very good book I read back in 2020 , " Dynamic Trading Indicators: Winning with Value Charts and Price Action Profile ", from the authors Mark Helweg and David Stendahl. The idea is simple and the result is pure genius: Present candlestick Price analysis in a detrended way! HOW TO READ THIS INDICATOR Look for Overbought and Oversold levels. Of course, you will need to test the settings a lot to find the "correct" one for your approach. It
FREE
Heatmap Volume Profile
Olexandr Savchuk
3.5 (2)
A Heatmap with a Volume Profile is like a thermal imager or x-ray machine. It will help you to estimate the relative distribution of volume during the price movement and to understand  the relationship between volume and price. Indicator Volume Profile "Volumos Maxima" is a powerful tool for analyzing this relationship. After simple experimentation with heatmap, you can find that each trading instrument has its own “ characteristic ” way of distributing volume. And this will help you to make a b
BoxProfile MT5
Evgeny Shevtsov
4.6 (10)
The indicator displays volume profiles based on the nesting principle. Profiles periods are pre-set so that each subsequent profile has a length twice as long as the length of the previous profile. In addition to profiles, the indicator displays volume clusters sorted by color, depending on the volume they contain. Indicator operation features The indicator works on typical timeframes from M5 to MN, but for calculations uses historical data from smaller timeframes: M1 - for timeframes from M5
FREE
Smart SD Rectangle Tool
Liam Alex Thomas Webb
스마트 공급 및 수요 사각형 도구 인디케이터는 MT5에서 최고의 동반자로, 주요 공급 및 수요 데이터를 즉시 시각화하여 필요한 곳에서 실시간으로 확인할 수 있습니다. 이 도구는 구역 위에 풍부하고 실행 가능한 데이터를 자동으로 오버레이하여 구역 분류, 핍 거리, 강도, 구역 크기 등을 각 구역 안에 깔끔하게 표시합니다. 더 이상 복잡함이나 추측이 필요 없습니다—명확하고 역동적인 인사이트로 여러분의 결정을 지원합니다. 트레이더를 위해 제작. 정밀함으로 구동. 인트라데이 스캘핑을 하든 일일 차트에서 주요 구역을 분석하든, 이 인디케이터는 수동으로 그린 구역을 즉시 스마트 구역으로 전환하여 작업 흐름을 방해하지 않으면서 차트의 정보 가치를 높입니다. ### 주요 기능 **자동 레벨 감지** - 차트상의 모든 구역을 즉시 인식 - 공급 또는 수요로 자동 분류—수동 태깅 불필요 **풍부한 실시간 메트릭** - 표시 항목:   - 구역 크기   - 현재 가격과의 실시간 핍 거리   -
A "Volume Profile" is an advanced charting indicator that displays total volume traded at every price level over a user specified time period. The main components of the volume profile are POC ( Point Of Control - the price level, at which the maximum number of contracts were executed during a selected period), VAH ( Value Area High - the highest price in the Value Area) and VAL ( Value Area Low - the lowest price in the Value Area). When we settled on the original indicator, we spent a lot of
Basic Volume Profile MT5
Mehran Sepah Mansoor
메타트레이더용 거래량 프로필 인디케이터로 거래량 분석의 힘을 발견하세요!   /   MT4 버전 기본 거래량 프로필은 거래를 최적화하려는 수동 트레이더를 위해 특별히 설계된 지표입니다. 거래량 프로필 인디케이터는 시장 움직임을 더 잘 이해하고자 하는 진지한 트레이더에게 필수적인 도구입니다. 혁신적인 솔루션을 사용하면 거래량이 가격별로 어떻게 분포되어 있는지 명확하고 간결하게 시각화할 수 있습니다. 이를 통해 지지 및 저항 수준, 누적 및 분포 영역, 주요 제어 지점과 같은 주요 관심 영역을 식별할 수 있습니다. 특정 날짜의 거래량을 나타내는 일반 거래량 표시기와 달리 기본 거래량 프로필은 특정 가격의 거래량을 보여줍니다.  이 인디케이터는 직관적이고 사용자 지정 가능한 인터페이스를 갖추고 있어 거래 선호도에 맞게 조정할 수 있습니다. 특징 가격 차트에 거래량 프로필을 명확하게 표시합니다. 거래량이 많은 영역과 적은 영역을 빠르게 식별합니다. 트레이딩 스타일에 맞게 색상과 스타
The Volume Weighted ATR indicator is a helpful tool for measuring market activity. It is based on the idea of the Volume-Weighted ATR. Combining these two elements helps identify potential turning points or breakout opportunities. The indicator for the classification of the activity of the market uses the moving average and its multiples. Accordingly, where the VWATR bar is located (relative to the moving average), it is labelled as ultra-low, low, average, high, very high or ultra high. The Vo
FREE
KT Volume Profile MT5
KEENBASE SOFTWARE SOLUTIONS
KT Volume Profile은 Y축에 히스토그램 형태로 거래량 누적 데이터를 시각화하여, 특정 시간대 및 가격 수준에서의 거래 활동을 확인할 수 있게 해주는 도구입니다. 이 기능은 트레이더가 거래가 집중된 가격 구간을 식별하는 데 매우 유용합니다. 볼륨 프로파일에서의 POC (Point of Control) POC는 전체 프로파일 중 가장 많은 거래량이 발생한 가격 수준을 나타냅니다. 일반적으로 주요 지지 또는 저항 영역으로 활용되며, 시장이 본격적인 방향 전환 전에 되돌림을 보이는 핵심 레벨로 작용할 수 있습니다. 주요 기능 사용법이 매우 간단합니다. 사각형을 차트에서 드래그 앤 드롭하면 실시간으로 볼륨 프로파일이 업데이트됩니다. 가격이 POC를 돌파할 경우 알림을 설정할 수 있습니다. 처음부터 경량화된 코드로 설계되어 CPU 및 메모리 자원 사용이 최소화됩니다. 입력 설정 볼륨 소스:   틱 볼륨 / 실제 거래량 프로파일 색상:   히스토그램 막대의 색상 박스 너비:  
이 제품의 구매자들이 또한 구매함
ARIPoint
Temirlan Kdyrkhan
1 (1)
ARIPoint is a powerful trading companion designed to generate high-probability entry signals with dynamic TP/SL/DP levels based on volatility. Built-in performance tracking shows win/loss stats, PP1/PP2 hits, and success rates all updated live. Key Features: Buy/Sell signals with adaptive volatility bands Real-time TP/SL/DP levels based on ATR Built-in MA Filter with optional ATR/StdDev volatility Performance stats panel (Success, Profit/Loss, PP1/PP2) Alerts via popup, sound, push, or email Cu
이 지표를 구매하면 제 프로페셔널 트레이드 매니저를 무료로 드립니다. 우선 이 거래 시스템이 리페인팅, 리드로잉 및 레이그 인디케이터가 아니라는 점을 강조하는 것이 중요합니다. 이는 수동 및 로봇 거래 모두에 이상적인 것으로 만듭니다. 온라인 강좌, 설명서 및 프리셋 다운로드. "스마트 트렌드 트레이딩 시스템 MT5"은 새로운 및 경험이 풍부한 트레이더를 위해 맞춤형으로 제작된 종합적인 거래 솔루션입니다. 10개 이상의 프리미엄 인디케이터를 결합하고 7개 이상의 견고한 거래 전략을 특징으로 하여 다양한 시장 조건에 대한 다목적 선택이 가능합니다. 트렌드 추종 전략: 효과적인 트렌드 추이를 타기 위한 정확한 진입 및 손절 관리를 제공합니다. 반전 전략: 잠재적인 트렌드 반전을 식별하여 트레이더가 범위 시장을 활용할 수 있게 합니다. 스캘핑 전략: 빠르고 정확한 데이 트레이딩 및 단기 거래를 위해 설계되었습니다. 안정성: 모든 인디케이터가 리페인팅, 리드로잉 및 레이그가 아니므로 신뢰
Divergence Bomber
Ihor Otkydach
4.9 (81)
이 지표를 구매하신 분께는 다음과 같은 혜택이 무료로 제공됩니다: 각 거래를 자동으로 관리하고, 손절/익절 수준을 설정하며, 전략 규칙에 따라 거래를 종료하는 전용 도우미 툴 "Bomber Utility" 다양한 자산에 맞게 지표를 설정할 수 있는 셋업 파일(Set Files) "최소 위험", "균형 잡힌 위험", "관망 전략" 모드로 설정 가능한 Bomber Utility의 셋업 파일 이 전략을 빠르게 설치, 설정, 시작할 수 있도록 돕는 단계별 영상 매뉴얼 주의: 위의 모든 보너스를 받기 위해서는 MQL5 개인 메시지 시스템을 통해 판매자에게 연락해 주세요. 독창적인 커스텀 지표인 “Divergence Bomber(다이버전스 봄버)”를 소개합니다. 이 지표는 MACD 다이버전스(괴리) 전략을 기반으로 한 올인원(All-in-One) 거래 시스템입니다. 이 기술 지표의 주요 목적은 가격과 MACD 지표 간의 다이버전스를 감지하고, **향후 가격이 어느 방향으로 움직일지를 알려주는
Azimuth Pro
Ottaviano De Cicco
5 (1)
LAUNCH PROMO Azimuth Pro price is initially set at 299$ for the first 100 buyers. Final price will be 499$ . THE DIFFERENCE BETWEEN RETAIL AND INSTITUTIONAL ENTRIES ISN'T THE INDICATOR — IT'S THE LOCATION. Most traders enter at arbitrary price levels, chasing momentum or reacting to lagging signals. Institutions wait for price to reach structured levels where supply and demand actually shift. Azimuth Pro maps these levels automatically: swing-anchored VWAP, multi-timeframe structure lines, an
무료 AUX 인디케이터와 EA 지원을 받으세요 직접 다운로드 — 여기를 클릭 [ D.I.C.E ] The DICE Indicator  Divergence in Chaos Environment는 엘리엇 파동 이론과 트레이딩 카오스 기법을 함께 사용하는 트레이더를 위해 설계된 MT5 전문 도구입니다. 가격 움직임의 숨겨진 및 일반 다이버전스를 감지하며, 빌 윌리엄스가 설명한 혼돈 시장 환경과 동기화됩니다. 주요 특징 엘리엇 파동 정렬 다이버전스: 파동 구조에 조화된 강세 및 약세 다이버전스를 탐지하여 파동 카운팅 정확도를 높입니다. 카오스 기법 통합: AO(오썸 오실레이터) 및 시장 구조 원칙과 일치하도록 설계되었습니다. 다중 타임프레임 스캐닝: 다양한 시간 프레임에서 다이버전스를 분석하여 모멘텀 변화와 추세 소진을 확인합니다. 시각적 알림 및 객체: 명확한 화살표, 선, 표시로 빠른 인식 가능. 적응형 시장 판독: 혼돈 시장 조건에 자동으로 조정되어 노이즈를 필터링하고 유효한 셋업만
Atomic Analyst MT5
Issam Kassas
4.07 (28)
우선적으로 언급할 점은이 거래 지표가 다시 그리지 않고 지연되지 않으며 이를 통해 수동 및 로봇 거래 모두에 이상적이라는 점입니다. 사용자 매뉴얼: 설정, 입력 및 전략. Atomic Analyst는 가격의 강도와 모멘텀을 활용하여 시장에서 더 나은 이점을 찾는 PA Price Action Indicator입니다. 고급 필터를 장착하여 잡음과 거짓 신호를 제거하고 거래 잠재력을 높이는 데 도움이 됩니다. 복잡한 지표의 다중 레이어를 사용하여 Atomic Analyst는 차트를 스캔하고 복잡한 수학적 계산을 간단한 신호와 색상으로 변환하여 초보 트레이더가 이해하고 일관된 거래 결정을 내릴 수 있도록합니다. "Atomic Analyst"는 새로운 및 경험이 풍부한 트레이더를위한 종합적인 거래 솔루션입니다. 프리미엄 지표와 최고 수준의 기능을 하나의 거래 전략에 결합하여 모든 종류의 트레이더에 대한 다재다능한 선택지가되었습니다. 인트라데이 거래 및 스캘핑 전략 : 빠르고 정확한 일일
FX Power MT5 NG
Daniel Stein
5 (30)
FX Power: 통화 강세 분석으로 더 스마트한 거래 결정을 개요 FX Power 는 어떤 시장 상황에서도 주요 통화와 금의 실제 강세를 이해하기 위한 필수 도구입니다. 강한 통화를 매수하고 약한 통화를 매도함으로써 FX Power 는 거래 결정을 단순화하고 높은 확률의 기회를 발견합니다. 트렌드를 따르거나 극단적인 델타 값을 사용해 반전을 예측하고자 한다면, 이 도구는 귀하의 거래 스타일에 완벽히 적응합니다. 단순히 거래하지 말고, FX Power 로 더 스마트하게 거래하세요. 1. FX Power가 거래자에게 매우 유용한 이유 통화와 금의 실시간 강세 분석 • FX Power 는 주요 통화와 금의 상대적 강세를 계산하고 표시하여 시장 역학에 대한 명확한 통찰력을 제공합니다. • 어떤 자산이 앞서고 있고 어떤 자산이 뒤처지는지 모니터링하여 보다 현명한 거래 결정을 내릴 수 있습니다. 포괄적인 멀티 타임프레임 뷰 • 단기, 중기 및 장기 타임프레임에서 통화와 금의 강세를
Entry Points Pro for MT5
Yury Orlov
4.48 (138)
다시 색을 칠하지 않고 거래에 진입할 수 있는 정확한 신호를 제공하는 MT5용 지표입니다. 외환, 암호화폐, 금속, 주식, 지수 등 모든 금융 자산에 적용할 수 있습니다. 매우 정확한 추정값을 제공하고 매수와 매도의 가장 좋은 시점을 알려줍니다. 하나의 시그널로 수익을 내는 지표의 예와 함께 비디오 (6:22)시청하십시오! 대부분의 거래자는 Entry Points Pro 지표의 도움으로 첫 거래 주 동안 트레이딩 결과를 개선합니다. 저희의   Telegram Group 을 구독하세요! Entry Points Pro 지표의 좋은점. 재도색이 없는 진입 신호 신호가 나타나고 확인되면(시그널 캔들이 완성된 경우) 신호는 더 이상 사라지지 않습니다. 여타 보조지표의 경우 신호를 표시한 다음 제거되기 때문에 큰 재정적 손실로 이어집니다. 오류 없는 거래 게시 알고리즘을 통해 트레이드(진입 또는 청산)를 할 이상적인 순간을 찾을 수 있으며, 이를 통해 이를 사용하는 모든 거래자의 성공률이
Super Signal – Skyblade Edition 전문가용 노리페인트 / 노래그 트렌드 신호 시스템, 뛰어난 승률 제공 | MT4 / MT5용 1분, 5분, 15분과 같은 낮은 타임프레임에서 가장 좋은 성능을 보입니다. 핵심 기능: Super Signal – Skyblade Edition은 추세 매매를 위해 설계된 스마트 신호 시스템입니다. 이 시스템은 다중 필터 로직을 활용하여, 명확한 방향성과 실질적인 모멘텀이 수반된 고품질 추세만을 감지합니다. 이 시스템은   고점 또는 저점을 예측하지 않으며 , 다음 세 가지 조건이 모두 충족될 때만 신호를 발생시킵니다: 명확한 추세 방향 강화되는 모멘텀 건전한 변동성 구조 또한, 시장 세션 기반의 유동성 분석을 통해 신호의 신뢰성과 타이밍을 더욱 향상시킵니다. 신호 특성: 모든 화살표 신호는 100% 리페인트 없음 / 지연 없음 신호가 한 번 발생하면 고정되며, 깜빡이거나 사라지지 않음 차트 상의 시각적 화살표, 정보 패널, 팝업
Transaction Speed MT5
Ivan Stefanov
5 (2)
이 지표는 시장에서 관심이 나타나는 영역 을 강조 표시한 후, 주문이 누적되는 영역 을 보여줍니다. 이는 **대규모 오더북(호가창)**처럼 작동합니다. 이것은 거대한 자금 을 위한 인디케이터입니다. 성능은 탁월하며, 시장에서 어떤 관심이 있든 반드시 포착할 수 있습니다 . (이것은 완전히 새로 작성되고 자동화된 버전 입니다 – 이제 수동 분석은 필요하지 않습니다.) **거래 속도(Transaction Speed)**는 새로운 개념의 인디케이터로, 시장에 대규모 주문이 언제, 어디에 쌓이는지를 보여주며 , 그 이점을 분석합니다. 매우 초기 단계에서 트렌드 전환 을 감지할 수 있습니다. FX 시장에서 흔히 사용하는 "거래량(volume)"은 오해입니다. 실제로는 시간당 가격 변화량 이므로, 올바른 용어는 거래 속도 입니다. 우리가 어떻게 사고하고, 행동하며, 분석하느냐 가 가장 중요합니다. 분석 패러다임의 전환 은 필수적입니다. 이 인디케이터는 외환 시장에서의 볼륨 개념을 논리적으로
우선적으로, 이 거래 도구는 전문적인 거래에 이상적인 비-다시 그리기 및 지연되지 않는 지표입니다.  온라인 강좌, 사용자 매뉴얼 및 데모. 스마트 가격 액션 컨셉트 인디케이터는 신규 및 경험 많은 트레이더 모두에게 매우 강력한 도구입니다. Inner Circle Trader Analysis 및 Smart Money Concepts Trading Strategies와 같은 고급 거래 아이디어를 결합하여 20가지 이상의 유용한 지표를 하나로 결합합니다. 이 인디케이터는 스마트 머니 컨셉트에 중점을 두어 대형 기관의 거래 방식을 제공하고 이동을 예측하는 데 도움을 줍니다.  특히 유동성 분석에 뛰어나 기관이 어떻게 거래하는지 이해하는 데 도움을 줍니다. 시장 트렌드를 예측하고 가격 변동을 신중하게 분석하는 데 탁월합니다. 귀하의 거래를 기관 전략에 맞추어 시장의 동향에 대해 더 정확한 예측을 할 수 있습니다. 이 인디케이터는 시장 구조를 분석하고 중요한 주문 블록을 식별하고 다양
Grabber System MT5
Ihor Otkydach
4.82 (22)
탁월한 기술적 지표인 Grabber를 소개합니다. 이 도구는 즉시 사용 가능한 “올인원(All-Inclusive)” 트레이딩 전략으로 작동합니다. 하나의 코드 안에 강력한 시장 기술 분석 도구, 매매 신호(화살표), 알림 기능, 푸시 알림이 통합되어 있습니다. 이 인디케이터를 구매하신 모든 분들께는 다음의 항목이 무료로 제공됩니다: Grabber 유틸리티: 오픈 포지션을 자동으로 관리하는 도구 단계별 영상 매뉴얼: 설치, 설정, 그리고 실제 거래 방법을 안내 맞춤형 세트 파일: 인디케이터를 빠르게 자동 설정하여 최고의 성과를 낼 수 있도록 도와줍니다 다른 전략은 이제 잊어버리세요! Grabber만이 여러분을 새로운 트레이딩의 정점으로 이끌어 줄 수 있습니다. Grabber 전략의 주요 특징: 거래 시간 프레임: M5부터 H4까지 거래 가능한 자산: 어떤 자산이든 사용 가능하지만, 제가 직접 테스트한 종목들을 추천드립니다 (GBPUSD, GBPCAD, GBPCHF, AUDCAD, AU
Shock Pullback
Suleiman Alhawamdah
5 (1)
간단히 말해, 현재 캔들 옆에 흰색 숫자(‘핍’이라고 불림)의 움직임이 나타나기 시작하면 거래를 시작할 수 있습니다. 흰색 ‘핍’은 현재 매수 또는 매도 거래가 활성화되어 있으며 흰색으로 표시된 것처럼 올바른 방향으로 움직이고 있음을 나타냅니다. 흰색 핍의 움직임이 멈추고 정적인 녹색으로 바뀌면 이는 현재 모멘텀의 종료를 의미합니다. 숫자의 녹색은 매수 또는 매도 거래를 통해 얻은 총 수익을 ‘핍’ 단위로 나타냅니다. 또한, 인디케이터 내의 다른 고급 전문 분석 도구를 활용하여 거래를 시작할 수 있습니다. 인디케이터에 표시되는 신호와 색상을 관찰함으로써 높은 정확도로 수많은 스캘핑 기회를 포착할 수 있습니다. 테스트 중이거나 실시간 차트에서 인디케이터를 충분히 이해하는 것이 중요합니다. 대부분의 외환 시장에 적합: 금 거래 및 인기 있는 지수 시장(Dow Jones, S&P 500, Nasdaq, DAX 등), 그리고 EUR/USD, GBP/USD, USD/JPY 등 강력한 통화쌍
Market Structure Patterns
Samuel Manoel De Souza
4.47 (19)
Available for   MT4   and   MT5 . Join the Market Structure Patterns channel to download materials available for study and/or additional informations. Related posts: Market Structure Patterns - Introdução Market Structure Patterns   is an indicator based on   smart money concepts   that displays   SMC/ICT   elements that can take your trading decisions to the next level. Take advantage of the   alerts ,   push notifications   and   email messages   to keep informed from when an element is form
Quantum TrendPulse
Bogdan Ion Puscasu
5 (20)
SuperTrend   ,   RSI   ,   Stochastic   의 힘을 하나의 포괄적인 지표로 결합하여 트레이딩 잠재력을 극대화하는 궁극의 트레이딩 도구   인 Quantum TrendPulse를   소개합니다. 정밀성과 효율성을 추구하는 트레이더를 위해 설계된 이 지표는 시장 추세, 모멘텀 변화, 최적의 진입 및 종료 지점을 자신 있게 식별하는 데 도움이 됩니다. 주요 특징: SuperTrend 통합:   주요 시장 추세를 쉽게 따라가고 수익성의 물결을 타세요. RSI 정밀도:   매수 과다 및 매도 과다 수준을 감지하여 시장 반전 시점을 파악하는 데 적합하며 SuperTrend 필터로 사용 가능 확률적 정확도:   변동성이 큰 시장에서 숨겨진 기회를 찾기 위해 확률적 진동   을 활용하고 SuperTrend의 필터로 사용 다중 시간대 분석:   M5부터 H1 또는 H4까지 다양한 시간대에 걸쳐 시장을 최신 상태로 유지하세요. 맞춤형 알림:   맞춤형 거래 조건이 충족되면
ARIScalping
Temirlan Kdyrkhan
ARIScalp is a powerful trading companion designed to generate high-probability entry signals with dynamic TP/SL/DP levels based on volatility. Built-in performance tracking shows win/loss stats, PP1/PP2 hits, and success rates all updated live. Key Features: Buy/Sell signals with adaptive volatility bands Real-time TP/SL/DP levels based on ATR Built-in MA Filter with optional ATR/StdDev volatility Performance stats panel (Success, Profit/Loss, PP1/PP2) Alerts via popup, sound, push, or email Cus
ARICoins
Temirlan Kdyrkhan
ARICoin is a powerful trading companion designed to generate high-probability entry signals with dynamic TP/SL/DP levels based on volatility. Built-in performance tracking shows win/loss stats, PP1/PP2 hits, and success rates all updated live. Key Features: Buy/Sell signals with adaptive volatility bands Real-time TP/SL/DP levels based on ATR Built-in MA Filter with optional ATR/StdDev volatility Performance stats panel (Success, Profit/Loss, PP1/PP2) Alerts via popup, sound, push, or email Cust
Gold Sniper Scalper Pro
Ich Khiem Nguyen
3.5 (8)
Gold Sniper Scalper Pro는 MetaTrader 5용 전문 지표로, 트레이더가 진입 지점을 식별하고 리스크를 효과적으로 관리할 수 있도록 지원하기 위해 설계되었습니다. 이 지표는 시그널 감지 시스템, 자동 Entry/SL/TP 관리, 거래량 분석 및 실시간 성과 통계를 포함하는 포괄적인 분석 도구 세트를 제공합니다. 시스템 이해를 위한 사용자 가이드   |   기타 언어 사용자 가이드 주요 기능 시그널 감지 시스템 지표는 Price Action 분석 및 시장 구조를 기반으로 잠재적 진입 지점을 자동으로 감지합니다. 거래 기회 감지 시: - BUY 화살표(녹색) 또는 SELL 화살표(빨간색)가 차트에 표시됩니다 - 캔들이 색상으로 표시되어 시그널 영역을 식별합니다 - Entry/SL/TP 레벨이 자동으로 계산됩니다 시그널은 가격이 Entry 레벨에 도달할 때만 활성화되어, 시장에서 확인되지 않은 시그널을 필터링합니다. 지능형 Entry/SL/TP 관리 - Ent
PZ Swing Trading MT5
PZ TRADING SLU
5 (5)
Protect against whipsaws: revolutionize your swing trading approach Swing Trading is the first indicator designed to detect swings in the direction of the trend and possible reversal swings. It uses the baseline swing trading approach, widely described in trading literature. The indicator studies several price and time vectors to track the aggregate trend direction and detects situations in which the market is oversold or overbought and ready to correct. [ Installation Guide | Update Guide | Tro
Introduction to X3 Chart Pattern Scanner X3 Cherart Pattern Scanner is the non-repainting and non-lagging indicator detecting X3 chart patterns including Harmonic pattern, Elliott Wave pattern, X3 patterns, and Japanese Candlestick patterns. Historical patterns match with signal patterns. Hence, you can readily develop the solid trading strategy in your chart. More importantly, this superb pattern scanner can detect the optimal pattern of its kind. In addition, you can switch on and off individu
Trend Forecaster
Alexey Minkov
5 (7)
The Trend Forecaster indicator utilizes a unique proprietary algorithm to determine entry points for a breakout trading strategy. The indicator identifies price clusters, analyzes price movement near levels, and provides a signal when the price breaks through a level. The Trend Forecaster indicator is suitable for all financial assets, including currencies (Forex), metals, stocks, indices, and cryptocurrencies. You can also adjust the indicator to work on any time frames, although it is recommen
Berma Bands
Muhammad Elbermawi
5 (7)
Berma Bands(BBs) 지표는 시장 동향을 파악하고 이를 활용하려는 트레이더에게 귀중한 도구입니다. 가격과 BBs 간의 관계를 분석함으로써 트레이더는 시장이 추세 단계인지 범위 단계인지를 분별할 수 있습니다. 자세한 내용을 알아보려면 [ Berma Home Blog ]를 방문하세요. 버마 밴드는 세 개의 뚜렷한 선으로 구성되어 있습니다. 어퍼 버마 밴드, 미들 버마 밴드, 로어 버마 밴드입니다. 이 선들은 가격 주위에 그려져 전체 추세에 대한 가격 움직임을 시각적으로 표현합니다. 이 밴드들 사이의 거리는 변동성과 잠재적인 추세 반전에 대한 통찰력을 제공할 수 있습니다. 버마 밴드 라인이 각각에서 분리될 때, 그것은 종종 시장이 횡보 또는 범위 이동 기간에 접어들고 있음을 시사합니다. 이는 명확한 방향 편향이 없음을 나타냅니다. 트레이더는 이러한 기간 동안 추세를 파악하기 어려울 수 있으며 더 명확한 추세가 나타날 때까지 기다릴 수 있습니다. 버마 밴드 라인이 단일 라인으로
Dark Support Resistance  is an Indicator for intraday trading. This Indicator is programmed to identify  Support and Resistance Lines , providing a high level of accuracy and reliability. Key benefits Easily visible lines Only the most important levels will be displayed Automated adjustment for each timeframe and instrument Easy to use even for beginners Never repaints, never backpaints, Not Lag 100% compatible with Expert Advisor development All types of alerts available: Pop-up, Email, Push
The Super Arrow Indicator provides non-repainting buy and sell signals with exceptional accuracy. Key Features No repainting – confirmed signals remain fixed Clear visual arrows: green for buy, red for sell Real-time alerts via pop-up, sound, and optional email Clean chart view with no unnecessary clutter Works on all markets: Forex, gold, oil, indices, crypto Adjustable Parameters TimeFrame Default:   "current time frame" Function:   Sets the time frame for indicator calculation Options:   Can
Gold Venamax MT5
Sergei Linskii
2.67 (3)
Gold Venamax - 이것은 최고의 주식 기술 지표입니다. 지표 알고리즘은 자산의 가격 변동을 분석하고 변동성과 잠재적 진입 영역을 반영합니다. 표시기 기능: 이것은 편안하고 수익성 있는 거래를 위한 매직과 두 개의 추세 화살표 블록을 갖춘 슈퍼 지표입니다. 블록 전환을 위한 빨간색 버튼이 차트에 표시됩니다. 매직은 표시기 설정에서 설정되므로 서로 다른 블록을 표시하는 두 개의 차트에 표시기를 설치할 수 있습니다. Gold Venamax는 서로 다른 화살표 버퍼(GV 및 SD)를 사용하여 두 개의 차트에 배치할 수 있습니다. 이렇게 하려면 설정에서 다른 Magic을 선택해야 합니다. 예를 들어 하나는 Magic = 999이고 다른 하나는 Magic = 666입니다. 다음으로 차트의 빨간색 버튼으로 화살표 버퍼를 선택할 수 있습니다. 지표 설정의 각 화살표 버퍼(GV 및 SD)에는 편안하고 수익성 있는 거래를 위한 별도의 화살표 필터가 있습니다(UseFiltrGV = true;
AriX
Temirlan Kdyrkhan
1 (4)
AriX Indicator for MT5 A powerful trend-following and signal-evaluation tool AriX is a custom MT5 indicator that combines Moving Averages and ATR-based risk/reward logic to generate clear buy/sell signals. It visualizes dynamic SL/TP levels, evaluates past trade outcomes, and displays win/loss statistics in a clean on-chart panel. Key features include: Buy/Sell signals based on MA crossovers ATR-based SL/TP1/TP2/TP3 levels with visual lines and labels Signal outcome tracking with real-time stat
Advanced Supply Demand MT5
Bernhard Schweigert
4.5 (14)
현재 33% 할인! 초보자나 전문 트레이더를 위한 최고의 솔루션! 이 보조지표는 우리가 다수의 독창적 기능과 새로운 공식을 통합한 독특하고 고품질이며 저렴한 거래 도구입니다. 이 업데이트를 통해 이중 시간대를 표시할 수 있습니다. 더 높은 TF를 표시할 수 있을 뿐만 아니라 차트 TF와 더 높은 TF 모두를 표시할 수 있습니다: 중첩 영역 표시. 모든 Supply Demand 트레이더들이 좋아할 것입니다. :) 중요한 정보 공개 Advanced Supply Demand의 잠재력을 극대화하려면 다음을 방문하십시오. https://www.mql5.com/ko/blogs/post/720245   진입 또는 목표의 명확한 트리거 포인트를 정확히 찾아냄으로 해서 거래가 어떻게 개선될지 상상해 보십시오. 새로운 알고리즘을 기반으로 매수자와 매도자 간의 잠재적인 불균형을 훨씬 더 쉽게 분간할 수 있습니다. 왜냐하면 가장 강한 공급영역과 가장 강한 수요 영역과 과거에 어떻게 진행 되었는지를(이전
TPSproTREND PrO MT5
Roman Podpora
4.74 (19)
TPSproTrend PRO는 시장이 실제로 방향을 바꾸는 순간을 포착하여 움직임의 시작점에서 진입점을 형성합니다. 가격이 움직이기 시작할 때 시장에 진입해야 하며, 이미 가격 변동이 일어난 후에 진입해서는 안 됩니다.   (지표)       신호를 다시 그리지 않고 진입점, 손절매, 이익실현을 자동으로 표시하여 거래를 명확하고 시각적이며 체계적으로 만들어줍니다. 설명서 (러시아어)   -   MT4 버전 주요 장점 신호 재표시 없이 신호가 표시됩니다.   모든 신호는 고정되어 있습니다. 화살표가 나타나면 -       그것은 더 이상 변하거나 사라지지 않을 것입니다. 잘못된 신호의 위험 없이 안정적인 데이터를 기반으로 거래 결정을 내릴 수 있습니다. 바로 사용 가능한 매수/매도 진입점 이 지표는 거래 진입에 가장 적합한 시점을 자동으로 판단하여 차트에 화살표로 표시합니다. 추측이나 주관적인 분석이 아닌, 명확한 신호만 있습니다. 자동 손절매 및 이익실현 영역 신호 직후에 다음
FX Volume MT5
Daniel Stein
4.79 (24)
FX Volume: 브로커 시각에서 바라보는 진짜 시장 심리 간단 요약 트레이딩 접근 방식을 한층 더 향상시키고 싶으신가요? FX Volume 는 소매 트레이더와 브로커의 포지션을 실시간으로 파악할 수 있게 해 줍니다. 이는 COT 같은 지연된 보고서보다 훨씬 빠릅니다. 꾸준한 수익을 추구하는 분이든, 시장에서 더 깊은 우위를 원하시는 분이든, FX Volume 을 통해 대규모 불균형을 찾아내고, 돌파 여부를 확인하며 리스크 관리를 정교화할 수 있습니다. 지금 시작해 보세요! 실제 거래량 데이터가 의사결정을 어떻게 혁신할 수 있는지 직접 경험해 보시기 바랍니다. 1. 트레이더에게 FX Volume이 매우 유익한 이유 탁월한 정확도를 지닌 조기 경보 신호 • 다른 사람들보다 훨씬 앞서, 각 통화쌍을 매수·매도하는 트레이더 수를 거의 실시간으로 파악할 수 있습니다. • FX Volume 은 여러 리테일 브로커에서 추출한 실제 거래량 데이터를 종합해 명확하고 편리한 형태로 제공하는
MetaForecast M5
Vahidreza Heidar Gholami
5 (3)
MetaForecast는 가격 데이터의 조화를 기반으로 모든 시장의 미래를 예측하고 시각화합니다. 시장이 항상 예측 가능한 것은 아니지만 가격에 패턴이 있다면 MetaForecast는 가능한 정확하게 미래를 예측할 수 있습니다. 다른 유사한 제품과 비교했을 때, MetaForecast는 시장 동향을 분석하여 더 정확한 결과를 생성할 수 있습니다. 입력 매개변수 Past size (과거 크기) MetaForecast가 미래 예측을 생성하기 위한 모델을 만드는 데 사용하는 막대의 수를 지정합니다. 모델은 선택한 막대 위에 그려진 노란색 선으로 표시됩니다. Future size (미래 크기) 예측해야 할 미래 막대의 수를 지정합니다. 예측된 미래는 핑크색 선으로 표시되며 그 위에 파란색 회귀선이 그려집니다. Degree (차수) 이 입력은 MetaForecast가 시장에서 수행할 분석 수준을 결정합니다. Degree 설명  0 차수 0의 경우, "Past size" 입력에 모든 봉우리와
제작자의 제품 더 보기
SuperScalp Pro
Van Minh Nguyen
5 (1)
SuperScalp Pro – 고급 다중 필터 스캘핑 인디케이터 시스템 SuperScalp Pro는 클래식 Supertrend와 여러 지능형 확인 필터를 결합한 고급 스캘핑 인디케이터 시스템입니다. 해당 인디케이터는 M1부터 H4까지 모든 타임프레임에서 효율적으로 작동하며, 특히 XAUUSD, BTCUSD 및 주요 외환 통화쌍에 적합합니다. 독립형 시스템으로 사용하거나 기존 거래 전략에 유연하게 통합할 수 있습니다. 이 인디케이터는 11개 이상의 필터를 통합하며, 빠른/느린 EMA, 추세 판별용 3개의 EMA, EMA 기울기(EMA slope), RSI, ADX, 거래량(Volume), VWAP, 볼린저 밴드 돌파(Bollinger Bands Breakout) 및 MACD 다이버전스 필터 등을 포함합니다. 스마트 캔들 필터는 캔들 종가를 확인하여 약한 신호를 제거하고, 3 EMA와 MACD 다이버전스 필터를 결합한 추세 인식 메커니즘은 더 높은 승률의 신호를 선별하는 데 도움을 줍니
Supertrend G5 Pro
Van Minh Nguyen
5 (2)
Supertrend G5 Pro – Professional Trading System for XAUUSD Supertrend G5 Pro is a full-featured automated trading system optimized for XAUUSD, designed for intraday and short-term trading with a primary focus on the M5 timeframe (also effective on M1, M15, and H1 with parameter adjustments). As an advanced upgrade of Supertrend G5, Dynamic Lot Growth allows adaptive position sizing based on account performance , combined with built-in risk management and prop-firm compliant protections to suppo
Supertrend G5
Van Minh Nguyen
5 (12)
Supertrend G5 is a fully automated Expert Advisor for the MetaTrader 5 platform, specifically optimized for XAUUSD on the M5 timeframe. The EA is designed to deliver stable and efficient performance under the volatility characteristics of the gold market. This EA can also be applied to cryptocurrencies (BTC, etc.) and major currency pairs (EURUSD, USDJPY, GBPUSD); however, parameter adjustments are required to achieve optimal results. How the EA works: The EA trades strictly in the direction of
FREE
Trend Trading – Capital Protection – Optimized for Strong Trends Supertrend G5 Prime is the next evolutionary version in the Supertrend G5 strategy line. This version focuses on enhanced position management architecture, advanced risk control mechanisms, and precise alignment with dominant market trends. Core Logic: Trade entry signals are based on the Supertrend indicator (ATR-based). A multi-timeframe EMA trend filter (default: EMA 200 on D1) ensures trades are executed strictly in the direc
VM Trend Candles
Van Minh Nguyen
VM Trend Candles Indicator - Complete Trend Trading Solution Trend Candles Indicator is a professional, intuitive, and easy-to-use Forex trading system designed to transform complex trend analysis into clear, high-probability trading signals. Based on proven trend-following principles and enhanced with intelligent market filtering, the indicator provides accurate BUY/SELL signals together with automatically calculated Stop Loss and Take Profit levels according to market volatility. The system su
SmartScalp M1
Van Minh Nguyen
SmartScalp M1 – Fast Scalping with Accurate Trends and Clean Signals SmartScalp M1   is a high-speed scalping indicator optimized specifically for the M1 timeframe. It combines Supertrend and Heiken Ashi to identify clear trend reversals and effectively filter market noise. BUY and SELL signals are generated when the Supertrend flips and are confirmed by Heiken Ashi candle colors, significantly reducing false signals in choppy market conditions. The indicator performs best on high-volatility ins
Heiken Ashi Pro v1.9 – Heiken-Ashi Smoothing Strategy for XAUUSD H1 Heiken Ashi Pro is a fully automated Expert Advisor (EA) based on smoothed Heiken-Ashi candles using either EMA or HULL smoothing. The EA combines ATR-based dynamic Stop Loss and Take Profit with multi-layered trend filters and comprehensive risk management to balance trade frequency and stability in the highly volatile XAUUSD H1 environment. It checks spread and margin before placing trades and includes an automatic close or re
VM Breakout BB
Van Minh Nguyen
5 (1)
VM Breakout BB: 볼린저 밴드를 이용한 확률 기반 브레이크아웃 지표 VM Breakout BB는 볼린저 밴드를 기반으로 통계적 확률 분석(Z-스코어 및 정규 누적 분포 함수 CDF)과 RSI, ADX, Volume SMA 같은 스마트 확인 필터를 결합한 브레이크아웃 탐지 지표입니다. 이 지표는 명확한 통계적 근거를 가진 신호를 제공하고 노이즈를 줄이며 성공 확률이 더 높은 브레이크아웃을 확인하는 것을 목표로 합니다. 신호 로직 매수: 가격이 상단 밴드 위에서 종가를 기록하고, 브레이크아웃 확률이 설정된 임계값에 도달하며 확인 필터가 만족될 때(RSI/ADX/Volume이 활성화된 경우). 매도: 가격이 하단 밴드 아래에서 종가를 기록하고, 브레이크아웃 확률이 설정된 임계값에 도달하며 확인 필터가 만족될 때(활성화된 경우). ConfirmOnClosedBar 옵션은 바 마감 후에만 신호를 확정하여 오작동을 줄입니다. 사용자는 신호의 엄격도를 Relaxed, Normal 또는
FREE
VM Heiken Ashi Pro
Van Minh Nguyen
5 (1)
VM Heiken Ashi Pro  노이즈를 필터링하고 명확한 BUY/SELL 신호를 생성하기 위한 평활화된 Heiken-Ashi (HMA 또는 EMA), 비리페인트(선택적 ConfirmOnClosedBar). 차트에 HA 캔들 표시(원본 캔들 숨김 가능), 화살표 배치는 ATR 또는 고정 오프셋으로 설정, 알림 전송(popup, email, push) 및 스팸 방지 처리 포함. 주요 목적 원시 캔들을 평활화된 Heiken-Ashi로 변환하여 색상 변화(약세에서 강세로 / 강세에서 약세로)를 감지하고 진입 화살표를 그립니다. ConfirmOnClosedBar 옵션은 리페인트를 피하기 위해 캔들이 닫힐 때까지 기다리도록 합니다. UseATRForArrowOffset는 화살표를 시각적으로 더 자연스럽게 만듭니다. 이 인디케이터는 가볍고 많은 차트에서 안정적입니다. 빠른 사용법 인디케이터를 부착하고 Smoothing Method 및 Smoothing Period(기본 50)를 선택합
Volume Profile Flex - POC, VAH and VAL with Price Level Display Volume Profile Flex is a flexible and performance-optimized Volume Profile indicator designed to help traders identify important price levels based on traded volume rather than time. The indicator provides a clear view of market acceptance areas, price rejection zones, and the most actively traded price levels directly on the chart. Main Features: The indicator automatically calculates and displays key Volume Profile levels within
FREE
VM Auto SLTP Pro
Van Minh Nguyen
5 (1)
VM Auto SLTP Pro - Advanced Order and Risk Management EA Overview: VM Auto SLTP Pro is a professional upgrade to the VM Auto SLTP Basic edition, built to deliver robust performance, advanced trade management tools, and an intuitive on-chart control panel. This Expert Advisor automatically sets and manages Stop Loss (SL) and Take Profit (TP) levels for existing positions — whether opened manually or by other EAs — using ATR-based, fixed-point, fixed-price, or USD-based rules. VM Auto SLTP Pro
Supertrend G5 Indicator Supertrend G5 is a high-performance trend-following tool designed to accurately identify market reversal points. By displaying a color-coded line directly on the chart, this indicator helps you quickly recognize bullish trends (green) and bearish trends (red), supporting optimal entry and exit points. Key Features: Clear Buy/Sell Signals Buy when the Supertrend line changes from red to green (beginning of an uptrend). Sell when the Supertrend line changes from green to re
FREE
VM Auto SLTP Basic
Van Minh Nguyen
5 (1)
VM Auto SLTP Basic - Intelligent Trade Management for Scalpers Enhance your scalping strategy to a higher level. VM Auto SLTP Basic automatically manages Stop Loss and Take Profit for orders that are opened manually or by other Expert Advisors. This tool does not open trades on its own, allowing you to maintain full control while enjoying precise risk management. Key Features SL/TP based on ATR or fixed price Automatic SL move to Breakeven Risk management as a percentage of account balance Suppo
FREE
VM SuperAshi Trend Precision Trend Sniper using Smoothed Heiken Ashi, Supertrend and EMA Trend Optimized for M1–M5 Scalping Overview VM SuperAshi Trend is an indicator that combines a standardized Supertrend with smoothed Heiken-Ashi candles to deliver clear, confirmed, and non-repainting buy/sell signals directly on the chart. It automatically draws Buy/Sell arrows, displays Fast, Slow, and Trend EMA lines, and provides Popup, Email, and Push notifications. Key Features Supertrend-based signal
Gold Trend M1
Van Minh Nguyen
Gold Trend M1 - Optimized Scalping Tool for Gold (XAUUSD) Gold Trend M1 is a high-frequency trading indicator for the MetaTrader 4 platform, specifically optimized for the M1 timeframe on the Gold market. It combines a powerful SuperTrend trend filter with buy/sell signals derived from Heiken Ashi calculation logic, helping traders identify precise and disciplined entry points for optimal trading performance. Key Features Optimized for M1 Scalping: Specifically developed for high-speed scalping
SuperScalp Pro – Supertrend-Based Multi-Filter Scalping Indicator (MT4) SuperScalp Pro is a professional scalping indicator for MetaTrader 4, built around the Supertrend and enhanced with a multi-layer technical filtering system. It is designed to help traders identify high-quality BUY/SELL signals with clear visual guidance and reduced false entries, especially on lower timeframes. MT5 Version Available : A dedicated SuperScalp Pro MT5 version is offered separately, with a structure and optim
PriceActionMatrix - 다중 패턴 스캘핑 어시스턴트  PriceActionMatrix는 여러 단기 가격 행동 패턴을 자동으로 감지하고 검증하는 스캘핑 지표입니다. 각 캔들을 독립적인 신호로 제시하기보다, 핀 바, 엔굴핑, 인사이드 바, 횡보 구역 및 거부 심지와 같은 패턴들을 집계한 다음, 구성 가능한 확인 단계(추세 및 EMA 확인, ATR 범위, 모멘텀 지표 및 선택적 거래량 필터)를 통해 검증하므로, 수동 거래 또는 EA 연동에 적합한 컨텍스트가 풍부한 신호를 받게 됩니다. 리스크 관리가 간단해집니다: 이 지표는 ATR 기반의 SL/TP 가이드를 차트에 그리며 선택적 가격 라벨을 표시할 수 있습니다. 팝업 및 사운드를 통한 명확한 알림이 제공되며, EA 사용을 위한 주요 출력은 iCustom을 통해 노출됩니다. PriceActionMatrix는 빠른 시간 프레임(M1)에 최적화되어 있으며, 더 적고 고품질의 신호를 선호하는 경우 M5에서도 안정적으로 성능을 발휘합니
Golden Buy Sniper Precision Breakout Trading System Golden Buy Sniper is a professional Expert Advisor for MetaTrader 5, built on a Breakout strategy combined with Bollinger Bands and optimized for trading XAUUSD on the M5 timeframe. The EA focuses on high quality BUY setups during the US session and is designed for traders who value accuracy, discipline, and strict risk management. The system integrates 11 advanced confirmation filters, including EMA trend filters, ADX, ATR based volatility fil
Trend Eye MT5
Van Minh Nguyen
Trend Eye – Smart Trend and Signal System for Confident Trading Trend Eye is a smart trading indicator for MT5 that integrates Stochastic RSI, EMA-based color candles, and ATR-based automatic risk management into a clean and intuitive interface. The indicator generates BUY/SELL signals when the Stochastic RSI exits overbought or oversold zones with trend confirmation, while automatically displaying Stop Loss and Take Profit levels directly on the chart. Real-time market states (Uptrend / Downtre
Dynamic Gold Trader – Professional Gold Trading System After many years of research, development, and continuous refinement, Dynamic Gold Trader is introduced as a professional automated trading system designed specifically for XAUUSD (Gold) . The system combines a simple and logical trading concept with advanced risk management and dynamic market adaptation, focusing on long-term stability and account protection rather than short-term over-optimization. Core Trading Principle Dynamic Gold Trad
필터:
리뷰 없음
리뷰 답변