 MetaTrader 5
 エキスパート
 インディケータ
 ライブラリ
ライブラリ
 ユーティリティ
 ウィジェット
 ルール
ルール
YouTubeにあるマーケットチュートリアルビデオをご覧ください
ロボットや指標を購入する
仮想ホスティングで
EAを実行
EAを実行
ロボットや指標を購入前にテストする
マーケットで収入を得る
販売のためにプロダクトをプレゼンテーションする方法
MetaTrader 4のためのテクニカル指標
 以下にリストされているテクニカル指標からのシグナルは、MetaTrader4プラットフォームで取引を開始および終了する際に重要な役割を果たします。
指標の本質は、価格変動の予測を目的とした金融銘柄価格の数学的変換です。
以下にリストされているテクニカル指標からのシグナルは、MetaTrader4プラットフォームで取引を開始および終了する際に重要な役割を果たします。
指標の本質は、価格変動の予測を目的とした金融銘柄価格の数学的変換です。 
Trend Sniper X は、トレーダーがトレンドの方向性と潜在的な反転ポイントを明確かつ正確に特定できるように設計された、MetaTrader 5 用のマルチタイムフレーム・トレンドフォロー指標です。 MT5版はこちら: https://www.mql5.com/en/market/product/181101 価格情報: 現在の価格はプロモーション価格であり、今後のアップデートや新機能の追加に伴い変更される場合があります。 Code2Profit チャンネル マルチタイムフレーム分析で市場をマスターしよう! Trend Sniper Xで勝率を最大化する方法:ルールとセッションのコツ 技術仕様 プラットフォーム MetaTrader 5 インジケータータイプ マルチタイムフレーム・トレンドインジケーター 動作タイムフレーム すべてのチャート時間足(上位足M1~MN1を独立して選択可能) 主要対象銘柄 為替(Forex)、ゴールド(XAUUSD)、その他のCFD 推奨口座 すべての口座タイプ ビジュアル表示 トレンドカラーローソク足(買い/売り/弱い/変化)+ 買い/売りシグナル

2つのオシレーターを組み合わせたもの。 1 つ目はエントリーポイントを表示し、2 つ目は現在のトレンドを表示します。このインジケーターは、すべての高速オシレーター信号または現在のトレンドの方向のみの信号の 2 つのモードで、オシレーター信号を矢印で表示できます。マルチタイムフレームパネルと 3 種類のシグナル通知があります。 利点: デイトレードやスキャルピング取引に適しています トレンドフィルタリング シンプルかつ高感度なセットアップ マルチタイムフレームパネル アドバイザーへの統合に適しています。 あらゆるシンボルとあらゆるタイムフレームに対応 3種類の通知 MT5 version -> HERE / Problem solving -> HERE 指標戦略 このインジケーターは 2 つの異なるオシレーターで構成されます。 遅いトレンド ライン (太い) - インジケーターの高レベルが上から下に交差する場合、それは下降トレンドのインジケーターであり、下側の水平レベル (インジケーターの低レベル) が下から上に交差する場合、それは下降トレンドのインジケーターです。上昇傾向。さら

SR Liquidity は、市場の流動性が集中し、価格が最も強く反応する「隠れたゾーン」を可視化するために設計されたトレーディング指標です。こうした流動性の高いエリアは強力なサポート(支持)およびレジスタンス(抵抗)レベルとして機能し、市場が反転する可能性が最も高いポイントを明確に示してくれます。 単なる一般的なサポートラインやレジスタンスラインを描画するのではなく、「SR Liquidity」は実際の価格変動を分析し、売りと買いの圧力が集中するゾーンを特定します。これらは、市場の真の動きを牽引する「流動性のプール(溜まり場)」そのものです。それらをチャート上に直接可視化することで、価格が実際に反応する前に、その動きを予測することが可能になります。つまり、このインジケーターは価格の方向性が変わる可能性を予測するのです。生のプライスアクションを、市場の重要な水準(転換点となり得るポイント)を示す、明確で実用的なロードマップへと変換してくれます。 このインジケーターは、FX、株価指数、貴金属、仮想通貨など、あらゆる銘柄や時間足で使用可能です。 ご購入後、取引手順や無料の優れた追加インジケ

Super Signal – Skyblade Edition
プロ仕様のノンリペイント / ノーラグ・トレンドシグナルシステム。卓越した勝率を実現 | MT4 / MT5 対応 1分足、5分足、15分足などの低い時間足で最も効果を発揮します。
主な特徴: Super Signal – Skyblade Edition は、トレンド取引に特化したスマートなシグナルシステムです。マルチレイヤーのフィルターロジックを用いて、明確な方向性と実際のモメンタムに支えられた強力なトレンドのみを検出します。 このシステムは 天井や底を予測するものではありません 。次の3つの条件がすべて満たされた場合にのみシグナルを発生させます: 明確なトレンド方向 モメンタムの増加 健全なボラティリティ構造 市場セッションに基づく流動性分析と組み合わせることで、シグナルの精度とタイミングがさらに向上します。 シグナルの特性: すべての矢印シグナルは 100% 非リペイント / 遅延なし 一度出現したシグナルは固定され、点滅・消失しません チャート上の矢印、情報パネル、ポップアップ通知、音声アラート、プッシュ通知

割引は 24 時間後に終了します — 次の価格は$ 69 ZORYK — MetaTrader 4専用 XAUUSDシグナル・トレードプランニングシステム
このような経験はありませんか。
ゴールドを分析し、エントリーを待ち、ようやくポジションを持った直後に価格が逆方向へ動く。
早すぎる決済をしてしまったり、Stop Lossを動かしたり、数秒迷っている間にチャンスを逃したりする。
その後、相場は自分が最初に予想していた方向へ進み、目標へ到達する。
問題は常に方向判断ではありません。
本当の問題は、明確な計画がなかったことです。
どこでエントリーすべきか。
どこでトレードの前提が無効になるのか。
近い利益を確保すべきか、より大きな値動きを待つべきか。
現在のsetupが本当に強いのか、それとも無理にトレードを探しているだけなのか。
ゴールドは非常に速く動きます。
正しい分析でも、明確なプランがなければ数秒で悪い判断に変わることがあります。
ZORYKは、その問題を解決するために開発されました。
ZORYKとは
ZORYKは、MetaTrader 4とXAU

トレンドラインプロ 市場の真の方向転換点を理解するのに役立ちます。この指標は、真のトレンド反転と主要プレーヤーが再び参入するポイントを示します。
分かりますか BOSライン 複雑な設定や不要なノイズなしに、より長い時間足でのトレンドの変化と重要なレベルを把握できます。シグナルは再描画されず、バーが閉じた後もチャート上に残ります。 VERSION MT 5 - RFI LEVELS PRO インジケーター と組み合わせることで、その潜在能力を最大限に発揮します。 インジケーターが示す内容:
本当の変化 トレンド(BOSライン) 一度シグナルが現れたら、それは有効です!これは、リペイント機能を持つインジケーターとの重要な違いです。リペイント機能を持つインジケーターは、シグナルを発した後、それを変更し、資金の損失につながる可能性があります。これにより、より高い確率と精度で市場に参入できます。また、矢印が現れた後、目標値(利益確定)に達するか、反転シグナルが現れるまで、ローソク足の色を変更する機能もあります。 繰り返しエントリ 主要プレーヤーの

M1 SNIPER は使いやすいトレーディングインジケーターシステムです。M1時間足向けに設計された矢印インジケーターです。M1時間足でのスキャルピングのためのスタンドアロンシステムとして、また既存のトレーディングシステムの一部としても使用できます。このトレーディングシステムはM1時間足での取引に特化して設計されていますが、他の時間足でも使用できます。元々、この手法はXAUUSDとBTCUSDの取引用に設計しましたが、他の市場においても役立つと考えています。 インジケーターのシグナルは、トレンドの方向と逆方向に取引できます。インジケーターのシグナルを利用して両方向に取引するのに役立つ特別な取引テクニックをご紹介します。この手法は、特別な動的なサポートとレジスタンスの価格帯を利用することに基づいています。 ご購入後、M1 SNIPER矢印インジケーターをすぐにダウンロードできます。さらに、M1 SNIPERツールのすべてのユーザーに、以下のスクリーンショットに表示されているApollo Dynamic SRインジケーターを無料で提供しています。この2つのインジケーターを組み合わせることで

Smart Trend Trading System は、トレンド情報、エントリー・決済シグナル、価格水準をひとつのチャートにまとめて表示する MetaTrader 4 用インジケーターです。 このシステムは、トレンド検出、反転ゾーン、Smart Cloud、トレーリングストップロジック、サポートとレジスタンス、ローソク足の色分け、アラート、マルチタイムフレーム分析など、 10 種類以上のトレーディングツール を 1 つに統合しています。 このシステムは、さまざまな市場環境での取引をサポートするように設計されています。 トレンド相場:
主要トレンドを特定し、押し目を検出し、モメンタムに従い、ストップロスガイドとトレーリングストップオプションを使って、より明確なエントリーを見つけます。 レンジ相場:
レンジ状態を検出し、反応ゾーンを特定し、価格が重要なレベルから反応したときに、より明確なシグナルを受け取ります。 スキャルピングとデイトレード:
短期売買の判断をサポートするために、高速シグナル、ローソク足の色、アラート、マルチタイムフレーム確認を使用します。 主な機能: • 10 種

Atomic Analyst — MetaTrader 4 製品に関するご質問、設定方法、技術サポートについては、MQL5で直接メッセージをお送りください。 このインジケーターは、複雑な市場計算をシンプルな視覚シグナル、色分けされたローソク足、トレンド表示、ストップロスレベル、複数のテイクプロフィットゾーンに変換し、トレーダーが素早く理解して実際の市場環境で使用できるようにします。 主な取引用途: スキャルピングとイントラデイトレード:
素早い判断、明確な矢印、アラート、ローソク足カラー、構造化されたエントリー/エグジットゾーンのために設計されています。 デイトレードとスイングトレード:
トレンド方向、強さ、モメンタム、マルチタイムフレーム分析を使って、より大きな市場の動きを追うのに役立ちます。 主な機能: • Price Action、強さ、モメンタム分析
• マルチタイムフレームトレンドスキャナー
• 全体トレンド率の計算
• 買いと売りの矢印
• ストップロスと複数のテイクプロフィットレベル
• 最大5つのフィボナッチベースのテイクプロフィットレベル
• トレーリングストップ

PRO Renko Systemは、特別にRENKOチャートを取引するために設計された高精度の取引システムです。
これは、様々な取引商品に適用することができる普遍的なシステムです。 システムは効果的に正確な逆転信号へのアクセスを与えるいわゆる市場の騒音を中和する。
表示器は非常に使いやすく、信号の生成に責任がある1つの変数だけがあります。 あなたは簡単にお好みの任意の取引ツールとレンコバーのサイズにツールを適応させることができます。
私はいつもあなたが私のソフトウェアで収益性の高い取引を支援するために余分なサポートを提供する準備ができています!
私はあなたに幸せで収益性の高い取引をしたいです!
ご購入後にご連絡ください! 私はあなたに私のレンコチャートジェネレータを送信します。 私はまた、私の個人的な推奨事項やシステムの他のモジュールを無料で共有します!

通貨強さウィザードは、取引を成功させるためのオールインワン ソリューションを提供する非常に強力な指標です。このインジケーターは、複数の時間枠のすべての通貨のデータを使用して、このまたはその外国為替ペアのパワーを計算します。このデータは、使いやすい通貨インデックスと通貨パワーラインの形式で表され、特定の通貨のパワーを確認するために使用できます。 必要なのは、取引したいチャートにインジケーターを接続することだけです。インジケーターは、取引する通貨の実際の強さを示します。このインジケーターは、トレンドに合わせて取引するときに有利に利用できる売買高の圧力の極値も示します。このインジケーターには、フィボナッチに基づく可能なターゲットも表示されます。 このインジケーターは、PUSH 通知を含むあらゆるタイプのアラートを提供します。 購入後ご連絡下さい。私の取引のヒントをあなたと共有し、素晴らしいボーナスインジケーターを無料で提供します! 幸せで有益な取引をお祈りします。

現在40%オフ
初心者やエキスパートトレーダーに最適なソリューション!
このインジケーターは、独自の機能と新しい計算式を取り入れた、ユニークで高品質、かつ手頃な価格のトレーディングツールです。たった1枚のチャートで28の為替ペアの通貨強度を読み取ることができます。新しいトレンドやスキャルピングチャンスの引き金となるポイントを正確に特定することができるので、あなたのトレードがどのように改善されるか想像してみてください。
ユーザーマニュアルはこちら https://www.mql5.com/en/blogs/post/697384
これが最初の1本、オリジナルだ! 価値のないクローンを買わないでください。
特別な サブウィンドウの矢印で強い通貨の勢いを表示 GAPがあなたのトレードを導く! 基準通貨や気配値が売られすぎ・買われすぎのゾーン(外相フィボナッチレベル)にあるとき、個別チャートのメインウィンドウに警告表示。 通貨がレンジの外側から反落した場合、プルバック/リバーサルのアラート。 クロスパターンの特別なアラート
複数の時間枠を選択可能で、トレンドを素早く確認できます

Tokyo Indicatorは、トレンドの方向性、潜在的な取引シグナル、および市場状況を視覚的に分かりやすく表示します。 色分けされた階段状のトレンドラインにより、強気局面(青色)と弱気局面(マゼンタ色)が明確に区別されます。トレンドの変化に合わせて表示される方向矢印は、売買の好機を強調します。 統合されたダッシュボードには、現在のシグナル、市場のバイアス(傾向)、モメンタム、ボラティリティ、シグナルの品質がひと目で分かるようにまとめられています。これにより、トレーダーはパネルを切り替えることなく、価格変動(プライスアクション)とインジケーターの数値を照らし合わせて分析を行うことができます。 すっきりとしたチャート表示と簡潔な市場概要により、Tokyo Indicatorはトレンド分析や取引判断における体系的なアプローチをサポートします。 あらゆる時間足や銘柄に対応しており、特に金(ゴールド)の取引に適しています。 トレンド スキャナーの強力なサポートを利用して、無料のインジケーターを入手し、プライバシーを守ります。あーみー!
設定
ShowHUD - チャート上のパネ

「Scalper Vault」は、デイトレードで安定した成果を目指すトレーダーのために設計された、強力かつ充実した機能を備えたトレーディングシステムです。 この高精度なインジケーターは、それ単体で完結するトレーディングシステムとして機能し、FXやバイナリーオプションのトレーダーに、機関投資家レベルの分析を提供します。 ご購入後、ぜひご連絡ください。 トレードのヒントに加え、豪華なボーナスをプレゼントいたします! 「Scalper Vault」を活用すれば、勘に頼った判断や複雑な手動分析は不要です。使いやすいトレード手法に集中し、純粋に「エントリー・決済」という実行フェーズに専念できます。 高精度なトレンドフォロー・シグナル:中核となるアルゴリズムが市場構造を分析し、主要なトレンド方向に沿った高確率なシグナルを提示します。これにより、誤ったエントリーを大幅に削減できます。 精度の高い天井・底の検知:市場の勢いが尽きたポイントをスキャンし、反転の可能性が高いゾーンを特定します。 ギャン(Gann)理論に基づく売買ゾーン:数学的な「ギャン・レベル」を自動的にチャート上に描画します。機関投資家

This is a professional chart indicator designed for traders focused on stability and clear price action. It helps filter market noise and provides clear visual entry and exit zones for your trading decisions. Core Features: Strictly Non-Repainting: The system is built with strict non-repaint logic. What you see on the chart is the true historical performance. Confirmed Signals: Signals are triggered and confirmed only after the candle closes . Once a trading arrow appears on a closed candle, it

現在20%OFF!
初心者やエキスパートトレーダーに最適なソリューションです。
このインディケータは、エキゾチックペア・コモディティ・インデックス・先物など、あらゆるシンボルの通貨の強さを表示することに特化したインディケータです。金、銀、原油、DAX、US30、MXN、TRY、CNHなどの通貨の強さを表示するために、9行目にどのシンボルでも追加することができます。独自の機能を多数搭載し、新しい計算式を採用したため、ユニークで高品質、かつ手頃な価格のトレーディングツールとなっています。新しいトレンドやスキャルピングチャンスのトリガーポイントを正確に把握することができるため、あなたのトレードがどのように改善されるか想像してみてください。
ユーザーマニュアル:ここをクリック https://www.mql5.com/en/blogs/post/708876
すべての時間枠に対応します。あなたはすぐにトレンドを見ることができるようになります! 新しいアルゴリズムに基づいて設計されているため、潜在的な取引の特定と確認がより簡単になります。これは、8つの主要通貨と1つのシンボルの強弱

Scalper Inside PRO は日中トレンドの分析を助け、エントリー前にトレードを組み立てられるインジケーターです。中核となるのは、相場をより正確に読むための3つの専用ストラテジー。シグナルが出た瞬間に方向を自動で判断し、主要な価格帯を計算するので、想定エントリーポイント、予想ストップロス、複数の利確レベルを前もって確認できます。詳細なパフォーマンス統計が、各銘柄とストラテジーが過去にどう機能したかを示し、今の相場に合った資産選びを助けます。単体のスキャルピングツールとしても、あなたのシステムの一部としても、自作 EA のベースとしても使えます。MetaTrader 4 プラットフォームで動作します。 インジケーターはエントリー、3つの利確レベル - TP1、TP2、TP3、そして任意のストップロスをチャート上に直接表示します。自作の矢印インジケーターを接続し、その統計と収益性を検証することも可能です。 ご購入後は直接ご連絡ください。専用のボーナス add-ons、実トレードでの活用に関する追加情報、そしてご自身のトレードシステムや EA への正しい接続のサポートをお渡しします

Liquidity Scalper System: インジケーター形式の流動性ベースのトレーディングシステムです。 多くのインジケーターは矢印を表示するだけで、ストップをどこに置くか、目標はどこか、そのシグナルを信頼してよいかはトレーダー自身が判断しなければなりません。Liquidity Scalper System はトレードの全サイクルをカバーします。流動性プールを見つけ、そのブレイク時にシグナルを出し、Entry、Stop Loss、3つのターゲットを即座に計算し、パネルに統計と新しいデータでの検証結果を表示します。設定はシステムが自動で選び、毎日更新します。 仕組み 1. システムが流動性プールを見つけます。市場参加者のストップ注文が集まっている価格水準です。 2. 価格がプールをブレイクし、そのブレイクが値動きの強さ(必要に応じて出来高)で確認されると、チャートに BUY または SELL の矢印が表示されます。 3. Entry、Stop Loss、TP1、TP2、TP3 の水準がゾーンの塗りつぶしとともに即座に描画されます。 4. 右側に流動性プロファイルが表示され、価

Miraculous Indicator Binary & Forex v3 StrategySafe Miraculous Indicator Binary & Forex v3 StrategySafe は、明確なシグナル、強力な確認ツール、そして Binary と Forex 市場で使える体系的な取引アプローチを求めるトレーダー向けのプロフェッショナル指標です。 v3 では、MIR Dashboard、Miraculous Confirmation Dashboard、GANN Law、Square of 9 レベル、GANN 角度、そしてより高度な Forex モードが搭載されています。 主な特徴 Binary と Forex の両方に対応。 MIR Dashboard による素早い市場分析。 Miraculous Confirmation Dashboard によるエントリー確認。 Forex 分析用の GANN Law drawing lines。 Square of 9 のライン、レベル、方向表示。 1x1 GANN Angle によるトレンド圧力の確認。 Entry I

MT4用 Ultimate AIO ICT Concept Indicator: Smart Money Concepts を自動的にマスターする 毎日何時間も手作業でチャートを分析することに疲れていませんか? AIO ICT Concept インジケーターは、Smart Money Concepts をマスターするための完全なオールインワンソリューションです。手動によるテクニカル分析の推測や感情的な疲労を排除するように設計されたこの強力なアルゴリズムツールは、最も重要なプライスアクション要素をチャート上に直接、自動的にマッピングします。 市場の方向性と上位足のバイアスをマスターする (Master Market Direction and High Timeframe Bias): 市場がどこに向かっているかを知ることは、戦いの半分です。当社の高度な Market Structure マッピングと Change in State of Delivery (CISD) の検出により、真の市場トレンドを即座に特定できます。日次および週次の方向性のバイアスを一目で簡単に判断できます。スイン

Introducing Volume Orderflow Profile , a versatile tool designed to help traders visualize and understand the dynamics of buying and selling pressure within a specified lookback period. Perfect for those looking to gain deeper insights into volume-based market behavior! MT5 Version - https://www.mql5.com/en/market/product/122657 The indicator gathers data on high and low prices, along with buy and sell volumes, over a user-defined period. It calculates the maximum and minimum prices during this

"The Squeeze indicator attempts to identify periods of consolidation in a market. In general the market is either in a period of quiet consolidation or vertical price discovery. By identifying these calm periods, we have a better opportunity of getting into trades with the potential for larger moves. Once a market enters into a "squeeze," we watch the overall market momentum to help forecast the market direction and await a release of market energy." Modified TTM Squeeze Indicator is a modifica

デイトレーダーマスターは、デイトレーダーのための完全なトレーディングシステムです。システムは2つのインジケーターで構成されています。 1つの指標は売買する矢印信号です。それはあなたが得る矢印インジケーターです。 2つ目のインジケーターを無料で提供します。 2番目のインジケーターは、これらの矢印と組み合わせて使用するために特別に設計されたトレンドインジケーターです。 インジケーターは繰り返さず、遅れないでください! このシステムの使用は非常に簡単です。 2色の線で表示されている現在のトレンドの方向に矢印信号をたどる必要があります。青は買いの傾向です。赤い色は売りの傾向です。青い矢印は買いシグナルです。赤い矢印は売りの合図です。トレンドラインの色と一致するように、矢印の色と信号の方向が必要です。 矢印インジケーターは、主に時間間隔M5とM15での日中取引のために作成されました。ただし、技術的には、システムは他の時間間隔で使用できます。 インジケータには、PUSHメッセージ機能を備えたポップアップアラートが装備されています。 購入後、必ず私に書いてください!私はあなたにシステムとの取引の

Gann Made Easy は、ミスター・ギャンの理論を使用した取引の最良の原則に基づいた、プロフェッショナルで使いやすい外国為替取引システムです。 W・D・ガン。このインジケーターは、ストップロスとテイクプロフィットレベルを含む正確な買いと売りのシグナルを提供します。 PUSH通知を利用して外出先でも取引可能です。 ご購入後、取引方法の説明と優れた追加インジケーターを無料で入手するには、私にご連絡ください! おそらく、ギャンの取引手法についてはすでに何度も聞いたことがあるでしょう。通常、ギャンの理論は初心者のトレーダーだけでなく、すでにある程度の取引経験がある人にとっても非常に複雑なものです。なぜなら、ギャンの取引手法は理論的にはそれほど簡単に適用できるものではないからです。私はその知識を磨き、最良の原則を私の外国為替インジケーターに組み込むために数年を費やしました。 このインジケーターは非常に簡単に適用できます。必要なのは、それをチャートに添付し、簡単な取引推奨事項に従うだけです。このインジケーターは常に市場分析の仕事を行い、取引の機会を探します。適切なエントリーポイントを検出す

ZONEFUSION PRO INSTITUTIONAL CLUSTER SYSTEM ZoneFusion Proは、Forexトレーダー向けに設計されたプロフェッショナルグレードのトレーディングシステムです。
精度・構造・一貫性を重視し、実際の機関投資家ロジックに基づいて構築されています。 本システムは、真剣なトレーダー、プロップファーム挑戦者、SMCトレーダー向けに開発されており、曖昧な判断を排除し、明確でルールベースのエントリーフレームワークを提供します。 マルチタイムフレームの市場構造、需給ゾーン、移動平均のコンフルエンスを統合し、高確率エントリーを検出するための完全なトレーディングエンジンです。 主な機能 マルチタイムフレーム市場構造 D1・H4の機関投資家レベルの需給ゾーンを自動検出
価格が反応しやすい重要な流動性エリアを表示
市場構造の変化に応じてゾーンを動的に更新 デュアル移動平均システム 高速・低速の移動平均でトレンド方向を明確化
弱いトレードや逆張りシグナルを排除
機関投資家のモメンタムに沿った取引をサポート マルチタイムフレームトレンド確認 H1とH4の整合性で

Apollo Pips Generator は、トレンドの方向にシグナルを提供するインジケーターです。インジケーターは複数のエントリーポイントを提供するため、常に利益を得る取引機会を見つけることができます。スクリーンショットに注意してください。 スクリーンショットは、上部と下部を示す星の信号が付いたチャネルで表される他のツールと組み合わせたPipsGeneratorツールを示しています。この組み合わせにより、システムを適用する方法が複数提供されます。 購入後、無料で私の2番目のインジケーターを取得するために私に連絡してください。スクリーンショットで示したものとまったく同じシステムになります。 また、このシステムを使用して最良の結果を得る方法についても説明します。 どちらのツールも、プッシュ通知を含むすべてのタイプのアラートを提供します。 私はあなたに幸せな取引を望みます!

All in One package includes the Oscillator Predictor , MACD Predictor , Thrust Scanner and Advanced Fibonacci indicators which are mandatory for applying Dinapoli trade plans.
Please visit below links for detailed explanations of indicators. Advanced Fibonacci Indicator => https://www.mql5.com/en/market/product/52834 Thrust Scanner Indicator => https://www.mql5.com/en/market/product/52830 Overbought /Oversold Predictor indicator => https://www.mql5.com/en/market/product/52621
Macd P

Indicator plots price cycle blocks and sends signals with smart volume confirmation. Price cycles and fractals are combined to determine the demand/supply blocks. The indicator can be used alone or combined with other Cycle Indicators Inputs: Period: Recommended value is between 35 and 55( Which are Set 1 and Set 2 periods of cycle sniper ) Engulfing: If true, you will be able to see the engulfing bar confirmation. Volume Filter: True (The arrow comes with volume confirmation ) Videos with dif

ゴールドラッシュ・トレンド・アロー・シグナル
ゴールドラッシュ・トレンド・アロー・シグナル 指標は、XAU/USDにおける高速・短期スキャルパー向けに最適化された、正確でリアルタイムのトレンド分析を提供します。
1分足専用に設計されたこのツールは、明確なエントリーポイントを示す方向矢印を表示し、スキャルパーが変動の激しい市場状況でも自信を持って取引できるよう支援します。
この指標は、PRIMARY(主要)とSECONDARY(補助)のアラート矢印で構成されています。PRIMARYシグナルは、トレンドの方向転換を示す白と黒の方向矢印であり、SECONDARYシグナルは、PRIMARY矢印が示す方向を確認し、潜在的なエントリーポイントを示す青と赤の矢印です。
注意:トレンド方向の変化後にPRIMARYアラート矢印が1つだけ表示される場合、複数のSECONDARY青/赤矢印が表示される点に注意が必要です。SECONDARYシグナルは、シグナル基準を満たす任意のローソク足後に表示されます。したがって、長期的なトレンド移動の場合、画面に多くのSECONDARY矢印が表示されます(添付の

URトレンド枯渇
UR TrendExhaustion は、パラメータ値やその他の設定を扱いたくないトレーダーにとって最適なソリューションです。誰にとっても簡単で視覚的に理解できるものです。
UR TrendExhaustion を使用する利点:
パラメータなし チャートで何が起こっているかを最もよく表す 3 つの線があります: トレンド枯渇線、クジラ マネー ライン、リテール マネー ラインです。 インターフェイスは、両極端 (赤い領域) のいずれかのラインの枯渇を示しています。 最大の利点: 簡単で、すべてのアセットに合わせて調整できます。 ツールの最新情報を入手できる特別な電報チャットがあり、何か不足していると感じた場合はリクエストを送信することもできます!
なぜ UR TrendExhaustion なのか?
私はキャリアを通じて多くの種類のインジケーターをコーディングしてきましたが、チャート上の他のツールを必要とせずに取引するためのこのシンプルでありながら最高の (imo) ツールをコーディングするためにすべての知識を集めました。 分かりやすく、設定も簡単。

Alright. This indicator works on MT4 and is very easy to use. When you receive a signal from it, you wait for that candle with the signal to close and you enter your trade at the beginning of the next new candle. A red arrow means sell and a green arrow means buy. All arrows comes with a long dotted like for easy identification of trade signal. Are you okay with that?
100% non repaint
Work All Major currency Pair,
1 minute time frame 1 minute expire

Neuro Poseidon is a new indicator by Daria Rezueva. It combines precise trading signals with adaptive TP/SL levels - creating best possible trades as a result! Message me and get Neuro Poseidon Assistant as a gift to automize your trading process!
What makes it stand out?
1. Proven profitability on all assets and timeframes
2. Only confirmed BUY and SELL signals present on the chart
3. Adaptive TP & SL levels generated by the software for each trade
4. Easy to understand - suitable for all

Extreme Value Sniper is a detrended price indicator Indicator finds the potential reversal levels by checking value ranges and price cycles. MT5 Version of the product : https://www.mql5.com/en/market/product/114550
It shows the overbought and oversold levels using the average range. Overbought Levels are between 4 and 10 Oversold levels are bewtween -4 and -10
Those levels can be used as a reversal levels.
Extreme Value Sniper look for some special divergence and convergence patterns to c

KT Parabolic RSI は、RSI ラインの上にパラボリックSARを直接重ねて表示し、市場の転換点をわかりやすく強調します。従来のRSIの買われすぎ・売られすぎ水準はすでに反転を示唆しますが、PSARフィルターを追加することで不要なノイズを取り除き、シグナルをより明確かつ信頼できるものにし、取引機会をより精度の高い形で提供します。 大きな四角シグナル: RSIが買われすぎまたは売られすぎゾーンにあるときにパラボリックSARが反転。このサインは高い確率で市場の転換を示します。 小さな四角シグナル: RSIが中立帯の範囲にあるときのSAR反転。これらは低確率のシグナルとして扱い、部分的な利確や既存トレンドの継続に活用できます。
特徴 RSIのモメンタムとパラボリックSARのトレンド反転を1つの画面に統合し、2つのインジケーターを別々に管理する必要がなくなります。 RSIウィンドウに表示される四角マーカーはメインチャート上にも反映されるため、価格の動きを見ながらシグナルを確認できます。 ローソク足分析とRSI-SARの定量シグナルを組み合わせ、エントリー前にチャートパターンを確認

DayTrader PRO MT5: https://www.mql5.com/en/market/product/186222 DayTrader PROは、ジョン・エリュース(John Ehlers)のラグuerreフィルターと強力な自動最適化エンジンを組み合わせた、高度なトレーディング・インジケーターです。固定されたパラメーターを使用するのではなく、直近の市場状況に基づいて最適な設定を自動的に検索するため、手動による絶え間ない調整をすることなく、変化する市場のボラティリティに適応できます。 本インジケーターは、明確な「買い(BUY)」および「売り(SELL)」シグナルを生成し、現在の市場ボラティリティから算出された適応型のストップロス(Stop Loss)およびテイクプロフィット(Take Profit)レベルを表示します。トレンド、効率レシオ(Efficiency Ratio)、ボラティリティ、およびローソク足フィルターが内蔵されており、精度の低いセットアップを排除し、シグナルの精度を向上させます。 リアルタイム・パフォーマンスパネルには、現在最適化されている設定、プロフィッ

CRT Candle Range Theory HTF MT4 - Ultimate CRT Indicator: 高度なICTコンセプトとMalaysian SnRトレーディングシステム 最も先進的なCandle Range Theoryインジケーターでマーケットメーカーの足跡をマスターしましょう。Ultimate CRT Indicatorを使用して、Smart Money Concepts (SMC)の真の力を解き放ち、機関投資家のように正確にトレードします。真剣なトレーダー専用に構築されたこのインジケーターは、ICT Concepts (Inner Circle Trader)の核となる柱である、非常に効果的なCandle Range Theory (CRT)を自動化し、Malaysian Support and Resistance (SnR)エントリー手法とFVG (Imbalance)ゾーンの致命的な精度でそれを強化します。 MT4またはMT5でForex、Crypto、Indicesのいずれを取引している場合でも、このアルゴリズムは市場のノイズを取り除き、ダマシ(fak

MSNR & OCL Combined:究極のマレーシア式サポート&レジスタンスライン・プライスアクションインジケーター 手動でレベルを描画したり、厚く乱雑なゾーン内で価格がどこで反応するかを推測したりするのにうんざりしていませんか? これで、時間を節約し、絶対的な自信を持って取引できるようになります。広範で曖昧なゾーンを描画する従来のツールとは異なり、 MSNR & OCL Combined は、正確でピンポイントのプライスアクションラインを自動的に描画するように設計された高度な分析ツールです。非常に効果的な マレーシア式サポート&レジスタンス(Malaysia SNR) 手法を簡素化するために特別に設計されており、Breakout & Retest(ブレイクアウト&リテスト)戦略に比類のない精度をもたらします。 主な機能: 新しい独自機能 POI to POI: この強力な「POI to POI(関心領域から関心領域へ)」の反応が発生すると、インジケーターは線の右端に明確な ゴールド/オレンジ色のドット(DOT) を配置することで、新しく形成されたフレッシュな線を強調表示します。

This Indicator only places quality trades when the market is really in your favor with a clear break and retest. Patience is key with this price action strategy!
If you want more alert signals per day, you increase the number next to the parameter called: Support & Resistance Sensitivity. After many months of hard work and dedication, we are extremely proud to present you our Break and Retest price action indicator created from scratch. One of the most complex indicators that we made with over

The indicator very accurately determines the levels of the possible end of the trend and profit fixing. The method of determining levels is based on the ideas of W.D.Gann, using an algorithm developed by his follower Kirill Borovsky. Extremely high reliability of reaching levels (according to K. Borovsky - 80-90%) Indispensable for any trading strategy – every trader needs to determine the exit point from the market! Precisely determines targets on any timeframes and any instruments (forex, met

Channel Pro MT4 Identify high-probability reversal zones with a single glance. Channel Pro MT4 combines a dynamic volatility channel with a color-coded momentum trend line to help traders spot potential price reversals before they develop. When price briefly breaks outside the channel and snaps back, the indicator marks the event with a clear arrow signal directly on the chart — no separate window needed. Key Features Non-repainting — all signals are confirmed on the closed bar only Upper and lo

対称的な三角形のチャートパターンは、価格が上昇または崩壊することを余儀なくされる前の収縮と統合の期間を表しています。下のトレンドラインからのブレークアウトは新しい弱気トレンドの始まりを示し、上のトレンドラインからのブレークアウトは新しい強気のトレンドの始まりを示します。 ダッシュボードを入手して、対称的な三角形のパターンと交換するすべての機器と時間枠を一度に監視してください! https://www.mql5.com/en/market/product/69169/
MT5バージョンはこちらから入手できます:https:// www.mql5.com/en/market/product/70006/
このインジケーターはこれらのパターンを識別し、4つのキーポイントが形成され、価格が再び三角形に戻ったときにアラートを出すので、潜在的なブレイクアウトの準備をすることができます。対称的な三角形は常に完全に対称であるとは限らず、価格は上下する可能性がありますが、通常、最も成功するブレイクアウトは、三角形の最初のポイントを形成した高または低の方向です。したがって、インジケーターはブレイクア
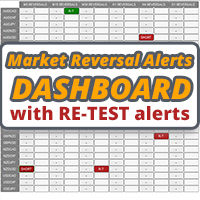
このダッシュボードは、市場構造反転インジケーターで使用するためのアラートツールです。主な目的は、特定の時間枠での取消の機会と、インジケーターと同様にアラートの再テスト(確認)についてアラートを出すことです。ダッシュボードは、それ自体でチャート上に配置され、バックグラウンドで動作して、選択したペアと時間枠でアラートを送信するように設計されています。多くの人々が1つのMT4の複数のチャートで市場反転インジケーターを実行するのではなく、一度に複数のペアと時間枠を監視するためにダッシュを要求した後に開発されました。 M5、M15、M30、H1、H4、およびD1の時間枠でアラートを出します。もちろん、取引の場合と同様に、より高い時間枠が最も効果的です。
このダッシュボードは、市場構造反転インジケーターのアドオンとして設計されています。それは独立して機能し、マーケットリバーサルアラートインジケーターによって与えられたパターンと信号にアラートを出します。
ここでマーケットリバーサルアラートインジケーターを取得します:https:// www.mql5.com/en/market/product
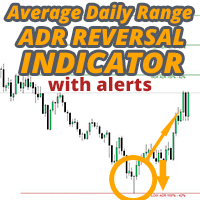
ADR反転インジケーターは、通常の1日の平均レンジに関連して価格が現在取引されている場所を一目で示します。価格が選択した平均範囲とレベルを超えると、ポップアップ、電子メール、またはプッシュを介して即座にアラートを受け取るため、プルバックと逆転にすばやくジャンプできます。インディケータは、チャート上に1日の平均レンジの極値で水平線を描画し、それらを超える価格の数学的確率が付加されているレベルを超える延長も描画します。詳細については、以下をご覧ください... インジケーターとモニターを補完するADRアラートダッシュボードここでも利用可能なすべてのペア:https:// www.mql5.com/en/market/product/62756
MT5バージョンはこちらからも入手できます:https:// www.mql5.com/en/market/product/64477/
通常の1日平均レンジ(ADR)内で価格が取引され、これらのレベルを上回っている時間の約60%は、通常、その後の引き戻し(利益確定)の動きを伴う急激な価格の動きの指標です。毎日の範囲の上部または下部からのプルバ

SMC All-in-One: マーケットストラクチャー&リクイディティ(市場構造と流動性) SMC(スマートマネーコンセプト)アナリティックインジケーターは、スマートマネーコンセプトのアプローチに基づいて価格アクションの分析を自動化します。手動でレベルを描画する代わりに、内部およびスイングの市場構造、オーダーブロック、フェアバリューギャップ(FVG)、流動性レベルをリアルタイムでチャート上にラベル付けします。
機関投資家が注文を配置している可能性が高い場所を特定することで、より正確なエントリーとエグジットのための最適な関心領域(POI)を見つけるのに役立ちます。
インジケーターを初めて使用する場合は、MQL5ブログのステップバイステップの[ユーザーマニュアル]で完全なパラメータ設定をご確認ください。 より深い市場構造の分析をご希望ですか?ブレーカーブロック、リジェクションブロック、リクイディティプール、iFVGなどの追加コンセプトをカバーする無料のコンパニオンインジケーター[SMC Advanced Order Block]をダウンロードしてください。 アップデートとコミュニテ
FREE

トレンドキャッチャーインジケーター
トレンドキャッチャーインジケーターは、開発者独自の適応型トレンド分析指標を組み合わせることで、市場価格の動きを分析します。短期的なノイズを除去し、根底にあるモメンタムの強さ、ボラティリティの拡大、価格構造の挙動に焦点を当てることで、真の市場方向性を特定します。また、移動平均線、RSI、ボラティリティフィルターなどの平滑化およびトレンドフィルタリング機能を備えたカスタマイズ指標も使用します。
実際の運用状況のモニタリングやその他の製品については、こちらをご覧ください: https://www.mql5.com/en/users/mechanic/seller
ご注意ください。私はTelegramでEAや設定を販売していません。詐欺です。すべての設定はブログで無料で公開しています。
重要!ご購入後すぐにご連絡ください。手順とボーナスをお送りします!

Break and Retest Hunter MT4 is a powerful MetaTrader 5 indicator designed to automatically identify support and resistance levels, breakout structures, and potential retest opportunities in real time. Bonus Indicator: After purchasing Break and Retest Hunter , contact me to receive Trade Indicator Assistant EA completely free as a bonus utility.
$65 for the next 10 copies . Next price is $120. Combining adaptive market analysis, clear BUY/SELL signals, Fibonacci-based profit targets, and a pre

Bermaui Bands(BB)は、レンジとトレンドの価格変動をフィルタリングするのに役立つテクニカル分析ツールです。この指標の背後にある考え方は、次のステップで説明できます。 標準偏差を0〜100の間で移動するオシレーターとして計算します。これをBermaui偏差パーセント(BD%)と名付けます。 「BD%」がゼロに近い場合、ボラティリティは極端になります。さらに、「BD%」が100に近い場合、ボラティリティは非常に低くなります。 ボラティリティが高いということは、トレンド市場の可能性が高いことを意味し、ボラティリティが低いということは、横向きまたはレンジング市場を意味します。 標準偏差はSMAに基づいて計算されるため、中央の線は単純移動平均(SMA)です。 計算で同じバー数の単純移動平均に「BD%」を追加して、アッパーベルマウイバンドを取得します。 計算で同じ数のバーを使用した単純な移動平均から「BD%」を減算して、Lower BermauiBandsを取得します。 重要な情報
Bermaui Bandsユーザーズマニュアル: https://www.mql5.com/en/bl

Top Bottom Tracker は、洗練されたアルゴリズムに基づき、市場のトレンドを分析し、トレンドの高値と安値を検出することができるインジケーターです / MT5バージョン 。
価格は500$に達するまで徐々に上昇します。次の価格 --> $99
特徴 リペイントなし このインジケーターは
新しいデータが到着してもその値を変更しません
取引ペア すべてのFXペア
時間枠 すべての時間枠
パラメーター ==== インジケータの設定
設定パラメータ // 40 (値が高いほど、シグナルは少なくなりますが、より正確です)
上レベル値 // 80 (上水平線の値)
下限値 // 20 (下限水平線の値)
インジケータ計算バー // 3000 (何本分のインジケータを計算するか。0を指定すると、全てのバーに対してインジケータを計算します)
==== アラーム設定
ポップアップアラート // true (端末にアラームを表示)
メールアラート // true (アラームをメールで通知)
アラート時間間隔 // 10 (アラーム間隔 (分))
警告

プレシジョン・インデックス・オシレーター(Pi-Osc)は、Precision Trading SystemsのRoger Medcalfによるものです。
バージョン2は、チャートにスーパーファストでロードされるように注意深く再コードされ、その他の技術的な改良も組み込まれて、エクスペリエンスを向上させています。
Pi-Oscは、市場が強制的に行かなければならない、すべての人のストップを取り除くためのポイントである、極限のエクソースト・ポイントを見つけるために設計された正確な取引タイミング信号を提供するために作成されました。
この製品は、極限のポイントがどこにあるかを知るという古代の問題を解決し、トレーダーの生活をはるかにシンプルにします。
これは、業界標準のオシレーターとは異なる強力な要素を持つ高度なコンセンサス・インジケーターです。
使用されている一部の機能には、需要指数、マネーフロー、RSI、スティリング、パターン認識、出来高分析、標準偏差の極値などがあり、異なる長さでこれらのバリエーションが多く含まれています。
初めて見ると、訓練されていない目には、他のオシレーター

Universal Swing Arrows は、スイング取引シグナルを提供するために設計された矢印ベースのインジケーターです。任意の取引ペアと任意の取引時間枠で使用できます。 矢印は現在の (0) ろうそくに表示されます。信号は再描画されません! この指標は、スタンドアロンの取引システムとして、または個人の取引戦略の一部として使用できます。インジケーターの矢印はシグナルであるだけでなく、可能なストップ ロス レベルでもあります。インジケーターは自動的に最適なストップ ロス レベルを計算し、ストップ ロスがあるべきポイントに正確に矢印を描画します。誤ったストップロスのトリガーを避けるために、価格にいくらかのスペースを与える保護タイプのストップロスを使用します。 購入後ご連絡ください。私の取引の推奨事項をあなたと共有し、素晴らしいボーナス指標を無料で提供します! 幸せで有益な取引をお祈りします!

KURAMA GOLD SIGNAL PRO MT4版 ゴールドのサインに、目で見えるトレード計画を。 ゴールドのサインが出た。利確はどこか。損切りはどこか。エントリー前に何を確認すべきか。 KURAMA GOLD SIGNAL PROは、その判断材料をチャートに集約します。XAUUSDのM5、M15向けに、売買サイン、自動計算TP/SL、3段階のサイン評価、注意すべき相場条件を知らせるMARKETパネルを搭載。 セットアップ、決済目安、相場の注意点を一か所で確認。情報を集める手間を減らし、トレードの判断に集中できます。 買い切り購入者限定特典 AI Zone Radar MT5版と完全PDFマニュアルを無料プレゼント。 ご購入後にMQL5でメッセージをお送りください。買い切り購入が対象です。レンタルは対象外です。 AI Zone Radarを見る サインから、具体的なトレード計画へ SMA 13、21、75、100へのタッチを使ったセットアップを検出。各サインに売買方向と対象MAを表示するため、浅い押し目、戻りと深い調整を区別して確認できます。 チャートとパネルには、次の情報を表示し

This indicator is unstoppable when combined with our other indicator called Support & Resistance . After purchase, send us a message and you will get it for FREE as a BONUS! Introducing Trend Punch , the revolutionary forex trend indicator that will transform the way you trade! Trend Punch is uniquely designed to provide precise buy and sell arrows during strong market trends, making your trading decisions clearer and more confident. Whether you're trading major currency pairs or exotic symb

TopBottom Checker は、価格のボトムとトップを決定するインジケーターです。インジケーターは、任意の通貨ペアで使用できます。インジケーターは、M1からD1までの任意の時間枠で機能します。 このインジケーターは、あらゆる戦略にとって非常に重要な市場の側面で機能するため、スタンドアロンのトレーディングシステムとして、または使用するトレーディングシステムの一部として使用できます。インジケーターシグナルは、トレンドに立ち入るため、反転としてのトレンドに逆らうため、およびオープンポジションの閉鎖の可能性を示すため、つまり市場から出るための両方に使用できます。インジケーターは非常に使いやすいです。チャートにインジケーターを追加し、必要に応じてそのシグナルに従う必要があります。このツールは、外国為替取引とバイナリーオプション取引に使用できます。 デフォルトでは、分析は価格の反転を予測するために実行され、そのような条件の形成の最も早い兆候を見つけようとするため、インジケーターはそのシグナルをわずかに再描画する場合があります。再描画はマイナーですが、可能です。しかし、私はそれをゼロに減らす

only 12 free copies left VOLURIS — Volume Profile エンジン
あなたはすでにトレードのやり方を知っています。ただ、本来見るべきものが見えていないだけです。 その感覚を、あなたはすでに経験したことがあるはずです。
エントリーする。価格がすぐに逆行する。ストップにかかる。そしてその直後、価格は反転し、あなたが想定していた方向へ正確に進んでいく。あなたの判断は正しかった。ただ、早すぎた。あるいは遅すぎた。もしくはその両方だった。
後からチャートを見返すと、今なら分かります。エントリーのすぐ上に Naked POC があった。前回セッションの Value Area が、まさに価格が止まった場所にあった。VWAP がレジスタンスとして機能していたのに、あなたのチャートには表示されていなかった。コンテキストはすべてを教えていました。ただ、それを読み取るツールがなかっただけです。
これはトレードの問題ではありません。情報の問題です。
VOLURIS は、その問題を解決するために存在します。
VOLURIS とは
VOLURIS は単なる
FREE

Volume Profile: multi-mode, multi-profile, drawn on the price chart The indicator draws a volume profile directly on the price chart, together with the Point of Control (POC) line, the Value Area (VAH and VAL) and optional peaks and valleys. Instead of reading volume in a separate bottom panel, the volume is shown at the price levels where it was traded, so price and volume can be read in one place. What the indicator displays POC (Point of Control) line : the price level with the highest traded

高度なカスタムCrypto_Forexインジケーター「アダプティブレンジオシレーター」 - MT4向けの効率的な取引ツール! - このインジケーターは新世代のオシレーターです。使い方は画像をご覧ください。 - 「アダプティブレンジオシレーター」には、調整可能なアダプティブ売られ過ぎ/買われ過ぎゾーンやその他の便利な設定があります。 - このオシレーターは、動的な売られ過ぎ/買われ過ぎエリアからの決済時に、正確なエントリーポイントを見つけるのに適したツールです。 - 売られ過ぎゾーン:青線より下。 - 買われ過ぎゾーン:黄線より上。 - このインジケーターは、高速スキャルピングやトレンド戦略で価格調整の終了を検知するのに適しています。 - 標準的なオシレーターよりもはるかに正確です。 - インジケーターは任意の時間枠で使用できます。 - PCとモバイルの両方にアラート機能を搭載しています。 Click here to see high quality Trading Robots and Indicators! これは、このMQL5ウェブサイトでのみ提供されるオリジナル製品です。
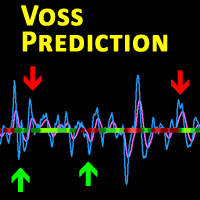
Description This is a modified version of the popular Voss Predictive Filter - A peek into the future by Dr. John Ehlers. It contains 2 lines - V-Line (blue) and F-Line (red), a trend indication and BUY/SELL signals.
Usage Buy Green dots indicate an up trend. Open a BUY position if the V-Line crosses the F-Line from below and an up trend is signaled (green dots) Close BUY position if V-Lines falls beneath F-Line again Sell Red dots indicate a down trend Open a sell position if V-Line falls

Prop Firm Sniper MT4 is a professional market structure indicator that automatically identifies high-probability BUY and SELL opportunities using BOS and CHoCH analysis.
Recommended Timeframes: For backtesting, use the indicator on M5 or M15 for Gold (XAUUSD), and M15 or H1 for more volatile Forex pairs such as GBPUSD, USDJPY, EURGBP , and similar markets.
CONTACT ME AFTER PURCHASE TO CLAIM YOUR FREE BONUSES!
Prop Firm Sniper is a professional market structure indicator designed t

## THE CHART, READ FOR YOU.
Chart reading is slow, and it is easy to get wrong. You need to know which highs and lows actually matter, which ones the market has already invalidated, and what the ones that remain are telling you. Miss a point and the whole read changes.
Cycle Finder Pro marks TRUE highs and lows, and nothing else.
A high is confirmed when two subsequent bars each take out the low beneath them. A low when two take out the high above. The bars need not be consecutive — the marke

このインジケーターや その他のインジケーターを無料で 入手: インジケーターを取引ロボットに変換(プログラミング不要) 特別オファー : ALL TOOLS 、各 $35 、 期間限定 ! 新しいツール になるだろう 30ドル のために 最初の週 または 最初の3回の購入 ! MQL5 の取引ツール チャネル: 私の MQL5 チャネルに参加して最新の更新を受け取ります マルチタイムフレーム & マルチシンボルガイド: マルチタイムフレーム & スキャナ ユーザー ガイド - 12 言語で利用可能 MT5 のバージョンは次の場所で確認できます。 Volumatic VIDyA MT5 Multi-Timeframe Scanner MT4 のバージョンは次の場所で確認できます。 Volumatic VIDyA MT4 Multi-Timeframe Scanner その他の製品については、次のサイトをご覧ください。 すべての製品 または 取引指標、特別オファー & 新しいリリース Volumatic VIDyA Multi-Timefram

現在30%オフ 初心者にもエキスパートトレーダーにも最適なソリューション このインジケーターは独自の機能と新しい公式を多数内蔵しており、ユニークで高品質かつ手頃な取引ツールです。このアップデートでは、2つの時間枠ゾーンを表示できるようになります。より長いTFだけでなく、チャートTFとより長いTF(ネストゾーンを表示)の両方を表示できます。すべてのSupply Demandトレーダーの皆さんのお気に召すはずです。:)
重要情報の公開 Advanced Supply Demandの可能性を最大化するには、 https://www.mql5.com/ja/blogs/post/720245 にアクセスしてください。 エントリーまたはターゲットの正確なトリガーポイントを正確に特定できれば取引がどのように改善されるか想像してみてください。新しい基盤となるアルゴリズムに基づいて構築されているため、買い手と売り手の間の潜在的な不均衡をさらに簡単に特定できます。これは、最も強い需要と供給のゾーンと、過去のパフォーマンス(古いゾーンを表示)がグラフィカルに表現されるためです。これらの機能は、最適な

OrderFlow Absorption – MT4用プロフェッショナル・デルタ&アブソープションシグナルインジケーター OrderFlow Absorptionで本物のオーダーフロー分析の力を解き放ちましょう。MetaTrader 4向けの究極のデルタヒストグラム&アブソープションシグナルインジケーターです。あらゆる価格変動の裏側で何が起きているのかを知りたいトレーダーのために設計されており、市場を動かす隠れた買い/売り圧力や吸収イベントを明らかにします。 特徴 デルタヒストグラムの可視化: 買い圧力・売り圧力を色分けされたヒストグラムで即座に表示。 アブソープションシグナル検出: 高度なロジックで強気・弱気の吸収イベントを特定し、反転の兆しを早期に通知。 チャートマーカー: 吸収シグナルをチャート上に直接マークし、視覚的に分かりやすく表示。 ポップアップアラート: 新しい吸収シグナルが出現した際にリアルタイムで通知。 カスタマイズ可能な閾値: 弱いシグナルを除外し、高確率のセットアップに集中。 リソース管理: 大きなチャートでも高速に動作する効率的な計算。

Quantum Naked SMC Prime is a streamlined Smart Money Concepts indicator designed for traders who prefer a clean chart, structured market analysis and clear visual trade setups without unnecessary complexity. The indicator combines market structure, liquidity behavior, institutional zones and confirmation logic into a compact analytical framework. Instead of flooding the chart with technical indicators, Quantum Naked SMC Prime focuses on the core elements of price action and Smart Money Concepts

Trend Exhaustion Scanner Indicator As is well known, any long, steady movement increases the likelihood of a sharp reversal with each step. This indicator searches for narrow trends where movement occurs with minimal correction, running out of steam, and approaches the moment of reversal. The user simply sets a condition: the minimum number of consecutive candles without reversals, and the indicator on the information panel will display symbols, a timeframe, and a number of candles equal to or

Multi Anchor VWAP Pro MT4 – Pure Anchored VWAP | Adaptive σ-Bands | Smart Alerts Precision VWAP anchoring, purpose-built for MetaTrader 4. One-click anchors, dynamic σ-bands or %-bands and instant multi-channel alerts—ideal for scalpers, intraday and swing traders who need institutional-grade fair-value mapping. Public channel: CLICK HERE
Full User Guide – Need MT5? Click here WHY PROFESSIONAL TRADERS CHOOSE MULTI ANCHOR VWAP PRO VWAP is the institutional benchmark for fair value. This MT4

FORBEX PRO v17 Murrey Math • Market Profile • Volume Profile • Gann • Fibonacci • Auction Structure A complete market-analysis workspace for MetaTrader 4. FORBEX PRO v17 brings several analytical frameworks into one coordinated chart environment, allowing you to study price structure, value, volume, geometry, time and market behaviour without stacking multiple unrelated indicators on the chart. This can genuinely become the main analytical indicator on your MT4 workspace. It is not designed simp

Interactive AVWAP Pro for MT4 v7.0 — Institutional Volume-Weighted Average Price Analysis Interactive AVWAP Pro for MT4 is a high-performance Anchored Volume-Weighted Average Price (AVWAP) indicator for MetaTrader 4. It brings the intuitive Drag-and-Drop functionality of modern charting platforms directly into MT4, providing real-time recalculations with zero lag. Key Features of Version 7.0 Interactive Drag-and-Drop: grab and position the anchor point anywhere on the chart using your mouse (key
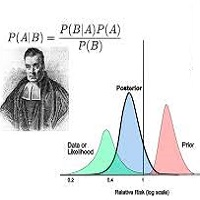
Bayesian methods can be effectively applied to predict price trends in financial markets, including Forex, stocks, and commodities. Here’s how Bayesian techniques can be used for trend prediction: 1. Bayesian Linear Regression Bayesian linear regression can be used to model the relationship between time and price. This method allows for the incorporation of prior beliefs about the trend and updates the trend as new data comes in. Example: Suppose you want to predict the price trend of a curren

発見が困難で頻度が少ないため、分岐は最も信頼できる取引シナリオの1つです。このインジケーターは、お気に入りのオシレーターを使用して、通常の隠れた分岐点を自動的に見つけてスキャンします。 [ インストールガイド | 更新ガイド | トラブルシューティング | よくある質問 | すべての製品 ]
取引が簡単
通常の隠れた発散を見つけます 多くのよく知られている発振器をサポート ブレイクアウトに基づいて取引シグナルを実装します 適切なストップロスおよび利益レベルを表示します
設定可能なオシレーターパラメーター カスタマイズ可能な色とサイズ バー単位でサイズ別に分岐をフィルタリング パフォーマンス統計を実装します 電子メール/音声/視覚アラートを実装します 幅広い市場の見通しを提供するために、異なるオシレーターを使用して、干渉なしで同じチャートにインジケーターを何度もロードできます。このインジケーターは、次のオシレーターをサポートしています。 RSI CCI MACD オスマ 確率的 勢い 素晴らしい発振器 加速器発振器 ウィリアムズパーセントレンジ 相対活力指数 特に外国為替市場では、

Neuro Athena is an absolutely new way to get precise entry and exit trading signals. It uses the Fibonacci sequence as the basis for the calculation of its levels. With Neuro Athena you will always know when to open and close your trades with confidence. Message me and get Neuro Athena Assistant as a gift to automize your trading process! Why should you choose Neuro Athena? 1. Reliable Algorithm. Fibonacci sequence is not a new-age marketing slop that feels the Internet nowadays - it is one of
FREE
123456789101112131415161718192021222324252627282930313233343536373839404142434445464748495051525354555657585960616263646566676869707172737475767778798081828384858687888990919293949596979899100101102103104105106107108109110111112113114115116117118119120121122123124125126127128129130131132133134135136137138139140141142143144145146147148149150151152153154155156157158159160161162163164165166167168169170171172173174175176177
MetaTraderマーケットは、開発者がトレーディングアプリを販売するシンプルで便利なサイトです。
プロダクトを投稿するのをお手伝いし、マーケットのためにプロダクト記載を準備する方法を説明します。マーケットのすべてのアプリは暗号化によって守られ、購入者のコンピュータでしか動作しません。違法なコピーは不可能です。

取引の機会を逃しています。
- 無料取引アプリ
- 8千を超えるシグナルをコピー
- 金融ニュースで金融マーケットを探索