 MetaTrader 5
 エキスパート
 インディケータ
 ライブラリ
 ユーティリティ
 ウィジェット
 ルール
YouTubeにあるマーケットチュートリアルビデオをご覧ください
ロボットや指標を購入する
仮想ホスティングで
EAを実行
EAを実行
ロボットや指標を購入前にテストする
マーケットで収入を得る
販売のためにプロダクトをプレゼンテーションする方法
MetaTrader 4のためのテクニカル指標 - 176
 以下にリストされているテクニカル指標からのシグナルは、MetaTrader4プラットフォームで取引を開始および終了する際に重要な役割を果たします。
指標の本質は、価格変動の予測を目的とした金融銘柄価格の数学的変換です。

Market Projection Pro — MT4 Want to visualize how the price cycles in your chosen chart section could extend? Market Projection Pro analyzes a historical window you select, extracts cycle components and draws a composite projection to its right. You control the source window and forward horizon to compare the scenario with price structure and potential turning zones. What you see on the chart Interactive boundaries let you select a historical analysis window directly on the chart. Cycle componen

反转边缘系统は MetaTrader 5専用のプロ仕様高値安値反転インジケーターです。潜在的なトrendo反転ゾーンを検出し、明确なトoreードシグナルを生成. 因ジケーターはriaルタイムで市场センチメントを表示します: 强気 弱気 やや强気 やや弱気 强弱コンfurikuto 各shigunaruにはrisuku管理のため事前设定された利益确定(TP)・损切り(SL)水平が付属します。インジケーターにはシグナルバックテスト机能が搬运され、胜率・総シグナル数の主要统计を算出。 toreダーはチャート上で过去pafuォーマンsuを视覚的に评论価可能です。 主要机能: 高値安値反転shigunaru マルチタイムfurureーム (MTF) torendo 确认firuta riarutaimu 市场センチメントラベル シググルに利益确定·损切り各携带 シグググルバックテストシミュureーショn 胜率・総シグナル数の统计 外国为替、暗号资产、株価指数、商品に対応 重新描画なし阿拉特 検证済みの反転セットアップと内蔵risuku管理で、より贤くtoreードし

Institutional Checklist You know your rules. The difficult part is following them when you want the trade. The market starts moving. One indicator looks convincing. Another disagrees. You feel the pressure to act—and suddenly, the conditions you carefully defined yesterday become negotiable today. Institutional Checklist brings your attention back to your process. This interactive indicator for MetaTrader 4 guides you through your own analysis, one component at a time, then combines your answers

トレンドラインを自動で描画。いい形は保存して、根拠として残す。 TrendLineSnap は、高値の山どうし・安値の谷どうしを自動で結び、トレンドラインを1本ずつ引くインジケーターです。三角保ち合い・チャネル・ウェッジ・水平線など、ライントレードで使う形がラインで浮かび上がります。 トレンドラインは新しい山や谷ができると引き直されます。この形でトレードしたいと思ったら保存しておくと、そのラインは動きません。レートが反応しそうな場面で保存したラインを表示し、跳ね返る・止まってから抜けるなどの反応を確かめられます。 高値・安値のトレンドラインを自動で描画 触れた回数で絞り込み 収束を表示(三角保ち合い・ウェッジ) ラインを5つまで保存(MT を再起動しても残る) 保存した時刻と経過時間を表示 ラインまでの距離と状態をパネルに表示 通知機能(音・ポップアップ・メール・スマホ) 時刻を各国の時間で表示(夏時間に対応) 動かせるパネル(画面の拡大表示に対応) 売買の合図は出しません。利益を保証するものではありません。

今の値段がレンジのどこにいるかを、パネル1枚で。 BoxRangeSnap は、高値・安値に何度も触れた価格帯(レンジ)を自動で見つけ、大きいボックスと小さいボックスとして描くインジケーターです。今のボックスの上限・下限までの距離をパネルに表示し続けます。 ボックスレンジを大小2種類で自動描画 見つけ方を設定で調整(触れた回数・帯の幅・レンジらしさ) 上限・下限までの距離(pips・%)をパネルに表示 フィボナッチの位置(23.6・38.2・50・61.8%)を表示 直近のボックスを5つまで保存して、いまも効いている上限・下限を根拠にできる(MT を再起動しても残る) 保存した時刻と経過時間を表示 通知機能(音・アラート・メール・スマホ) 時刻を各国の時間で表示(夏時間に対応) 動かせるパネル 売買の合図は出しません。利益を保証するものではありません。

Reversal Edge Prime Reversal Edge Prime is a comprehensive and highly visual trading tool designed to automatically identify high-probability Reversal and Continuation zones. What sets this indicator apart is its ability to provide a complete, ready-to-use trading plan right on your chart—showing you exactly where to enter, where to place your stop loss, and where to take profit. The indicator is strictly non-repainting (signals are confirmed on candle close) and is incredibly easy to use for bo

Crypto_Forex インジケーター HTF移動平均線 MT4用 - MT4対応のプロフェッショナルHTF MAインジケーターで、トレード手法をアップグレードしましょう。HTFとはHigher Time Frame(高時間枠)の略です。 - このインジケーターは、プライスアクションエントリーを行うトレンドトレーダーに最適です。 - HTF MAインジケーターを使用すると、高時間枠の移動平均線を現在のチャートに貼り付け、主要なトレンドの方向を追跡できます。 - このインジケーターは高時間枠のトレンドを表示します --> これは常に利益を生む方法です。 - HTF MAインジケーターは、低リスクで大きな利益を得る機会を提供します。 使用方法: - D1からH4またはH1チャートにMAを貼り付けます。 - H4からH1、M30、またはM15チャートにMAを貼り付けます。 - その他(画像を参照)。 高品質のトレーディングロボットとインジケーターをご覧になるにはここをクリックしてください! これは、このMQL5ウェブサイトでのみ提供されるオリジナル製品です。

高度なカスタム暗号通貨・FXインジケーター「アダプティブ・トレンド・オシレーター」 - MT4向けの効率的な補助トレーディングツール! 再塗装なし。 - このインジケーターは新世代のオシレーターです。主要トレンドとの組み合わせ方法については画像をご覧ください。 - 調整可能な適応型売られすぎ/買われすぎゾーンを備えています。 - このオシレーターは、売られすぎ/買われすぎゾーンから主要トレンドの方向へ正確なエントリーポイントを見つけるための補助ツールです。 - 売られすぎゾーン:緑色のラインの下 - 買われすぎゾーン:青色のラインの上 - アダプティブ・トレンド・オシレーターは、他の適切なトレンドインジケーターと組み合わせて使用できます。 - 標準的なオシレーターよりもはるかに高精度です。 - インジケーターはあらゆる時間足で使用できます。 - PCおよびモバイル向けのアラート機能を内蔵しています。 Click here to see high quality Trading Robots and Indicators! この製品はMQL5ウェブサイトでのみ提供されているオリジナ

Price Action Scanner PRO is a multi-symbol and multi-timeframe candlestick pattern scanner for MetaTrader 4 . The indicator helps traders save time by monitoring multiple instruments and identifying recent Price Action formations from a single chart. Detected patterns are displayed in a compact dashboard , with direct navigation to the corresponding signal candles. Supported Price Action Patterns The scanner detects five candlestick formations: Pin Bar — bullish and bearish candles with a promi

テクニカル指標開発の第一人者であるトム・デマークが考案した TDシーケンシャルは、 トレンドの転換点を判断するのに有用なインディケータです。このインディケータは TDシーケンシャルを裁量およびEAで実際に利用してきた私自身の経験から、より手軽に、かつ効果的に活用できるよう作成された裁量トレード用サインツールです。
この TDシーケンシャルをSupply and Demandと合わせて利用できるのがこのツールの最大の特徴です。例えば価格がDemandゾーンにあるときに TDシーケンシャルのシグナルが出ればより高い精度で反発が期待できます。
また、強いトレンドが生じている際に多くのだましが生じるのはTDシーケンシャルの弱点と思われますが、これを克服するために強力なフィルターを装備しています。また、最も有効と思われるセットアップ9に絞ってサインを発信します。
全通貨ペア、全タイムフレームで利用できます。勝敗判定機能により、このインディケータの直近の相場環境に対する有効性を確認できます。
設定項目は下記のとおりです。 Long...Long方向のシグナルを有効にします。Go

XAU AI Trend Engine Pro — Algorithm Overview XAU AI Trend Engine Pro is an automated trend-following and breakout indicator optimized specifically for Gold (XAUUSD). The core algorithm operates on four streamlined principles: Dual EMA Trend Filtering : Employs a fast line (9 periods) and a slow line (21 periods) to determine market direction. A fast-line crossover above the slow line indicates a BUY signal, while a crossover below indicates a SELL signal. ATR Dynamic Channel : Incorporates 14-pe
FREE

FXB Confluence Engine follows the trend with a range filter and, each time that trend turns on a closed bar, scores how much of the market agrees with the new direction. Momentum and the EMAs, four other timeframes, a higher-timeframe bias, the same filter at two wider settings, volatility, RSI and volume each add points, and a choppy market takes points away. A BUY or SELL prints only when the score reaches your minimum and every filter you have switched on is open. A dashboard on the chart sh

Range Zones M30 draws zones on your chart where price was pushed back hard on the 30-minute timeframe. It works on any symbol and any chart timeframe, and reads only the prices your terminal already has. It does not use any server, does not send anything out, and does not open or change orders. What It Shows A resistance zone above the market and a support zone below it, as filled rectangles that start at the open of the swing candle that formed them and run to the right. At any moment there is

Angora Patterns finds, draws and tracks chart patterns for you. It recognises 23 classic chart patterns, 8 harmonic patterns and 13 candlestick patterns, and gives every pattern a breakout level, a target, an invalidation level, a state and a quality score. Chart patterns: Double Top and Bottom, Triple Top and Bottom, Head and Shoulders, Inverse Head and Shoulders, Rounding Top and Bottom, Ascending, Descending and Symmetrical Triangle, Rising and Falling Wedge, Rectangle, Ascending and Descend

### Crossfire Pro MT4: Precision HYBRID Indicator
**Crossfire Pro** is an institutional-grade hybrid indicator engineered specifically for MetaTrader MT4. A volatility-adapted hybrid indicator for MetaTrader MT4 (Crossfire Pro) that pairs Average True Range (ATR) volatility expansion bands paired with tick volume surge filters to signal high-probability swing and momentum entries with signals evaluated strictly on closed bars to prevent repainting and on-chart signal markers and terminal alert

Retest Pivot Signals は MetaTrader 5 用のインジケーターで、重要なピボット水準のブレイクアウトを検出し、その水準がリテストされた後にだけシグナルを出します。つまり、価格がブレイクした線まで戻り、そこから反発したときにシグナルが出ます。これにより、だましのブレイクの一部を除外できます。シグナルはブレイクの瞬間ではなく、水準が確認された後に出ます。 MT5-version: https://www.mql5.com/en/market/product/200224
仕組み インジケーターはピボット高値とピボット安値を探します。ある高値(または安値)の左右に、設定した本数のローソク足があり、それらの高値が低い(または安値が高い)場合にピボットとして確定します。 チャートに2本の階段状のラインを描画します。 赤 は直近のピボット高値、 緑 は直近のピボット安値です。オレンジのラインは EMA です。 Long: 終値が直近のピボット高値を上回って確定し(上方ブレイク)、その後価格がその水準へ戻って許容ゾーンに触れ、再び水準の上で終値を付けます。ローソク足の

チャートのダウ理論の形を、ひと目で。 DowTheoryVisual は、スイングの高値・安値に HH・HL・LH・LL の印を付け、上昇は青・下降は赤・レンジは灰色でジグザグを描くインジケーターです。今の足と上位足2つのトレンドをパネルに並べて表示します。 HH・HL・LH・LL を自動表示 トレンドで色分けしたジグザグ 矢印サイン(トレンドが変わった足に) 上位足2つのトレンドをパネルに表示(ボタンで切り替え) 転換の値段(トレンドが変わる目安)と pips レジサポと高安ライン ローソク足をトレンドの色に 通知機能(転換・3つの時間足がそろったとき/音・アラート・メール・スマホ) 動かせるパネル(画面の拡大表示に対応) 売買の合図は出しません。利益を保証するものではありません。

9つの時間足の意識ラインを自動で引き、抜けた瞬間を知らせる。 高値・安値が何度も止められた価格帯は、多くのトレーダーが意識している意識ラインです。BreakerDetectPro は、この意識ラインを1分足から月足までの9つの時間足で自動で引き、価格が抜けた瞬間をブレイクアウトとして知らせるインジケーターです。 意識ラインを自動で描画(上下1本ずつ) 9つの時間足に対応(上位足の線をいまのチャートに重ねる) ブレイクアウトの検知(パネルの点滅と音) 押し戻しまで検知を継続(戻したらすぐ次を待つ) ダウ目線を時間足ごとに表示(上目線は青、下目線は赤) 通知機能(メール・スマホ・アラート・音。時間足ごとに選べる) 通知に判断の材料を記載(ダウ目線と近くの意識ライン) スナップショット(5つまで保存。MT を再起動しても残る) 検出の調整(ジグザグの本数・検出幅・検知幅) 動かせるパネル(画面の拡大表示に対応) 売買の合図は出しません。利益を保証するものではありません。

О продукте Yearly Rects — авторский индикатор для MetaTrader 4, который автоматически строит диапазоны каждого торгового года прямо на графике и рассчитывает прогнозируемую ценовую цель следующего года на основе статистики предыдущего. Индикатор создан специально для работы с фондовыми индексами (S&P 500, NASDAQ, DAX, FTSE, Nikkei, MOEX и др.), где годовые циклы имеют ярко выраженный характер и исторически хорошо отрабатывают уровни открытия/закрытия. Однако методика универсальна — её

### Triad Breakout Pro MT4: Precision HYBRID Indicator
**Triad Breakout Pro** is an institutional-grade hybrid indicator engineered specifically for MetaTrader MT4. A volatility-adapted hybrid indicator for MetaTrader MT4 (Triad Breakout Pro) that pairs Average True Range (ATR) volatility expansion bands paired with tick volume surge filters to signal high-probability swing and momentum entries with real-time multi-bar execution signals and real-time chart popups and mobile push notifications.

QUARTER ZONE SCALPER
Pullback signals · 25 % quarter zone target · live hit-rate lab · MT4 + MT5 Quarter Zone Scalper turns a simple pullback scalping method into clear, non-repainting signals. A trend ribbon sets the side, price pulls back through the EMA 20 and closes back on the trend side, and a stochastic 8 / 5 / 3 cross confirms. Every signal comes with the pullback swing, a stop and four targets - with the 25 % "quarter zone" as the main target. The idea: the less of a move you ask

Daily Trend Confluence Scanner Daily Trend Confluence Scanner is a systematic multi-indicator trend-following tool designed to spot high-probability trade setups while filtering out market noise. By evaluating market conditions strictly on completed daily candle closes (shift = 1), this indicator provides reliable, non-repainting signals based on four layers of technical confirmation. Key Features 100% Non-Repainting: All calculations freeze upon daily candle close (shift = 1), eliminating

SMC LEGENDS $56 NOW → $66 NEXT | Price +$10 every 10 copies sold | MT5 VERSION HERE . updates posted regularly | DON'T MISS IT! SMC LEGENDS is a professional institutional-grade Smart Money Concepts (SMC) trading engine for MetaTrader 5 . combining market structure analysis, TPO Market Profile, auto signal alerts, live trade management, and a full trading command center in one indicator. Core Features # Fea

MT4用FXインジケーター「8シンボルCCI」(リペイント機能なし) - CCIは、トレードで最も人気のあるオシレーターの一つです。 - Commodity_Channel_Index(CCI)は、現在の価格と過去の平均価格の差を測定します。 - 重要なレベル:+/-200 - +200以上のゾーンで売りエントリー、-200以下のゾーンで買いエントリーを取るのに最適です。 - 「8シンボルCCI」は、1つのチャート上で最大8つの異なるシンボルのCCI値を制御できます。 - このインジケーターは、プライスアクションエントリーと組み合わせるのにも最適です。 Click here to see high quality Trading Robots and Indicators! これは、このMQL5ウェブサイトでのみ提供されるオリジナル製品です。

Crypto_Forex MT4用インジケーター「 Micro M and Micro W Patterns Pro 」は、リペイントや遅延なしで動作します。 - インジケーター「Micro M and Micro W Patterns Pro」は、プライスアクション取引に非常に効果的なインジケーターです。 - インジケーターはチャート上のMicro MパターンとMicro Wパターンを検出します。 - 強気のMicro Wパターン - チャート上に青い矢印シグナルを表示します(画像参照)。 - 弱気のMicro Mパターン - チャート上に赤い矢印シグナルを表示します(画像参照)。 - PCとモバイルの両方でアラート機能を搭載しています。 - インジケーター「Micro M and Micro W Patterns Pro」は、サポート/レジスタンスレベルとの組み合わせにも最適です。 - どの時間足でも使用できます。 - トレンドの転換やトレンド調整の終了を検知するのに最適なインジケーターです。 - インジケーターには情報表示機能があり、接続された通貨ペアの現在のスプレッドとスワッ

ApexConverge は、トライアングル(上昇・下降・シンメトリカル)を自動検出し、境界線を塗りつぶしゾーン付きで描画して、ブレイクしたバーに矢印を表示する MetaTrader 5 用インジケーターです。 MT5-version: https://www.mql5.com/en/market/product/200424
仕組み スイングの高値・安値を検出し、それらを通る 2 本のトレンドラインを引いて形状を判定します。上辺が水平で下辺が上昇なら上昇トライアングル、上辺が下降で下辺が水平なら下降トライアングル、傾きが近い 2 本が収束していればシンメトリカルです。ブレイクするまで価格はパターン内に収まっている必要があります。パターンは数本遅れて表示され( Swing confirmation (bars after) 参照)、確定したシグナルは再描画されません。 トレードでの使い方 上昇トライアングル (水平のレジスタンス):上方向へのブレイクに注目するのが一般的です。 下降トライアングル (水平のサポート):下方向へのブレイクに注目するのが一般的です。 シンメトリカル :中立

PRL Levels is a MetaTrader 4 indicator that displays structured and evenly spaced psychological price levels directly on the chart. It is designed to make price structure easier to read visually. It does not open, manage or close trades.
The indicator can be used on Forex symbols, indices and CFDs. Distances are entered in conventional pips for Forex and in direct price units for indices and CFDs. The appropriate unit is detected automatically from the symbol specifications provided by the bro

Signal Confirm watches one symbol and tells you when a trend setup has passed a fixed chain of checks. It works on any symbol and any chart timeframe. It reads only the M1 prices, the prices of the oscillator timeframe (M5 by default) and the daily prices your terminal already has, does not use any server, does not send anything out, and does not open, change or close orders. It shows what happened and when; the decision stays with you. What It Does When the chain below is complete, the indicato

QCL RSI Flow Candles — MetaTrader 4 QCL RSI Flow Candles transforms RSI momentum into smoothed Heikin Ashi-style candles in a separate indicator window. Candle bodies, wicks, a directional trend line and reference zones provide a visual framework for assessing momentum, pullbacks and changing conditions. Key Features RSI-based candles: View momentum through candle structure instead of a conventional RSI line. Directional colors: Green candles indicate that the oscillator close is at or above its

this indicator Draws Two Trend Lines automatically. my intend of use is :- 1 . For Buy Entry Make sure The Blue trend line is in Upward and Trending and also the Redline is in Horizontal.
2 . For Sell Entry Make sure the Red Line is in Downward and its Trending and also the Blueline is in Horizontal.
3. use caution, Technical confirmations is needed always. any info please submit a message.

This is MT4 indicator that automatically finds Edge of Trend where it makes Draw Down.
Examples
1 . Buy if The Two trend lines align up
2. Sell if the two trend lines align down
you can also make likes these
1. Buy if drawdown line is (yellow line) that upwards and Trend (Blue line) is Down 2. Sell if drawdown line is (yellow line) that downwards and the Trend (Blue line) is up
for any comments and contats submit message.

SMC Super position - Smart Money Structure & Liquidity Intelligence Professional multi-module market structure, liquidity and trade-planning indicator for MetaTrader 5, designed to combine structural analysis, liquidity behavior, trend context and confirmed signal logic in one compact workspace. The system includes Smart Money structure tools, an independent Master Signal engine, Confluence setups, Scalping analysis, Queen Trend context, multi-timeframe routing and an integrated Signal History d

Volatility Dots puts a trailing line of dots on your chart. In an uptrend the dots sit under the price, in a downtrend above it, and they flip when price closes through the opposite band. It works on any symbol and any timeframe. It reads only the prices your terminal already has, does not use any server, does not send anything out, and does not open or change orders. What It Shows One dot per bar. White dots under the candles mark a rising trend, red dots above the candles mark a falling trend.

CrowdTrap MultiAsset Liquidity MT4 CrowdTrap MultiAsset Liquidity is a technical analysis indicator for MetaTrader 4 designed to identify market structure, liquidity levels, liquidity sweeps, price retests, and potential trading scenarios. The indicator combines multi-timeframe market structure analysis with price action and liquidity-based analysis. Main Features Market Structure Analysis Uses H1, H4, and D1 market data to assess directional bias and identify Break of Structure (BOS) and Change

Nexus Trend Pulse – Trend & Signal Indicator for MT4/5 Nexus Trend Pulse is a visual trend analysis and trading signal indicator developed for MetaTrader 4/5. It combines dynamic trend zones, directional signals, stop reference lines, and entry level visualization in one chart interface. Designed for traders who prefer a clear and organized trading environment, Nexus Trend Pulse helps identify market direction, observe price reactions, and recognize potential trading opportunities without overcr

Daily Range Ladder draws six horizontal levels across the current trading day. The distances come from how far the symbol usually travels in a day, so the levels adapt to every symbol without any setting. It works on any symbol and any chart timeframe. It reads only the daily bars your terminal already has, does not use any server, does not send anything out, and does not open or change orders. What It Shows Three resistance levels above the day's low and three support levels below the day's hig

MT4用「 MA Acceleration (移動平均線の加速度)」インジケーター(リペイントなし)。 MA Accelerationは、スキャルピング用インジケーターであり、「MA Speed(移動平均線の速度)」インジケーターの補助ツールとして設計されています。 このインジケーターの計算は物理学の数式に基づいており、移動平均線の「加速度」を表示します。 MA Accelerationを活用することで、標準的な戦略をさらに強化する多くの機会が生まれます。SMA、EMA、LWMAのいずれにも使用可能です。 MA Accelerationは、対象となる移動平均線の「2階微分(加速度)」に相当します。 このインジケーターは、MA Speedインジケーターの値がどの程度の速さで変化しているかを示します。 値が0未満の場合、弱気(ベア)方向への加速度が増加しています。値が0を超える場合、強気(ブル)方向への加速度が増加しています。 MA Speedインジケーターと組み合わせて、メインのトレンド方向に沿った高速スキャルピング戦略で使用することをお勧めします(MA Speedの値が0未満なら下降
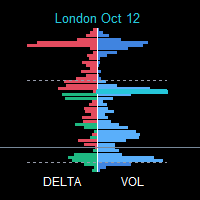
SessionFlowMap — POCレベル付きマルチセッション出来高・デルタプロファイル SessionFlowMap は、FXの取引日を構成する各セッション(アジア、ロンドン、ニューヨーク。必要に応じてシドニーと任意のカスタムセッション)について、出来高プロファイルとデルタプロファイル(買いと売りの偏り)を作成し、チャート上に表示します。各セッションで POC(Point of Control:最も多く取引された価格)と Value Area(VAH と VAL:出来高の大部分が集中した範囲)を算出し、それらのレベルを水平線として右へ延長します。各セッションで市場がどこに時間と資金を費やしたか、そしてどのレベルが再び意識されそうかが一目で分かります。 MT5-version: https://www.mql5.com/en/market/product/200942
動作の仕組み 各セッションは、それぞれの時間帯に従って M1 履歴から切り出されます。アジア、ロンドン、ニューヨーク、シドニーの時間は GMT で設定し、ブローカーのサーバー時間へ自動変換されます。カスタムセッシ

Know the direction. Know the plan. Know when to stand aside. CS Trend Pro turns a busy chart into a clear decision. It shows which way the market is moving and marks the moment that changes. With every signal it gives you a complete plan: where to enter, where the idea is wrong, and where to take profit. It is built for swing traders and scalpers who move with the swing: take a part of the profit at each target, and stay in for as long as the move lasts. Built on volatility and on support and re

Quantum Enigma Quantum Enigma is a technical analysis indicator based on market structure and price action. It is designed to identify potential Bullish and Bearish setups around established price ranges. The indicator analyses market conditions and can apply several configurable confirmation and filtering conditions before displaying a signal. This allows traders to adjust the balance between signal frequency and selectivity according to their preferred trading approach. How It Works Quantum En

AlphaTrend Pullback Pro MT4 Trend-following pullback signals, economic news filter, and professional dashboard — all in one indicator. AlphaTrend Pullback Pro transforms trend and correction analysis into clear, actionable visual signals. It identifies the macro market direction on a higher timeframe, waits for a pullback to the moving average, confirms rejection with a trend-aligned close, and triggers the entry point. No repainting on closed bars, no noise, no complexity. Why AlphaTrend Pullba

Correlation Radar PRO — Multi-Asset Correlation Dashboard for MetaTrader 4 Short Description: Eliminate market noise and spot price divergences in seconds. Correlation Radar PRO calculates historical, monthly, weekly, and real-time correlations across multiple assets and lets you overlay candles directly on your chart without switching your main symbol. Full Description: Manually switching charts to understand inter-market relationships wastes precious time and leads to missed setups. Correlatio

Mechanical Support Resistance automatically identifies potential support and resistance levels using vertical price profiles built from historical Open, High, Low, and Close (OHLC) prices. Most mechanical support and resistance indicators identify levels based on obvious price swings on the chart. Mechanical Support Resistance takes a different approach by analyzing the vertical distribution of OHLC prices to reveal support and resistance levels that are difficult to identify manually through vi

Enigma Cipher Enigma Cipher is a technical analysis indicator designed to help traders identify potential bullish and bearish market reversals through price pressure, momentum and multiple confirmation conditions. The indicator evaluates the relationship between recent price behaviour and the current signal candle. Additional filters can be enabled to refine the analysis and reduce signals that do not meet the selected conditions. How It Works Enigma Cipher first evaluates market pressure and pr

Renko Chart Pro MT4 is a practical Overlay/Panel Renko indicator designed to give traders a cleaner way to read price action without leaving the standard chart environment. Unlike many Renko tools that require separate offline charts or complicated setups, this indicator displays a fully configurable Renko panel directly inside your active MT4 chart .
You no longer need to have endless offline charts which makes shifting through instruments cleaner and more efficient. This is not an indicator I

MQLTeam Currency Power は、2つの通貨を1つのチャートに置き、どちらが強いかを示します。各通貨には通貨ペアのバスケットがあります。インジケーターウィンドウの柱は2つのバスケットの差で、表はその差を作っている通貨ペアを示します。用意された例はユーロ対ドルです。2つの名前とペアの一覧を変えても、読み方はどの2通貨でも同じです。 別の版: MetaTrader 5 向け MQLTeam Currency Power 値は pips です。初期の測り方は、速い移動平均と遅い移動平均の距離です。もっと早く見たいときは、ローソク足から直接計算する2つの方法があります。同じインジケーターが MetaTrader 4 と MetaTrader 5 で動きます。 読み方 表の各行は、列1のペアと、それに対応する列2のペアを並べます。プラスの数は、その通貨がその行で強いことを意味します。 Gap は通貨1の強さから通貨2の強さを引いた値です。差がマイナスなら通貨2が強く、プラスなら通貨1が強いです。 行はこう読みます。EUR −11、USD +17、Gap −28。ドルのほうが強く、

ValueOrbit は、現在の期間における「適正価格」の位置と、相場がそこからどれだけ離れているかを示します。コンテキスト用のツールで、中央ラインの Value Core とその周囲の3組のオービット(±1σ、±2σ、±3σ)を描画し、パネルで価格の伸び具合を表示します。エントリーシグナルは出しません。 MT5-version: https://www.mql5.com/en/market/product/201292
仕組み Value Core は、各期間(セッション・週・月)の開始から形成され、新しい期間が始まると最初からやり直す基準レベルです。オービットはこのレベルからの標準的な距離を σ 単位で示します。価格がコアに近いほど相場は均衡しており、離れるほど伸びきった状態です。期間の切り替わりでは垂直なジャンプを避けるため、ラインが途切れます。 使い方 チャートに適用し、スタイルに合わせて Value Anchor を選びます。デイトレードは Session(M1〜H1)、スイングは Week(H1〜H4)、H4〜D1 は Month が目安です。 環境認識:価格が Val

AI ZONE RADAR — サポートとレジスタンスを、ゾーンで見やすく お使いのプラットフォームに合わせて選べます こちらはMT4版です。MT5版もあります。 MT5版の商品ページはこちら MT4版・MT5版は別商品です。この購入に含まれるのは、選んだプラットフォーム用の製品です。 サインを見る前後に、価格の位置も確認したい方へ 買いサインが出ていても、すぐ上にレジスタンスがある。押し目に見えても、近くにサポートが見当たらない。こうした場面では、サインだけでなく「どこで出ているか」も確認したくなります。AI ZONE RADARは、周囲のサポート・レジスタンスと相対的な強さをひとつの画面にまとめ、判断前の確認を手助けします。 AI ZONE RADARはMT4用のチャート分析インジケーターです。パネル・状態表示・ツールチップはMarketの全11言語に対応し、言語は自動・手動で切り替えられます。 English / Russian / Chinese (Simplified) / Spanish / Portuguese / Japanese / German / Korean /

Crypto_Forex インジケーター HTF DeMarker for MT4。 - このインジケーターは、テクニカル トレーダーがエントリー ポイントとエグジット ポイントを見つけるために使用する便利なツールです。HTF は、Higher Time Frame を意味します。 - DeMarker オシレーター ラインは、以前の高値と安値に対する現在の価格位置を示します。 - DeMarker は、他のオシレーターの中で最も効率的な定期的なダイバージェンス シグナルを提供します。 - OverBought ゾーンは、DeMarker が 0.7 を超える場合、OverSold ゾーンは、0.3 を下回る場合です。 - インジケーターには、モバイルおよび PC アラートが組み込まれています。 - このインジケーターは、プライス アクション エントリーを使用するマルチタイム フレーム トレーディング システム、または他のインジケーターとの組み合わせに最適です。 - HTF DeMarker インジケーターを使用すると、Higher Time Frame の DeMarker を現在

TraderDesk is an institutional-grade financial spreadsheet and account metrics dashboard meticulously engineered for professional portfolio managers, proprietary firm traders, and systemic asset growth monitors. By integrating a state-of-the-art Time-Weighted Split-Period Capital Engine , TraderDesk transforms your chaotic chart canvas into a beautifully structured, clean financial workspace. It automatically filters out standard candlestick noise, grid line clutter, and price scale bars, allow

Crypto_Forex MT4用インジケーター「ハンギングマンパターン」。リペイント不要、遅延なし。 - インジケーター「ハンギングマンパターン」は、プライスアクショントレードにおいて非常に強力なインジケーターです。 - インジケーターはチャート上で弱気なハンギングマンパターンを検出します。チャート上に赤い矢印シグナルが表示されます(画像参照)。 - PC、モバイル、メールでアラート通知が可能です。 - インジケーター「ハンギングマンパターン」は、サポートレベル/レジスタンスレベルと組み合わせると効果的です。 Click here to see high quality Trading Robots and Indicators! これは、このMQL5ウェブサイトでのみ提供されるオリジナル製品です。

MT4 用外国為替インジケーター「INFO スプレッド スワップ ディスプレイ」、取引補助ツール。 - INFO スプレッド スワップ ディスプレイ インジケーターは、それが添付されている外国為替ペアの現在のスプレッドとスワップを表示します。 - また、口座残高、エクイティ、マージンも表示します。 - インジケーターの値はチャートのどのコーナーにも配置できます. - 色とフォント サイズも設定できます。 ............................................................................. Click here to see high quality Trading Robots and Indicators! これは、このMQL5ウェブサイトでのみ提供されるオリジナル製品です。

*Strong Hosoda Pro - Edizione COMPLETA - Premium*
Strong Hosoda Pro è un indicatore professionale di trend e livelli basato sul metodo originale Ichimoku Hosoda, sviluppato per trader esperti.
Questa è la versione Premium COMPLETA, valida per tutti i tempi, da M1 a D1. Nessuna restrizione.
*Perché Premium?* A differenza degli indicatori standard, combinazione direzione del trend, tempistica di ingresso e livello di take profit in un unico sistema chiaro, basato sulla logica completa dell'Ich

ZZ Impulse PRO is an authoring toolkit for reading market structure: two independent fractal ZigZags, Classic and Impulse/Correction modes, non-standard period candles, and full panel control — on a single chart. Concept The market speaks on both lower and higher scales at once. A typical ZigZag often keeps only one of those voices. ZZ Impulse PRO delivers controlled structure : two markups with separate settings, two ways to read waves, a flexible multiplier, and HTF/synthetic candles overlaid

GT Direction Dashboard — Comprehensive User Manual & Technical Guide 1. Executive Summary & Core Purpose The GT Direction Dashboard is a multi-timeframe, multi-metric currency alignment dashboard built for MetaTrader 4. It is designed to solve one of the greatest challenges manual currency traders face: Analysis Paralysis and Information Overload . Rather than manually switching across 6 or 8 timeframe charts ( MN1 down to M5 ) and adding 4 or 5 separate indicators (RSI, ADX, PBR, Volatility, RO

NOTE: Only 10 copies left at current price! Final price: 990$
Trade the Breakout. Catch the Move.
Take your technical analysis to the next level with TrendLine Support Resistance with Alerts , a MetaTrader 4 indicator designed for traders who focus on trendline breakouts. Identify potential trading opportunities with trendlines drawn directly on your chart and clear BUY and SELL arrows that help you spot possible breakout signals. KEY FEATURES Trendline Breakout Signals — Identify potenti

Fulcrum Value Profile は MetaTrader 4 用インジケーターです。セッションごとにティック出来高のボリュームプロファイルを作成し、POC(Point of Control)とバリューエリアを表示し、形成中の POC/VAH/VAL をラインで描画し、未接触の POC(naked POC)を追跡し、確定足で 2 つのセットアップを示します:前回バリューエリアへの回帰(80% ルール)と、その外側での受け入れ(ブレイクアウト)。注文の発注・変更・決済は一切行いません。 クイックスタート M5、M15 または M30 チャートにインジケーターを適用します。 Profile Period = Daily session のままにするか、Custom session window を選び、Custom Session Start / Custom Session End をブローカーのサーバー時間(気配値表示の時計)で設定します。 数秒で直近 5 つの完了セッションが水平ヒストグラムとして描画され、カードに ABOVE VALUE、INSIDE VALUE または

Every ICT idea in one indicator - market structure, order blocks, fair value gaps, premium / discount and OTE, liquidity sweeps, killzones and SMT - added up into one confluence score, with alerts and a multi-symbol scanner. Try it free first: press Free Demo and run it in the Strategy Tester (visual mode) - the panel, zones, signals and scanner all work there. ICT Pro Honest Stats draws all of it on your chart, checks every closed candle against nine ICT factors, shows the bullish and bearish s

Apex Patterns PRO インジケーターをご購入いただくと、それに基づいたExpert Advisorを無料でご提供します。 自己最適化するチャートパターンおよびブレイクアウト分析システム 従来のパターンスキャナーは固定のパラメータに依存しているため、市場のボラティリティや構造が変化するとパフォーマンスが低下することがよくあります。 Apex Patterns PROは、構造的なチャートパターン認識、モメンタムフィルタリング、および統計的な自己最適化を単一の分析フレームワークに統合することで、変化する市場環境に適応するように設計されています。 適応型スキャンエンジン 自己最適化パターンモード 最近の履歴データから適切なパターンパラメータを自動的に検索し、静的な設定を使用するのではなく、現在の市場の動きに合わせてインジケーターの構造検出を適応させます。 スマートブレイクアウトフィルタリング 古典的なパターン認識と、モメンタム、ボリューム、プライスアクションの指標を組み合わせます。すべてのブレイクアウトを同じように扱うのではなく、システムが根底にある市場構造を評価し、現在の統計

SMC Market Structure Toolkit は、MetaTrader 4 向けの Smart Money (ICT / SMC) ツールキットを1つのインジケーターにまとめたものです。Smart Money トレーダーと同じように相場を読み取ります。まず構造、次に流動性、そして価格が反応しうるエリア。そのすべてを、短いラベル、任意の矢印、任意のアラートとともにチャート上に直接描画します。 主な機能 構造を同時に2通りで構築 - Internal と Swing の BOS / CHoCH。それぞれ独自の時間足、スイング強度、色を持ちます。 すべてのモジュールが独自の時間足を持ちます。チャートとは独立しており、M5 で取引しながら H1 で流動性、M15 でゾーンを構築できます。 クリーンな状態で起動。初期設定では Internal 構造のみ ON です。他のモジュールはスイッチ1つで有効になります。作るのは私たちのチャートではなく、あなたのチャートです。 矢印はどこでも任意です。OFF にすると、結果(ブレイク、スイープ、テイク)はライン上のラベルに移ります。情報は失われ

Ribbon Pilot — トレードゾーン・シグナル履歴・ウォッチリスト付きトレンドリボン 用途 Ribbon Pilot は MetaTrader 4 用のチャートインジケーターです。トレンドの方向をひと目で把握でき、エントリーシグナルを矢印で表示し、エントリー、ストップ、最大4つの利益目標からなるトレードプランをすぐに描画します。直近シグナルの成績も集計し、チャートを離れずに他の銘柄を確認できます。 MT5-version: https://www.mql5.com/en/market/product/201869 仕組み 8本のなめらかなラインからなるリボンが価格に追従します。ティール(青緑)は上昇トレンド、オレンジは下降トレンドを示します。ライン間のシェーディングで方向と強さが読み取りやすくなります。金色の点線のベースラインは長期的な背景を示します(視覚的な参考用で、シグナルには使われません)。 リボンが反転すると、バーの確定後に (買い)または (売り)の矢印が表示されます。シグナルは再描画も消去もされません。 シグナルごとに、トレードゾーンがすぐに描画されます。エン

TCM ORB Indicator for MetaTrader 4 draws the opening range of the Asia, London and New York sessions and marks breakouts from each range on closed candles. What it shows - A box for each session's opening range (the first 30 minutes by default, adjustable) - Session times adjusted to your broker's clock and daylight saving automatically, or set manually - A breakout arrow when a candle closes outside the range - Optional entry, stop-loss and take-profit lines for each breakout, with an adjustabl

Crypto_Forex MT4用インジケーター「 Correction Breakout Pro pattern 」。リペイントなし、遅延なし。 - インジケーター「Correction Breakout Pro pattern」は、高い利益を期待できるプライスアクション取引に非常に効果的なインジケーターです。 - このインジケーターは、価格調整後に強気と弱気のブレイクアウトバーを検出します。 - 強気のCorrection Breakoutパターン - チャート上に青い矢印シグナルを表示します(画像参照)。 - 弱気のCorrection Breakoutパターン - チャート上に赤い矢印シグナルを表示します(画像参照)。 - PCとモバイルの両方でアラート機能を搭載。 - インジケーター「Correction Breakout Pro pattern」は、サポート/レジスタンスレベルと組み合わせると効果的です。 - 情報表示機能 - 接続されている通貨ペアの現在のスプレッドとスワップを表示します。 - 画面には、口座残高、エクイティ、マージンも表示されます。 - 情報表示はチャ

TCM SMC Indicator for MetaTrader 4 marks market structure on your chart: supply and demand zones, breaks of structure, liquidity grabs and fair value gaps. Everything is calculated from closed candles. What it shows - Fresh supply and demand zones, extended to the right until price returns to them, with the option to also show zones that have been revisited - Breaks of structure (BOS), labelled on the chart - Liquidity grabs (LQG), where price runs a recent high or low and turns back - Fair valu

BTCUSD SSL Channel Pro Multi-timeframe trend analysis and filtered BUY/SELL signals for MetaTrader 4. Overview BTCUSD SSL Channel Pro is a technical analysis indicator designed to help traders identify market direction, potential trend reversals, and filtered trading opportunities. The indicator combines an SSL channel with momentum analysis, trend-strength measurements, volatility conditions, tick-volume participation, and optional higher-timeframe confirmation. Its chart interface displays tre

TCM Trend Indicator for MetaTrader 4 highlights trend-following setups on closed candles and shows a suggested entry, stop-loss and take-profit for the latest one. What it shows - An arrow under or over the candle when a bullish or bearish trend setup appears, on closed candles only, so arrows do not repaint - Entry, stop-loss and take-profit lines for the latest setup, with the stop based on market volatility - A title and status line showing the current state Risk : reward Choose 1:1, 1:1.5, 1

Liquidity Sweep and Market Structure Indicator is a chart-based tool for MetaTrader 4 that highlights potential liquidity grabs around recent swing highs and lows. The indicator can optionally wait for a market structure break, known as a Change of Character, before displaying a directional signal. Its scoring system can include a volume filter and higher timeframe trend bias. Features Identifies potential bullish and bearish liquidity sweeps. Optional market structure confirmation. Configurabl

Crypto_Forex インジケーター「プライス アクション フィルター ヒストグラム」は、プライス アクション トレーディングのための効率的な補助トレーディング ツールです。再描画はありません。 - このインジケーターは、トレーダーにエントリーの方向を示します。トレーダーは、その方向のプライス アクション シグナルを検索するだけです。 - プライス アクション フィルター ヒストグラムは、プライス アクション パターンおよびサポート/レジスタンス レベルと組み合わせる必要があります。 - 緑色のヒストグラム - 買いエントリーを探します。 - 赤色のヒストグラム - 売りエントリーを探します。 - このインジケーターを使用すると、標準戦略をアップグレードする機会が数多くあります。 - インジケーターには、モバイルおよび PC アラートが組み込まれています。 Click here to see high quality Trading Robots and Indicators! これは、この MQL5 Web サイトでのみ提供されるオリジナル製品です。

Box Volume Profile Box Volume Profile draws a volume histogram inside any rectangle you place on the chart. Choose a time window and a price range, and the indicator shows how much volume was traded at each price level inside that zone. It also plots the Point of Control (POC) and the Value Area boundaries (VAH and VAL). How to use Press the draw hotkey (the letter V by default) and drag a rectangle anywhere on the chart. The volume profile appears immediately inside the box. Move or resize the

G2 SCANNER — 6-Setup Confluence & Trade Zone Suite by Ida Bagus Putu Mahardika Product Description G2 Scanner is a professional multi-setup indicator for MetaTrader 4/5 that combines 6 proven trading strategies into one elegant neon dashboard. Built for discretionary and systematic traders who want to see signal confluence, trade zones, and performance statistics in real time — without opening multiple charts or separate indicators. Six Core Setups VWAP Reclaim — mean-reversion entries aft
MetaTraderマーケットが取引戦略とテクニカル指標を販売するための最適な場所である理由をご存じですか?宣伝もソフトウェア保護も必要なく、支払いのトラブルもないことです。これらはすべて、MetaTraderマーケットで提供されます。

取引の機会を逃しています。
- 無料取引アプリ
- 8千を超えるシグナルをコピー
- 金融ニュースで金融マーケットを探索