Flosoft Supply Demand MT5

5

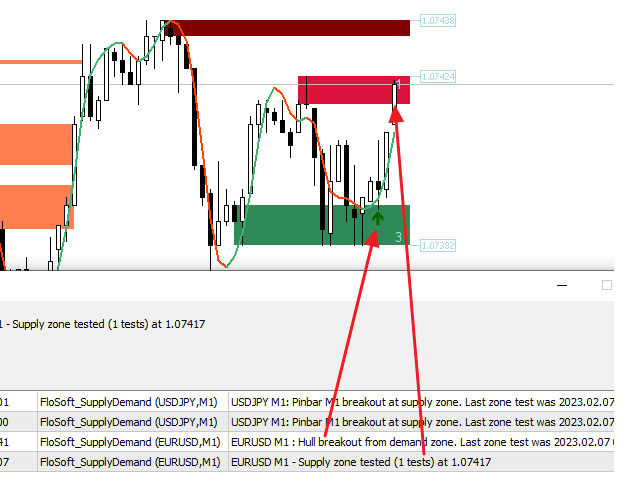
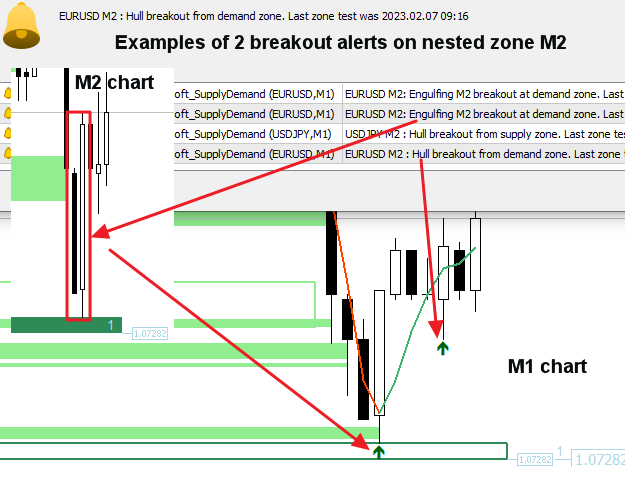
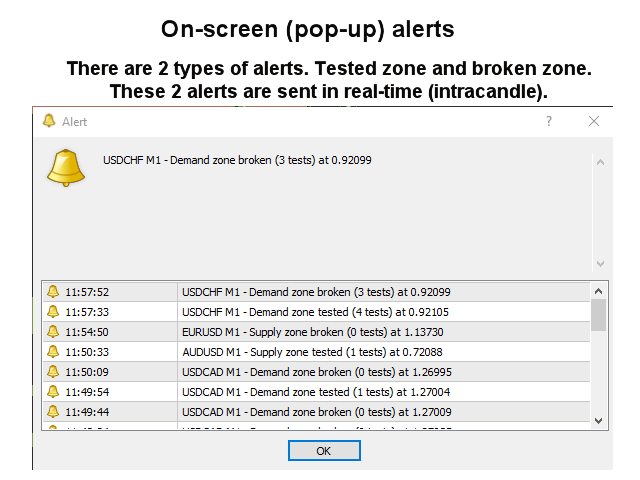
この需給ゾーンインジケーターはチャート上にゾーンを描画し、価格がゾーンに到達またはゾーンを超えたときにアラートを送信します。ゾーンの代わりに、通常のダブルトップ/ボトムについてアラートを受け取るために使用することもできます。 RSI、ADX、ボリューム、および発散フィルターを使用して、最も強力なセットアップのみをフィルターで除外することができます。独自のルールとテクニックを組み合わせることで、このインジケーターを使用して、独自の強力なシステムを作成(または強化)できます。この指標は、需要と供給にすでに精通している経験豊富なトレーダー向けであり、取引を終了または開始することを決定する際にどのように使用できるかを示しています。

特徴

  • 次の分岐がサポートされています。   MACD、OsMA、RSI、CCI、確率論的および素晴らしい。
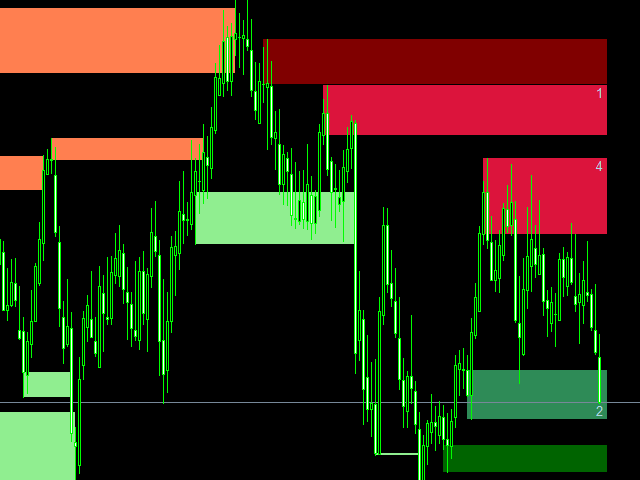
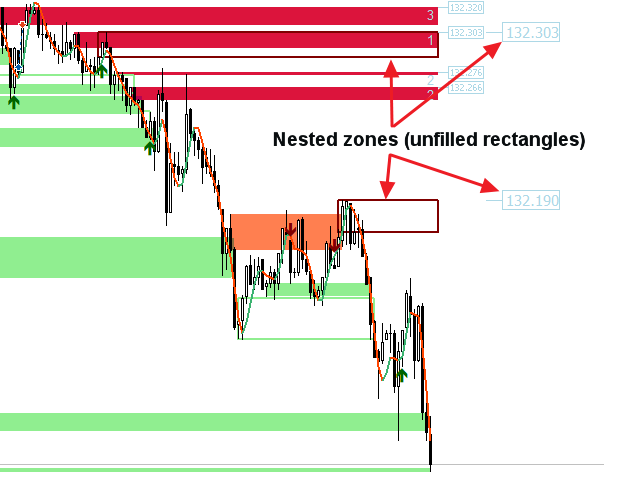
  • ゾーンには3色があります(入力で調整可能)。テストされていないゾーンの場合は暗い色、テストされたゾーンの場合は中程度、壊れたゾーンの場合は明るい色。
  • ゾーンの外側の境界線の価格とゾーンテストの量は、各ゾーンで書き込まれます。
  • インディケータは、エキスパートアドバイザーが自動取引に使用できるグローバル変数にシグナルを書き込むことができます。

入力パラメータ

ここで入力パラメータの説明と説明を見つけてください。


レビュー 4
Poller 54
524
Poller 54 2023.12.03 02:26 
 

Very useful indicator. Easy to spot supply and demand zones in the main window. Using it for scalping. Well working, even in the 1M Timeframe. Highly recommended, for that price!

Johan Julien Aubry
919
Johan Julien Aubry 2023.02.12 11:39 
 

Powerfull indicator, very cheap and with a lot of possibilities to customise settings. Can be used for entry points or to confirm other entries. Well documented and EA compatible. Jan is really helpful and very reactive. I totally recommend this product!

cubetrader33
748
cubetrader33 2022.11.08 02:28 
 

Best demand and supply indicator, recommended 100 %. For what it does the price is too low.

おすすめのプロダクト
This indicator simplifies your entry zones by displaying the areas where you can plan your entry that potentially could give you high risk/reward ratios. Other than picking the most optimal entry points, the Hot Zone indicator can act as your typical support/resistance indicator for pullbacks for all timeframes. You can use this indicator as the only trading indicator or use it with another indicator for reentry purposes.  Besides, when using Hot Zones, the risk/reward ratio should be well abov
Volume Trade Levels
Mahmoud Sabry Mohamed Youssef
The idea behind this indicator is very simple , First it contains 2 mechanisms to place your trades: 1- Enter the Pips you want to duplicate to price levels. 2- Automatically let the indicator specify the largest Buy / Sell Volume Candle and place duplicated levels based on the candle itself. How it works: 1- Enter the Pips you want to duplicate to price levels:    1- once the indicator is loaded you will need first to Specify the number of pips in the indicator Configuration window ,you can g
Supply and Demand Monster
Tsog Erdene Borjigon Enkhkhudulmur
Supply and demand zones are at the heart of   supply and demand trading . These zones are areas that show  liquidity at a specific price.  The supply zone is also called the distribution zone, while the demand zone is called the accumulation zone.   Our indicator automatically draw supply and demand zones in Metatrader 5. It give opportunity to understand trading zone and avoiding risk.
FiveStarFX Gold Reversal Edge Professional automated trading solution designed for structured execution and controlled risk management in the Gold market. Built for traders who value discipline, precision, and consistency. Key Features Fully automated trading One trade at a time (controlled exposure) Fixed Stop Loss and Take Profit Smart Break-Even protection Profit lock with buffer Step-based trailing management Spread protection system Works on any broker Trade Management The E
FREE
Historical Pivot Zones - Fibonacci Indicator MT5 Automatically draws Fibonacci retracement and projection zones based on historical price pivots. This MT5 indicator intelligently selects pivot points from different timeframes (weekly, monthly, or 6-month ranges) and creates visual Fibonacci zones around key levels. Features include: Smart Mode Selection - Auto-adjusts based on your chart timeframe Clean Visual Zones - Highlighted areas instead of just lines Essential Fib Levels - 9 retrace
Strength Radar2
Erick Guimaraes Dos Santos
Strength Radar 02 – Take Your Trading to the Next Level! Hello, trader! If you're looking for a tool to level up your game in forex, Strength Radar 02 is exactly what you need! Developed with passion and expertise, this indicator turns currency strength analysis into something simple and powerful. With it, you'll have a clear view of the real-time performance of AUD, CAD, CHF, EUR, GBP, NZD, JPY, and USD , using indicators like MA, MACD, RSI , and more — all fully customizable your way! Ima
OnlyPlusCloser — 利益のあるポジションだけをクローズ。高速かつスマートに。 スクリプトの機能: OnlyPlusCloser は MetaTrader 5 用のスマートスクリプトで、 現在のシンボルで利益の出ているポジションのみを自動でクローズ します。 手動でのフィルタリングは不要。リスクなし。ワンクリックでプラスのポジションだけを確実にクローズ。 トレーダーにとってのメリット: 完全なコントロール — 含み損ポジションには一切手を触れません 即時処理 — 利益のあるポジションは瞬時に決済 作業の自動化 — スキャルピングやデイトレードに最適 ️ 高い信頼性 — シンボル単位で正確に動作 トレードのシンプル化 — ワンクリックで利益を確定 ️ 主な特徴: 現在のシンボルで利益のあるポジションのみをクローズ 遅延なしの即時実行 軽量設計で自動売買との併用にも最適 スクリプトパネルからワンクリックで起動可能 利益を逃さず、すぐに確定したいですか? OnlyPlusCloser は、あなたのためのスマートなワンクリックアシスタン
FREE
This multi-currency annual dashboard analyzes the nearest high and low to the current price for a chosen number of recent years. It displays how many pips away the price is from the nearest high or low. You can set a pip threshold, and the alert will notify you when the price gets close to the specified levels. In real-time, the dashboard also provides an overview of the closest high or low values for each specific year, helping you make informed trading decisions.
Marca Dagua
Erison Francisco De Sales
3 (1)
Adiciona marca d'água com nome do ativo em negociação. Pode ser ajustado definindo tamanho da fonte e coloração do texto. Testado com vários ativos do mercado B3 e Forex  Adione ao gráfico e configure de acordo com a necessidade. Caso tenha problemas sinta-se a-vontade para nos avisar e providenciaremos a correção logo que possível. ______________________________
FREE
Alpha Edge Pro – The Manual Trader’s Edge - If you prefer trading manually without stress, this indicator is for you. Get your copy now. Tired of missing the big moves or holding on to losing trades too long? Alpha Edge Pro is your new secret weapon. This high-performance, plug-and-play MT5 indicator gives you crystal-clear BUY and SELL signals — so you can trade with confidence, precision, and speed. If you prefer manual trading profitably , this indicator is made for you. Alpha Edge Pro does
FREE
General Idea of the Strategy The robot is based on a simple yet highly effective principle: Identifying clear breakouts of the moving average accompanied by strong price elasticity. The goal is to detect moments when the market creates a genuine impulse , a sign that a real trend is forming, not just a random fluctuation. By focusing only on strong and confirmed breakouts, the robot filters out most of the false signals that trap manual traders. It continuously monitors candle behavior around t
Smart Drawing Assist PRO MT5. Buttons will appears next to the selected object. The buttons are straightforward and amazingly easy to use. Features are as follow: Draw zigzag . Enabling you to draw patterns, draw zigzag, and draw shapes. All you have to do is click the button and start clicking point to point and it will draw automatically. Change object color . Rectangle/Trendline/HLine/Vline/Text/Price Arrow/Arrowed Line/ and your suggestion please. Flatten trendline . make a perfect flat line
Indicator LTS for MT5 (Level + Trends + Speed) The LTS indicator was specially created for quick analysis of consolidations on the chart, which greatly facilitates decision-making when trading. LTS marks resistance and gives information about the forces affecting it, as well as the current speed and average travel. The indicator is easily customizable and can analyze any timeframe.    LTS uses a unique trend analysis algorithm based on 4 parameters from global to local.
EasyOrder Risk Manager EasyOrder Risk Manager is a professional Risk-Based Entry panel for MetaTrader 5 designed for traders who prioritize structured execution and strict risk control. This tool allows you to define your risk as a percentage of account balance and automatically calculates the correct lot size based on your Stop Loss distance. No manual calculations. No emotional lot sizing. No risk mistakes. Key Features Risk-based position sizing (% of balance) Real-time lot calcu
This EA employs a robust, data-driven approach to capitalize on the specific volatility and trend dynamics of the Euro/Yen cross. Core Strategy Features: Timeframe & Data: Optimized for the H2 (2-hour) timeframe, backtested using high-quality Dukascopy tick data with M1 precision. Intelligent Trade Management: The system utilizes advanced exit mechanisms to protect capital and lock in profits, including dynamic Trailing Stops , technical Take Profit (PT) , and strict Stop Loss (SL) risk controls
ARE Quantum Liquidity Institutional Smart Money Engine ARE Quantum Liquidity is an advanced Smart Money Concepts (SMC) indicator designed to help traders identify institutional liquidity movements and high-probability trading opportunities. The indicator analyzes market structure in real time and automatically detects important price action elements used by professional traders, including Break of Structure (BOS), Change of Character (CHoCH), Order Blocks, Fair Value Gaps (FVG), Liquidity Swe
"Hunttern harmonic pattern finder" base on the dynamic zigzag with the notification and prediction mode This version of the indicator identifies 11 harmonic patterns and predicts them in real-time before they are completely formed. It offers the ability to calculate the error rate of Zigzag patterns depending on a risk threshold. It moreover sends out a notification once the pattern is complete. The supported patterns: ABCD BAT ALT BAT BUTTERFLY GARTLEY CRAB DEEP CRAB CYPHER SHARK THREE DRIV
BTMNEXT Manager Pro – Smart Trade Manager Open trades manually, let the system handle management, protection, and optimization automatically. ️ Full mobile control (easy SL/TP management) ️ Advanced profit protection system ️ Perfect compatibility with manual trading ️ Real-time push notifications ️A VPS is required for all mobile controls BTMNEXT Manager Pro is an advanced trade management system designed to intelligently manage open positions, control risk, and optimize profits. This s
Quarterly Cycles
Barend Paul Stander
5 (1)
Quarterly Cycles Quarterly Cycles is based on the Quarterly Theory developed by Daye (  traderdaye on X ). This is an aid to the user to find Cycles and it is NOT automatic detected, user can select AMDX or XAMD  in each Cycle and it will be visually drawn on the chart.  Quarterly Cycles:   Yearly, Monthly, Weekly, Daily, 6 Hour (90 minutes) –  Yearly Cycle : The year is divided in four sections of three months each Q1 - January, February, March Q2 - April, May, June Q3 - July, August, Septemb
TimeView Pro – カスタマイズ可能なローカル時間インジケーター (MetaTrader 5) 概要 TimeView Proは、ユーザーのPCや国の時間に自動的に適応する、完全にカスタマイズ可能な時間表示インジケーターです。類似のインジケーターとは異なり、TimeView Proは高度なカスタマイズオプションを提供し、チャートの視認性を維持しながら時間管理を強化します。 主な機能 ローソク足にスナップ (デフォルトで有効) – タイムラベルが最も近いローソク足に自動的に揃います。 ワンクリックで表示/非表示 – Click Chart + H を使用して、インジケーターの表示を瞬時に切り替え可能。 カスタマイズ可能なライン – 水平線 (デフォルト: 非表示) や 垂直線 (デフォルト: 表示) のオン/オフ切り替えが可能。 柔軟なデザイン設定 – フォントサイズや背景色 などのカスタマイズが可能。 エッジオーバーラップ防止 – ラベルがチャートの端で見えなくなるのを防ぎます。 自由な位置設定 – 上部、中央、下部、またはカスタム位置 に配置可能。 追加情報表示 – サー
Unlock the power of Fibonacci with our advanced indicator! This tool precisely plots Fibonacci levels based on the previous day's high and low, identifying the next day's key support and resistance levels. Perfect for day trading and swing trading, it has consistently generated weekly profits for me. Elevate your trading strategy and seize profitable opportunities with ease. NOTE: In the Input section make sure the draw labels are set to "True" so you can see each levels.
AlphaPrime AlphaPrime is a discretionary market analysis indicator for MetaTrader 5 designed to provide multi time frame directional bias and structural context . It supports decision making by highlighting market structure, key levels, and higher time frame alignment. AlphaPrime does not execute trades and does not provide guaranteed signals. It is intended for traders who want a clear analytical framework rather than automated entries. Key Features • Multi time frame directional bias visualiz
Most SMC trades are painfully stressed because, They miss out on trades because there is a lot to mark and they keep forgetting important markings. They back-test a method correctly because back testing is done in one go, they later fail in forward test because they unconsciously change how levels were marked during testing phase. When they don't find a level, they think they are missing something and then mark a wrong level thinking its the right one. Be focused on trading, not marking, because
Ultra Charts - Advanced Custom Chart Types for MT5 Get Manual Here! Get The Free Ultra Charts Trader Here! Ultra Charts is a comprehensive charting solution that brings professional-grade alternative chart types to MetaTrader 5. This Expert Advisor provides traders with multiple custom chart formats beyond standard time-based candlesticks, enabling enhanced technical analysis and pattern recognition. Chart Types Included The product includes six distinct chart types, each designed to filter mark
FREE
Easy Indy
Vinutthapon Bumroong
This indicator automatically draws trendlines, Fibonacci levels, support and resistance zones, and identifies BOS (Break of Structure) and CHOCH (Change of Character) patterns on the chart. Just by placing it on the graph, it handles the essential technical analysis tasks for traders, providing a streamlined, effective trading tool this tools is alway make every one easy for trading.
Fully-adjustable multi-layer Fibonacci strategies to suit any risk-appetite and trading styles| Built by a grid trader >> for grid traders.  This is MT5 version, click  here  for  Blue Onyx Pi MT4  (settings and logics are same in both versions)     Real monitoring signal   -->  (Coming soon) Intro BlueOnyx Pi EA   ('Onyx') is a next-gen   multi-currency    multi-timeframe  EA base on   multi-layer / cross-timeframe Fibonacci   indicator. There are options for both grid & no-grid trading to s
ウェルカムプライス:35ドル ヘッドアンドショルダーパターン は、信頼性の高いパターン認識を求めるトレーダーに最適です。強気と弱気の両方のヘッドアンドショルダー形成を含み、フィボナッチレベル、ネックラインブレイク検出、早期予測技術が統合されています。テクニカル分析とチャート構造・トレンド反転の正確な識別を重視する方のための強力なMT5ツールです。 二重検出方法 方法1 - クラシックパターン検出 明確な構造ルールを使用して標準的なヘッドアンドショルダーパターン(通常型、逆型、非標準型)を検出します。 この方法が強調する点: 明確なネックラインブレイク 対称的なパターン形成 フィボナッチリトレースメントレベルに基づく即時反応ゾーン 方法2 - 予測的パターン検出 右肩が形成される前でも左肩と頭部を早期に識別する革新的なアプローチ。 予測三角形 を使用し、 Early_Quick_Pipsライン を描画 - より速いエントリーポイントと価格変動への準備時間を提供します。 この方法ではフィボナッチレベルが異なる方法で計算されます: 0.0%レベル は Early_Quick_Pips予測
AutoStructure — Your Key to Precise Market Entry in Forex! AutoStructure is a professional Forex indicator designed for traders who value precision, speed, and full control over the market. With just one click, you'll be able to: Automatically draw key support and resistance levels Visualize FVG zones (Fair Value Gaps) to spot profitable reversals Analyze Order Blocks across multiple timeframes Build Fibonacci levels based on real price action Perfectly suited for both scalpers and position t
+4 Years of data. This is the best scalping trend following strategy during this Trump Era.  It has a compound interest system that will make you grow your account while keeping a moderate to low risk. This is not just a BS get-rich-quick bot. This is an actual price action based EA that will perform its best for the next +2 years. Its trades are taken based off of Market Trends, TRUE SnR levels and even ICT's Fair Value Gaps. This has all of the best trading knowledge into one simple EA. If you
The default input values are already optimized for EURUSD at time frame M1, spread at 14 and hedged account mode with leverage 1:100 and initial deposit of US$ 10,000, if you don't have this balance, I suggest you to use a CENT account. Always use the strategy tester optimization to set the best values for your assets, time frame, spread and account mode. It is very important and strongly recommended for successful trading. Optimize the input values as your needs.The EA's Strategy The Strategy T
このプロダクトを購入した人は以下も購入しています
ARIPoint is a powerful trading companion designed to generate high-probability entry signals with dynamic TP/SL/DP levels based on volatility. Built-in performance tracking shows win/loss stats, PP1/PP2 hits, and success rates all updated live. Key Features: Buy/Sell signals with adaptive volatility bands Real-time TP/SL/DP levels based on ATR Built-in MA Filter with optional ATR/StdDev volatility Performance stats panel (Success, Profit/Loss, PP1/PP2) Alerts via popup, sound, push, or email Cu
SuperScalp Pro
Van Minh Nguyen
4.57 (21)
SuperScalp Pro – 高度なマルチフィルタースキャルピングインジケーターシステム SuperScalp Pro は、クラシックな Supertrend と複数のインテリジェント確認フィルターを組み合わせた高度なスキャルピングインジケーターです。M1 から H4 まで複数の時間足で効率的に動作し、XAUUSD、BTCUSD、主要 Forex 通貨ペア向けに最適化されています。 このインジケーターは明確な Buy / Sell シグナルを提供し、ATR に基づいてエントリー価格、Stop Loss、Take Profit を自動計算します。Fibonacci Take Profit 機能により、重要な価格帯で早期決済し、到達時に通知を送信します。 初期設定では Fibonacci Take Profit が有効化されており、より安定した取引体験を重視しています。チャートに適用するだけですぐ利用可能です。上級者向けに、すべてのパラメータは自由にカスタマイズできます。 EMA、RSI、ADX、Volume、VWAP、Bollinger Bands、MACD Divergence な
このインジケーターを購入された方には、以下の特典を 無料 で提供しています: 各トレードを自動で管理し、ストップロスとテイクプロフィットを設定し、戦略ルールに基づいてポジションを決済する補助ツール 「Bomber Utility」 様々な銘柄に合わせたインジケーターの設定ファイル(セットファイル) 「最小リスク」、「バランスリスク」、「待機戦略」 の3つのモードで使用できる Bomber Utility 用の設定ファイル このトレーディング戦略をすぐに導入・設定・開始できる ステップバイステップのビデオマニュアル ご注意: 上記の特典を受け取るには、MQL5のプライベートメッセージシステムを通じて販売者にご連絡ください。 オリジナルのカスタムインジケーター 「Divergence Bomber(ダイバージェンス・ボンバー)」 をご紹介します。これは、MACDのダイバージェンス(乖離)戦略に基づいた 「オールインワン」型のトレーディングシステム です。 このテクニカルインジケーターの主な目的は、価格とMACDインジケーターの間に発生するダイバージェンスを検出 し、将来の価格の動きを示す
Entry In The Zone and SMC Multi Timeframe is a real-time 2-in-1 market analysis tool that combines market structure analysis and a No Repaint BUY / SELL signal system into a single indicator, built on Smart Money Concepts (SMC) — a widely adopted framework used by professional traders to understand market structure. This indicator helps you see the market more clearly, make decisions based on structure rather than guesswork, and focus on high-probability zones where price is more likely to react
Power Candles V3 - 初の自己最適化ストレングス・インジケーター Power Candles V3 は、ストレングス分析をそのままトレード可能なシステムへと変えます。チャートを市場の強さで色分けするだけでなく、バックグラウンドでリアルタイムの自動最適化を実行し、あなたの銘柄に最適な Stop Loss、Take Profit、シグナル閾値を提示します。ワンクリックでライブトレードに適用できます。 このツールは Stein Investments エコシステムの一部です。  18 種のツール一覧、AI によるセットアップ提案、  そしてコミュニティ参加はこちら: https://stein.investments Version 3 の新機能 - AUTO-OPTIMIZER チャート読み込み時、そして各バーの確定ごとに、Power Candles V3 は該当銘柄の過去データ上で 3,000 を超えるトレードの組み合わせ をシミュレーションします: 2 つの戦略 を並列でテスト: Momentum (MOM) と Reversal (REV) 3 段階のシグナル閾値
優れたテクニカルインジケーター「Grabber」をご紹介します。これは、すぐに使える「オールインワン」トレーディング戦略として機能します。 ひとつのコードに、市場のテクニカル分析ツール、取引シグナル(矢印)、アラート機能、プッシュ通知が強力に統合されています。 このインジケーターを購入された方には、以下の特典を無料で提供します: Grabberユーティリティ:オープンポジションを自動で管理するツール ステップバイステップのビデオマニュアル:インジケーターのインストール、設定、取引方法を解説 カスタムセットファイル:インジケーターをすばやく自動設定し、最大限の成果を出すための設定ファイル 他の戦略はもう忘れてください!Grabberだけが、あなたを新たなトレードの高みへと導いてくれるのです。 Grabber戦略の主な特徴: 推奨タイムフレーム:M5〜H4 対応通貨ペア・資産:どれでも使用可能ですが、私が実際に検証した以下を推奨します(GBPUSD、GBPCAD、GBPCHF、AUDCAD、AUDUSD、AUDSGD、AUDCHF、NZDUSD、NZDCAD、EURCAD、EURUSD、E
このインジケーターを購入すると、プロ仕様のトレードマネージャーを無料で差し上げます。 まず第一に、このトレーディングシステムがノンリペイント、ノンリドロー、ノンラグのインジケーターであることを強調する価値がある。これにより、手動取引とロボット取引の両方に理想的なものになっています。 オンラインコース、マニュアル、プリセットのダウンロード。 「スマートトレンドトレーディングシステム MT5」は、新規および経験豊富なトレーダー向けにカスタマイズされた包括的なトレーディングソリューションです。10以上のプレミアムインジケーターを組み合わせ、7つ以上の堅実なトレーディング戦略を備えており、多様な市場状況に対応する多目的な選択肢となっています。 トレンドフォロー戦略:トレンドを効果的に乗り越えるための正確なエントリーとストップロス管理を提供します。 リバーサル戦略:潜在的なトレンドの反転を特定し、トレーダーがレンジ相場を活用できるようにします。 スキャルピング戦略:高速で正確なデイトレードおよび短期取引のために設計されています。 安定性:すべてのインジケーターはノンリペイント、ノンリドロー、ノ
Quantum TrendPulse を ご紹介します。これは、   SuperTrend   、   RSI   、および Stochastic のパワーを 1 つの包括的なインジケーターに組み合わせて、取引の可能性を最大限に引き出す究極の取引ツールです。精度と効率を求めるトレーダー向けに設計されたこのインジケーターは、市場のトレンド、勢いの変化、最適なエントリー ポイントとエグジット ポイントを自信を持って特定するのに役立ちます。 主な特徴: SuperTrend 統合: 現在の市場動向に簡単に追従し、収益性の波に乗ることができます。 RSI精度: 買われすぎと売られすぎのレベルを検出し、市場の反転のタイミングに最適で、SuperTrendのフィルターとして使用されます。 確率的精度: 確率的振動を活用して、変動の激しい市場で隠れたチャンスを見つけます。SuperTrend のフィルターとして使用されます。 マルチタイムフレーム分析:   M5 から H1 または H4 まで、さまざまなタイムフレームで市場を常に把握します。 カスタマイズ可能なアラート: カスタム取引条件が満たされ
Azimuth Pro
Ottaviano De Cicco
5 (7)
Azimuth Pro V2:MT5向けシンセティック・フラクタル構造分析と確認済みエントリー 概要 Azimuth Pro は Merkava Labs によるマルチレベルスイング構造インジケーターです。4つのネストされたスイングレイヤー、スイングアンカーVWAP、ABCパターン検出、3タイムフレーム構造フィルタリング、そして確定バーでの確認済みエントリー — 1つのチャートで、ミクロスイングからマクロサイクルまでを網羅するワークフロー。 これはブラインドシグナル製品ではありません。ロケーション、コンテキスト、タイミングを重視するトレーダーのための構造ファーストワークフローです。 V2発売記念オファー — Azimuth Pro V2をUSD 399で(次の100本)。最終価格:USD 499。 1. V2での変更点 シンセティック・マルチタイムフレームエンジン 上位タイムフレーム分析をMeridian Proと同じ独自のシンセティックアーキテクチャで一から再構築。よりクリーンなHTFコンテキスト、安定したライブ動作、従来のMTF同期問題なし。シンセティックエンジンは 固定比率タ
FX Trend NG:次世代マルチマーケット・トレンドインテリジェンス 概要 FX Trend NG は、複数の時間足に対応したプロフェッショナル向けトレンド分析およびマーケット監視ツールです。 市場全体の構造を数秒で把握することができます。 複数のチャートを切り替える必要はありません。どの銘柄がトレンド中なのか、どこでモメンタムが弱まっているのか、そしてどの時間足で強い整合性があるのかを瞬時に確認できます。 ローンチ特別オファー – FX Trend NG を $30(6ヶ月) または $80 永久ライセンス でご利用いただけます。 すでに Stein Investments のユーザーですか? -> メッセージを送信 して、プライベートグループへアクセスしてください。 セットアップや詳細情報が必要ですか? -> Stein Investments 公式ページ をご覧ください。 1. FX Trend NG が他と異なる理由 3ステート・トレンドロジック ― Buy と Sell だけではない • 多くのインジケーターは Buy または Sell の2状態のみを表示します。
SignalTech MT5 is a trading system for EURUSD, USDCHF, USDJPY, AUDUSD, NZDUSD, EURJPY, AUDJPY, NZDJPY, CADJPY H2 and H3 Timeframe.  It can generate signals with Buy/Sell Arrows and Pop-Up/Sound Alerts. Each signal has clear Entry and Stop Loss levels, which should be automatically flagged on the chart, as well as potential Targets 1, 2, and 3. The Entry and TP levels are fixed after the trade is taken. The exit level is dynamic. If there are signs of a potential short-term trend reversal, the
Gann Made Easy   は、ミスター・ギャンの理論を使用した取引の最良の原則に基づいた、プロフェッショナルで使いやすい外国為替取引システムです。 W・D・ガン。このインジケーターは、ストップロスとテイクプロフィットレベルを含む正確な買いと売りのシグナルを提供します。 PUSH通知を利用して外出先でも取引可能です。 ご購入後、取引方法の説明と優れた追加インジケーターを無料で入手するには、私にご連絡ください! おそらく、ギャンの取引手法についてはすでに何度も聞いたことがあるでしょう。通常、ギャンの理論は初心者のトレーダーだけでなく、すでにある程度の取引経験がある人にとっても非常に複雑なものです。なぜなら、ギャンの取引手法は理論的にはそれほど簡単に適用できるものではないからです。私はその知識を磨き、最良の原則を私の外国為替インジケーターに組み込むために数年を費やしました。 このインジケーターは非常に簡単に適用できます。必要なのは、それをチャートに添付し、簡単な取引推奨事項に従うだけです。このインジケーターは常に市場分析の仕事を行い、取引の機会を探します。適切なエントリーポイントを検
マーケットメーカーのためのツール。 Meravith は次の機能を提供します: すべての時間足を分析し、現在有効なトレンドを表示します。 強気と弱気の出来高が等しくなる流動性ゾーン(出来高均衡)を強調表示します。 異なる時間足のすべての流動性レベルをチャート上に直接表示します。 テキスト形式の市場分析を生成し、参考情報として表示します。 現在のトレンドに基づいて目標値、サポートレベル、ストップロスを計算します。 取引のリスクリワード比を算出します。 口座残高に基づいてポジションサイズを計算し、潜在的な利益を推定します。 また、市場に大きな変化があった場合には警告を表示します。 インジケーターの主要ライン: 強気/弱気の出来高エグゾーストライン ― 目標値として機能します。 市場のトレンドを示すライン。市場が強気か弱気かによって色が変わり、トレンドのサポートとして機能します。主にその色が市場センチメントを示します。 出来高均衡ライン(Eq)。Eq(Volume Equilibrium)ラインはシステムの中核です。これは買い手と売り手の出来高のバランスポイントを表します。市場の流動性を示し
まず第一に、この取引インジケーターは再描画されず、再描画されず、遅延しないことを強調する価値があります。これにより、手動取引とロボット取引の両方に理想的なものになります。 ユーザーマニュアル:設定、入力、戦略。 アトミックアナリストは、価格の強さとモメンタムを利用して市場でより良いエッジを見つけるためのPA価格アクションインジケーターです。ノイズや誤ったシグナルを除去し、取引ポテンシャルを高めるための高度なフィルターを備えています。複雑なインジケーターの複数のレイヤーを使用して、アトミックアナリストはチャートをスキャンし、複雑な数学的計算をシンプルなシグナルと色に変換します。これにより、どのような初心者トレーダーでも理解して使用し、一貫した取引の決定を行うことができます。 「アトミックアナリスト」は、新規および経験豊富なトレーダー向けにカスタマイズされた包括的な取引ソリューションです。プレミアムインジケーターとトップノッチの機能を1つの取引戦略に組み合わせ、すべてのタイプのトレーダーにとって汎用性のある選択肢にします。 デイリートレーディングとスキャルピング戦略:高速で正確なデイ
Bill Williams Advanced is designed for automatic chart analysis using Bill Williams' "Profitunity" system. The indicator analyzes four timeframes at once. Manual (Be sure to read before purchasing) Advantages 1. Analyzes the chart using Bill Williams' "Profitunity" system. Signals are displayed in a table in the corner of the screen and on the price chart. 2. Finds all known AO and AC signals, as well as zone signals. Equipped with a trend filter based on the Alligator. 3. Finds "Divergence Bar
トレンド スクリーナー インジケーターでトレンド取引の力を解き放ちます。ファジー ロジックと複数通貨システムを活用した究極のトレンド取引ソリューションです。 ファジー ロジックを活用した革新的なトレンド インジケーターである Trend Screener を使用して、トレンド取引を向上させます。 これは、13 を超えるプレミアム ツールと機能、および 3 つの取引戦略を組み合わせた強力なトレンド追跡インジケーターであり、Metatrader をトレンド アナライザーにする多用途の選択肢となります。 期間限定オファー : トレンド スクリーナー インジケーターは、わずか 100 ドルで生涯ご利用いただけます。 (元の価格 50$ ) (オファー延長) Trend Screener の 100% 非再描画精度の揺るぎない精度を体験して、取引の決定が過去の価格変動の影響を受けないようにしてください。 マルチタイムフレームおよびマルチ通貨機能の多用途性を解放し、比類のない自信を持って外国為替、商品、暗号通貨、インデックスの世界を取引できるようにします。 Trend Screener の包括的な
これはMT5のインジケーターで、再描画なしで取引に参入するための正確なシグナルを提供します。 外国為替、暗号通貨、金属、株式、インデックスなど、あらゆる金融資産に適用できます。かなり正確な見積もりを提供し、取引を開始して終了するのに最適な時期を教えてくれます。1つのシグナルを処理しただけでインジケーターの元が取れた例の 動画 (6:22)をご覧ください。Entry PointsPro インジケーターの助けを借りたほとんどのトレーダーの最初の1週間の結果が改善しています。 Telegramグループ に登録してください。Entry Points Proインジケーターのメリットは次の通りです。 再描画のないエントリーシグナル 再描画されるインジケーターでは一度表示されたシグナルが削除されて大きな金銭的損失につながることがありますが、これと異なり、表示されて確認されたシグナルは消えることがありません。 エラーなしの取引開始 インジケーターアルゴリズムによって取引を開始する(資産を売買する)理想的な瞬間を見つけることができます。それを使用するすべてのトレーダーの成功率が向上します。 あら
ご紹介     Quantum Breakout PRO は 、ブレイクアウト ゾーンの取引方法を変革する画期的な MQL5 インジケーターです。 13年以上の取引経験を持つ経験豊富なトレーダーのチームによって開発されました。     クォンタム ブレイクアウト プロ   は、革新的でダイナミックなブレイクアウト ゾーン戦略により、あなたのトレーディングの旅を新たな高みに押し上げるように設計されています。 クォンタム ブレイクアウト インジケーターは、5 つの利益ターゲット ゾーンを備えたブレイクアウト ゾーン上のシグナル矢印と、ブレイクアウト ボックスに基づいたストップロスの提案を提供します。 初心者トレーダーにもプロのトレーダーにも適しています。 量子EAチャネル:       ここをクリック 重要!購入後、インストールマニュアルを受け取るためにプライベートメッセージを送ってください。 推奨事項: 時間枠: M15 通貨ペア: GBPJPY、EURJPY、USDJPY、NZDUSD、XAUUSD アカウントの種類: ECN、Raw、またはスプレッドが非常に低い R
BTMM State Engine Pro is a MetaTrader 5 indicator for traders who use the Beat The Market Maker approach: Asian session context, kill zone timing, level progression, peak formation detection, and a multi-pair scanner from a single chart. It combines cycle state logic with a built-in scanner dashboard so you do not need the same tool on many charts at once. What it does Draws the Asian session range; session times can follow broker server offset or be set in inputs. Tracks level progression (L
OmniSync Projection
Antonio-alin Teculescu
5 (1)
Chronos Fractal Engine is an innovative price projection indicator for MetaTrader 5, designed to transform your technical analysis by intelligently identifying and projecting historical price patterns. Built upon an advanced correlation algorithm and the fractal principles of the market, this powerful tool visualizes potential future price movements, giving you a unique edge in your trading decisions. What is Chronos Fractal Engine? At its core, the Chronos Fractal Engine employs a sophisticat
FX Power: 通貨の強弱を分析して、より賢い取引を実現 概要 FX Power は主要通貨と金の実際の強弱をあらゆる市場状況で理解するための必須ツールです。強い通貨を買い、弱い通貨を売ることで、 FX Power は取引の意思決定を簡素化し、高い確率の取引機会を見出します。トレンドを追従する場合でも、極端なデルタ値を使用して反転を予測する場合でも、このツールはあなたの取引スタイルに完全に適応します。ただ取引するだけではなく、 FX Power で賢く取引をしましょう。 1. なぜ FX Power がトレーダーにとって非常に有益なのか 通貨と金のリアルタイム強弱分析 • FX Power は主要通貨と金の相対的な強弱を計算し、マーケットダイナミクスに関する明確な洞察を提供します。 • どの資産がリードしているか、または後れを取っているかを監視して、取引するペアを賢く選びましょう。 マルチタイムフレームの包括的なビュー • 短期、中期、長期のタイムフレームで通貨と金の強弱を追跡し、マーケットトレンドに基づいて取引戦略を調整できます。 • スキャルピングからスイングトレード
あなたのシンボルでどの戦略が実際に機能するか確認しましょう - リアルマネーをリスクにさらす前に。 Power Barは、あらゆるシンボルとあらゆるタイムフレームで 極端な価格バー を検出し、3つの異なるトレード戦略を即座にバックテストします。勝率、プロフィットファクター、損益を並べて比較できます。すべてが1つのインタラクティブなパネルに集約されています。 推測なし。カーブフィッティングなし。データだけです。 Power Barが特別な理由 ほとんどのインジケーターはシグナルを出すだけで、それが機能するかどうかは推測に任されます。Power Barはさらに先を行きます - すべてのシグナルを 3つの戦略 に対してテストし、統計を表示します。FlipFlop、Momentum、Reversalをワンクリックで切り替え、数値が即座に変化するのを確認できます。 FlipFlop - 常にポジションを保有。シグナルでエントリーし、反対シグナルでイグジット。当社のリサーチでは、US30、US500、DAXなどのトレンドのあるインデックスで最も効果的です。 Momentum - シグナルの方向に
Berma Bands
Muhammad Elbermawi
5 (8)
Berma Bands (BBs) インジケーターは、市場のトレンドを特定して活用したいトレーダーにとって貴重なツールです。価格と BBs の関係を分析することで、トレーダーは市場がトレンド段階にあるか、レンジ段階にあるかを判断できます。 詳細については、[ Berma Home Blog ] をご覧ください。 バーマ バンドは、上部バーマ バンド、中部バーマ バンド、下部バーマ バンドの 3 つの異なる線で構成されています。これらの線は価格の周りにプロットされ、全体的な傾向に対する価格の動きを視覚的に表します。これらのバンド間の距離から、ボラティリティや潜在的な傾向の反転についての洞察を得ることができます。 バーマ バンドの線がそれぞれ離れると、市場が横ばいまたはレンジ相場の期間に入っていることを示すことがよくあります。これは、明確な方向性の偏りがないことを示しています。トレーダーは、これらの期間中にトレンドを特定するのが難しいと感じる可能性があり、より明確なトレンドが出現するまで待つ場合があります。 バーマ バンドの線が 1 本の線に収束すると、強いトレンド環境の兆候となること
Crystal Heikin Ashi Signals - Professional Trend & Signal Detection Indicator Advanced Heikin Ashi Visualization with Intelligent Signal System for Manual & Automated Trading Final Price: $149 ---------> Price goes up $10 after every 10 sales . Limited slots available — act fast . Overview Crystal Heikin Ashi Signals is a professional-grade MetaTrader 5 indicator that combines pure Heikin Ashi candle visualization with an advanced momentum-shift detection system. Designed for both manual traders
Gartley Hunter Multi - An indicator for searching for harmonic patterns simultaneously on dozens of trading instruments and on all possible timeframes. Manual (Be sure to read before purchasing) | Version for MT4 Advantages 1. Patterns: Gartley, Butterfly, Shark, Crab. Bat, Alternate Bat, Deep Crab, Cypher 2. Simultaneous search for patterns on dozens of trading instruments and on all possible timeframes 3. Search for patterns of all possible sizes. From the smallest to the largest 4. All fou
メタポイントプロ   これは、取引における推測を排除し、市場が既に決定を下したポイントを示すトレンドフォローツールです。この指標は、トレンド、動向、構造が変化する重要なポイントを特定し、主要プレーヤーがポジションを取るべき価格の戻り領域を強調表示します。 単に値動きを見るだけでなく、その背後にある論理を理解できます。すべてのシグナルはローソク足が確定した後に記録され、再描画されることなくチャート上に保存されるため、自信を持って状況を分析し、意思決定を行うことができます。トレード目標(利益確定)も表示されます。 この指標の有効性について完全に確信を持っていただくために、自動統計機能をご利用いただけます。 方向転換のたびに、インジケーターはストップロスレベルとそのインテリジェントな段階的移動(Move SL)も表示します。これは非常に重要です。     削減する   リスク   ポジション別。 損切り/利益確定/リスクリワード 右側に内蔵されたパネルには、現在の世界的なトレンドの方向における市場参入ポイントが表示され、過去のデータからもこれらのシグナルが確認できます。 任意の時間枠/ツール
「 Dynamic Scalper System MT5 」インジケーターは、トレンド波の中でスキャルピング取引を行う手法のために設計されています。 主要通貨ペアと金でテスト済みで、他の取引商品との互換性があります。 トレンドに沿った短期的なポジションオープンのシグナルを提供し、追加の価格変動サポートも提供します。 インジケーターの原理 大きな矢印はトレンドの方向を決定します。 トレンド波の中では、小さな矢印の形でスキャルピングシグナルを生成するアルゴリズムが機能します。 赤い矢印は強気方向、青い矢印は弱気方向です。 トレンドの方向には敏感な価格変動ラインが描かれ、小さな矢印のシグナルと連動します。 シグナルは次のように機能します。適切なタイミングでラインが現れるとエントリーシグナルが形成され、ラインが開いている間はポジションが保持され、完了すると取引が終了します。 推奨される動作時間枠はM1~H4です。 矢印は現在のローソク足に形成され、次のローソク足が開いている場合は、前のローソク足の矢印は再描画されません。 入力パラメータ Trend Wave Period - トレ
Meridian Pro
Ottaviano De Cicco
5 (1)
Meridian Pro:MT5用プロフェッショナル・マルチタイムフレーム・トレンドマトリックス 概要 Meridian Pro は Merkava Labs が開発したマルチタイムフレーム・トレンドマトリックスで、方向性の状態、強度、モメンタムの状況、マトリックスの合意をひとつのコンパクトなパネルに集約します。ひとつのアダプティブエンジンがM1からW1まで一貫して適用されます。シンボルごとの調整は不要。インジケーターの積み重ねも不要。すべてのアセットとすべてのタイムフレームをカバーするひとつの構造化された読み取りです。 発売キャンペーン — Meridian Proを USD 99 (導入価格)で入手。通常価格:USD 149 。 1. Meridian Proが他と異なる理由 ひとつのエンジン、バラバラなインジケーターのダッシュボードではない 多くのMTFダッシュボードは、タイムフレームごとに生のインジケーター値を繰り返すだけです。Meridian Proはマトリックス全体でひとつのアダプティブ・トレンドエンジンを使用するため、パネルの各行が同じ構造化フレームワークから導出されます
Trend Ai indicatorは、トレンドの識別と実用的なエントリポイントと反転アラートを組み合わせることで、トレーダーの市場分析を強化する優れたツールです。 この指標は、ユーザーが自信と正確さで外国為替市場の複雑さをナビゲートすることを可能にします トレンドAiインジケーターは、主要なシグナル以外にも、プルバックやリトレースメント中に発生するセカンダリエントリポイントを識別し、トレーダーが確立されたトレンド内の価格修正を活用できるようにします。 重要な利点: *MT4およびMT5の仕事 *明確な買いまたは売りシグナル *再描画しません ·すべての資産で動作します 私はeaやセットをtelegram it詐欺で販売しないように注意してください。 すべての設定はここでブログで無料です。  重要! 指示とボーナスを得るために購入後すぐに私に連絡してください! 私の他のプロダクトと同様、実質操作の監視はここに見つけることができます: https://www.mql5.com/en/users/mechanic/seller&nbsp ; 設定および入力: すべての
Auto Optimized Parabolic RSI: 高度な3Dモメンタムエンジン ほとんどのリテール向けインジケーターは、市場のボラティリティが変化した瞬間に破綻する静的な入力値に依存しているため、失敗に終わります。Auto Optimized Parabolic RSIは、自らの数学的優位性を継続的に再計算することで「インジケーターの陳腐化」問題を解決し、機関投資家レベルの定量的適応力をMT5ターミナルに直接もたらします。 最大の強み: カスタムインメモリ3D最適化 標準的な自動最適化ツールは、インジケーターの呼び出しで端末に過負荷をかけるため、頻繁にMT5プラットフォームをフリーズさせます。本ツールは、このボトルネックを完全に回避しています。RAMベースのカスタムネイティブ計算機を内蔵した内部エンジンは、チャートを読み込んだりタイムフレームを変更したりするたびに、超高速の3Dグリッド探索を実行します。RSI期間(頻度)、SARステップ(加速度)、SAR最大値(制限速度)を同時にスイープし、プラットフォームを遅延させることなく、数万通りものパラメーターの組み合わせを絶対的なミ
作者のその他のプロダクト
The indicator identifies when a divergence occurs between price and an indicator or oscillator. It identifies both regular and hidden divergences. Combined with your own rules and techniques, this indicator will allow you to create (or enhance) your own powerful system. For higher probability setups I can recommend you to use my Supply Demand indicator and trade only if the divergence occurs inside a zone. Supply zone for bearish div and demand zone for bullish div. The optimal scenario is if it
FREE
このインジケーターは、チャート上に需要と供給のゾーンを描画します。独自のルールやテクニックと組み合わせることで、このインジケーターを使用して独自の強力なシステムを作成 (または強化) できます。さらに多くの機能を提供する 有料版 もぜひご確認ください。私の推奨は、少なくとも 25 バー後に最初のゾーン テストが発生する取引機会を探すことです。 特徴 ゾーンには 3 つの色があります (入力によって調整可能)。テストされていないゾーンは暗い色、テスト済みのゾーンは中くらいの色 、壊れたゾーンは明るい色です 。 各ゾーンにはゾーン外枠の価格とゾーンテストの金額が記載されています。 入力パラメータ 最初の極値を検索するための最大バックバー数 -     デフォルトは 3000 です。最初の極値を xx バー分遡って検索します。値が大きいほど、より多くのシステム リソースが必要になります 。遅いコンピューターの場合は、500 ~ 1000 の値が適している場合があります。 ゾーンテスト間のキャンドルの最小数 未テストの需要色 テスト済みの需要色 壊れた需要の色 未テスト供給色 テスト済みの供給
FREE
I recommend you to read the   product's blog  (manual) from start to end so that it is clear from the beginning what the indicactor offers. This multi time frame and multi symbol divergence dashboard indicator sends an alert when one or two different divergences have been identified. It can be used with all time frames from M1 to MN. Maximum 9 time frames can be shown in the dashboard at the same time. It is possible to enable moving average, RSI or Bollinger bands trend filter to filter out on
I recommend you to read the   product's blog  (manual) from start to end so that it is clear from the beginning what the indicactor offers. This multi time frame and multi symbol indicator identifies double or triple top/bottom formations or a following neckline breakout (confirmed top/bottom). It offers RSI, pin bar, engulfing, tweezer, morning/evening star filters as well divergence filter options which makes it possible to filter out only the strongest setups. The indicator can also be used
このマルチタイムフレームとマルチシンボルインジケーターは、次の5つのクロスを識別できます。 動きの速い平均が動きの遅い平均線と交差するとき。 価格が単一の移動平均に達したとき(上/下で閉じているか、ちょうど跳ね返った)。 三重移動平均フォーメーションが出現したとき(3つのMAすべてが連続して整列) MACDメインラインがシグナルラインと交差するとき。 信号線がMACDzero(0)線と交差するとき。 このインジケーターを独自のルールや手法と組み合わせると、独自の強力なシステムを作成(または強化)できます。 特徴 マーケットウォッチウィンドウに表示されている選択したシンボルを同時に監視できます。インジケーターを1つのチャートに適用し、市場全体を即座に監視します。 M1からMNまでのすべての時間枠を監視でき、クロスオーバーが識別されたときにリアルタイムのアラートを送信します。すべてのアラートタイプがサポートされています。 追加のトレンドフィルターとしてRSIを使用できます。 インジケータには、インタラクティブパネルが含まれています。アイテムをクリックすると、問題のシンボルと時間枠で新しいチ
This multi time frame and multi symbol indicator scans for pin bars. Combined with your own rules and techniques, this indicator will allow you to create (or enhance) your own powerful system. Features Can monitor all symbols visible in your Market Watch window at the same time. Apply the indicator to just one chart and instantly monitor the entire market. Can monitors every time frame, from M1 to MN, and sends you a real-time alert when a pin bar is identified. All Metatrader native alert types
This indicator recognizes a special type of Inside Bar formation which is formed by a big Master candle followed by 4 smaller candles (please see the strategy explanation below). Features Plots buy/sell stop lines on the chart as well as well as take profit and stop loss levels. The TP/SL levels are based on the Average True Range (ATR) indicator. Object colors are changeable. Sends you a real-time alert when a Master candle formation is identified - sound / popup / email / push notification. On
このインジケーターは、チャート上に需要と供給のゾーンを描画します。独自のルールやテクニックと組み合わせることで、このインジケーターを使用して独自の強力なシステムを作成 (または強化) できます。さらに多くの機能を提供する 有料版 もぜひご確認ください。私の推奨は、少なくとも 25 バー後に最初のゾーン テストが発生する取引機会を探すことです。 特徴 ゾーンには 3 つの色があります (入力によって調整可能)。テストされていないゾーンは暗い色、テスト済みのゾーンは中くらいの色 、壊れたゾーンは明るい色です 。 各ゾーンにはゾーン外枠の価格とゾーンテストの金額が記載されています。 入力パラメータ 最初の極値を検索するための最大バックバー数 -     デフォルトは 3000 です。最初の極値を xx バー分遡って検索します。値が大きいほど、より多くのシステム リソースが必要になります 。遅いコンピューターの場合は、500 ~ 1000 の値が適している場合があります。 ゾーンテスト間のキャンドルの最小数 未テストの需要色 テスト済みの需要色 壊れた需要の色 未テスト供給色 テスト済みの供給
FREE
This indicator can send alerts when a Heiken Ashi Smoothed color change occurs. Combined with your own rules and techniques, this indicator will allow you to create (or enhance) your own powerful system. Features Can send all types of alerts. Option to delay the alert one or more bars in order to confirm the color (trend) change. Input parameters Candle shift for alert: Default is 1. Setting it to 0 will alert you on color change on the current candle. This should be regarded as a pending (uncon
FREE
Features This is an indicator that recognizes a special type of Inside Bar formation which is formed by a Master candle followed by 4 smaller candles (please see the strategy explanation below). Plots buy/sell stop lines on the chart as well as well as take profit and stop loss levels. The TP/SL levels are based on the Average True Range (ATR) indicator. Object colors are changeable. Sends you a real-time alert when a Master candle formation is identified - sound / pop-up / email / push notifica
I recommend you to read the  product's blog  (manual) from start to end so that it is clear from the beginning what the indicator offers. This multi time frame and multi symbol supply and demand zone dashboard indicator sends alerts when the price has reached a supply/demand zone. It is also possible to use it to be alerted about regular double tops/bottoms instead of zones. It can be used with all time frames from M1 to MN. Maximum 9 time frames can be shown in the dashboard at the same time. 
The indicator identifies when a divergence occurs between price and an indicator or oscillator. It identifies bullish and bearish hidden or regular (classical) divergences. Combined with your own rules and techniques, this indicator will allow you to create (or enhance) your own powerful system. For higher probability setups I can recommend you to use my  Supply Demand indicator  and trade only if the divergence occurs inside a zone. Supply zone for bearish div and demand zone for bullish div. T
FREE
インディケータは、価格とオシレーター/インディケーターの間に発散が発生したときを識別します。これは、通常の分岐と隠れた分岐の両方を識別します。最強のセットアップのみをフィルターで除外できるRSIフィルターオプションがあります。インディケータは、巻き込みフォーメーション、ドンチアンチャネルブレイクアウト、または移動平均を超える価格を待つオプションも提供します (スクリーンショット#3を参照)     貿易機会を知らせる前に発散を確認する。独自のルールとテクニックを組み合わせることで、このインジケーターを使用して、独自の強力なシステムを作成(または強化)できます。 特徴 の終わりに     製品のブログ   インジケーターからトレードシグナルを取得するためにiCustom()関数を使用しているサンプルエキスパートアドバイザー(EA)のソースコードをダウンロードすることができます。 EAは完全に機能しますが、主な目的は、コードを使用して、独自に開発したEAに貼り付けることです。 限られた時間で   ただし、プログラミングサポートを提供することはできません。 謝罪いたします 次のオシレーター
This indicator can send alerts when a Heiken Ashi Smoothed color change occurs. Combined with your own rules and techniques, this indicator will allow you to create (or enhance) your own powerful system. Features Can send all types of alerts. Option to delay the alert one bar in order to confirm the color (trend) change. Input parameters Wait for candle close: 'true' or 'false'. Setting it to 'true' will delay the alert to the opening of the bar following the bar where the color change occurred.
FREE
このマルチタイムフレームとマルチシンボルインジケーターは、ピンバー、朝/夕方の星、巻き込み、ピンセット、スリーラインストライク、インサイドバー、ペナントとトライアングルをスキャンします。 インジケーターはシングルチャートモードでも使用できます。このオプションの詳細については、製品の     ブログ 。     独自のルールとテクニックを組み合わせることで、このインジケーターを使用して、独自の強力なシステムを作成(または強化)できます。 特徴 マーケットウォッチウィンドウに表示されているすべてのシンボルを同時に監視できます。インジケーターを1つのチャートに適用し、市場全体を即座に監視します。 M1からMNまでのすべての時間枠を監視し、パターンが識別されるとリアルタイムのアラート(ポップアップ、プッシュ、またはメール)を送信します。 RSIとボリンジャーバンドをピンバー、朝/夕方の星 、巻き込み、ピンセットの形成の フィルターとして使用して、潜在的な逆転を適切に特定できます。 主要なトレンドフィルターとして移動平均を使用し、ボラティリティフィルターとしてADXを使用できます。 インジケータ
I recommend you to read the   product's blog  (manual) from start to end so that   it is clear from the beginning what the indicator offers. This multi oscillator, multi time frame and multi symbol indicator identifies when a divergence occurs between price and an oscillator/indicator. It identifies both regular/classical (trend reversal) and hidden (trend continuation) divergences. It has moving average, RSI/Bollinger, ADX, pin bar and engulfing filter options which makes it possible to filter
ぜひ読んでみてください     製品のブログ (マニュアル)を最初から最後まで読んで、インジケーターが提供するものが最初から明確になるようにします。 このマルチタイムフレームおよびマルチシンボルインジケーターは、ピンバーをスキャンします。独自のルールとテクニックと組み合わせることで、このインジケーターを使用して独自の強力なシステムを作成 (または強化) できます。 特徴 マーケットウォッチウィンドウに表示されるすべてのシンボルを同時に監視できます。インジケーターを 1 つのチャートに適用するだけで、市場全体を即座に監視できます。 M1 から MN までのすべての時間枠を監視し、ピンバーが識別されるとリアルタイムのアラートを送信します。すべての Metatrader ネイティブ アラート タイプがサポートされています。 潜在的な反転を適切に識別するために、RSI をトレンド フィルターとして使用できます。 インジケーターにはインタラクティブ パネルが含まれています。別のスクリーンショットを参照してください。 買い/売りラインと TP/SL ライン (ATR 乗数に基づく) を表示するよ
I  recommend you to read the   product's blog  (manual) from start to end so that it is clear from the beginning what the indicator offers. This multi time frame and multi symbol indicator scans for engulfing and tweezer formations. The indicator can also be used in single chart mode. Combined with your own rules and techniques, this indicator will allow you to create (or enhance) your own powerful system. Features Can monitor all symbols visible in your Market Watch window at the same time. Ap
This multi time frame and multi symbol indicator identifies high-probability breakout patterns. It does this by identifying strong, symmetrical pennants and triangles. This pattern DOES NOT appear very often on higher time frames. But when it does, it is a very high-probability setup. The indicator also includes an Inside bars scanner. It can for example be used to detect a special type of Inside bars formation which is formed by a Master candle (MC) followed by 4 inside candles (please see the
このマルチタイムフレームとマルチシンボルインジケーターは、ピンバー、朝/夕方の星、巻き込み、ピンセット、3つのラインストライク、内側のバー、ペナントと三角形をスキャンします。インジケーターはシングルチャートモードでも使用できます。このオプションの詳細については、製品の     ブログ 。独自のルールとテクニックを組み合わせることで、このインジケーターを使用して、独自の強力なシステムを作成(または強化)できます。 特徴 マーケットウォッチウィンドウに表示されているすべてのシンボルを同時に監視できます。インジケーターを1つのチャートに適用し、市場全体を即座に監視します。 M1からMNまでのすべての時間枠を監視し、パターンが識別されるとリアルタイムのアラート(ポップアップ、プッシュ、またはメール)を送信します。 潜在的な逆転を適切に特定するために、ピンバー、朝/夕方の星、巻き込み、ピンセットの形成のフィルターとしてRSIとボリンジャーバンドを使用できます。 主要なトレンドフィルターとして移動平均を使用し 、ボラティリティフィルターとしてADXを使用できます。 インジケーターにはインタラクティ
このマルチシンボルおよびマルチタイムフレームインジケーターは、次のローソク足パターンをスキャンします(パターンの説明についてはスクリーンショットを参照してください)。 3人の白人兵士(逆転>継続パターン) 3つの黒いカラス(反転>継続パターン) 強気と弱気のスリーラインストライク(反転パターン) インジケーター設定の厳密なオプションが有効になっている場合、パターンはより高い時間枠ではあまり頻繁に表示されません。しかし、そうする場合、それは非常に確率の高い設定です。 Thomas Bulkowski(国際的に有名な作家であり、ローソク足パターンの第一人者)によると、3ラインストライクはローソク足パターンの中で最高の全体的なパフォーマンスランクを持っています。このインジケーターを独自のルールや手法と組み合わせると、独自の強力なシステムを作成(または強化)できます。 特徴 マーケットウォッチウィンドウに表示されているすべてのシンボルを同時に監視できます。インジケーターを1つのチャートに適用し、市場全体を即座に監視します。 M1からMNまでのすべての時間枠を監視でき、パターンが識別されたときに
I recommend you to read the   product's blog  (manual) from start to end so that it is clear from the beginning what the indicactor offers. This multi time frame and multi symbol indicator can identify the following 5 crosses: when a fast moving average crosses a slow moving average line. when price has reached a single moving average (closed above/below or just bounced). when a triple moving average formation has appeared (all 3 MA:s in consecutive alignment). when the MACD main line crosses t
I recommend you to read the   product's blog  (manual) from start to end so that it is clear from the beginning what the indicactor offers. This multi time frame and multi symbol indicator identifies double or triple top/bottom formations or a following neckline breakout (confirmed top/bottom). It offers filters for RSI overbought/oversold, candle patterns (pin bar, engulfing, tweezer, morning/evening star, three line strike) and divergences (MACD, OsMA, Awesome (AO), RSI, CCI, Stochastic) whic
This multi indicator/oscillator (hereafter indicator), multi time frame and multi symbol indicator identifies when a divergence occurs between price and one, two or three indicators. It identifies both regular/classical (trend reversal) and hidden (trend continuation) divergences. It has RSI and MA trend filter options which makes it possible to filter out only the strongest setups. Combined with your own rules and techniques, this indicator will allow you to create (or enhance) your own powerfu
This multi time frame and multi symbol indicator identifies when the stochastics signal line (D) crosses the stochastics main line (K) as well as options  to scan for main line and signal line level crossovers.  As a bonus it can also scan for Bollinger bands and RSI overbought/oversold crosses. Combined with your own rules and techniques, this indicator will allow you to create (or enhance) your own powerful system. Features Can monitor all symbols visible in your Market Watch window at the sam
This cost averaging Expert advisor (EA) places additional trades in the same direction as the original (manually opened) order when the price goes against you. It can be used as a grid system or as pure martingale system (exponential increasing of lot size) or smoothed martingale (for instance linear increasing of the lot size). Due to the risk involved, this EA is more suitable for intermediate to advanced traders who are well aware of how to handle risk management and trading an already profit
このマルチタイムフレームとマルチシンボルトレンドインジケーターは、強いトレンドまたはトレンド反転が識別されたときにアラートを送信します。移動平均(シングルまたはダブル(MAクロスオーバー))、RSI、ボリンジャーバンド、ADX、コンポジットインデックス、パラボリックSAR、素晴らしい(AO)、MACD(シグナルライン)、     ストキャスティクスのクロスオーバーまたは船体の移動平均 。 M5からMNまでのすべての時間枠で使用できます。ダッシュボードの色は、強気の場合は緑、弱気の場合は赤、ニュートラルの場合は青です(指標値が範囲外です)。 このインジケーターを独自のルールや手法と組み合わせると、独自の強力なシステムを作成(または強化)できます。 特徴 インディケータは、エキスパートアドバイザーが自動取引に使用できるグローバル変数にシグナルを書き込むことができます。たとえば、   この製品 。 使用する時間枠を選択することができます。 ダッシュボード内でトレンド強度ランクソートを継続的に実行します。ただし、特定のシンボルを見つけやすくするために、この並べ替えを無効にすることは可能です。
I recommend you to read the   product's blog  (manual) from start to end so that it is clear from the beginning what the indicactor offers. This multi time frame and multi symbol divergence dashboard indicator sends an alert when one or two different divergences have been identified. It can be used with all time frames from M1 to MN. It is possible to enable moving average or RSI trend filter to filter out only the strongest setups. It should be combined with your own confirmation rules, techni
I recommend you to read the   product's blog  (manual) from start to end so that it is clear from the beginning what the indicactor offers. This multi time frame and multi symbol indicator sends an alert when one or more trend reversal candle patterns have been identified on several time frames. It can be used with all time frames from M5 to MN. It is possible to enable moving average or RSI trend filter to filter out only the strongest setups. Combined with your own rules and techniques, this
フィルタ:
ZERO9898.Tom KC Wang
2190
ZERO9898.Tom KC Wang 2024.01.25 12:24 
 

ユーザーは評価に対して何もコメントを残しませんでした

Poller 54
524
Poller 54 2023.12.03 02:26 
 

Very useful indicator. Easy to spot supply and demand zones in the main window. Using it for scalping. Well working, even in the 1M Timeframe. Highly recommended, for that price!

Johan Julien Aubry
919
Johan Julien Aubry 2023.02.12 11:39 
 

Powerfull indicator, very cheap and with a lot of possibilities to customise settings. Can be used for entry points or to confirm other entries. Well documented and EA compatible. Jan is really helpful and very reactive. I totally recommend this product!

cubetrader33
748
cubetrader33 2022.11.08 02:28 
 

Best demand and supply indicator, recommended 100 %. For what it does the price is too low.

レビューに返信