Basic Harmonic Pattern MT5
- インディケータ
- バージョン: 6.5
- アップデート済み: 4 7月 2025

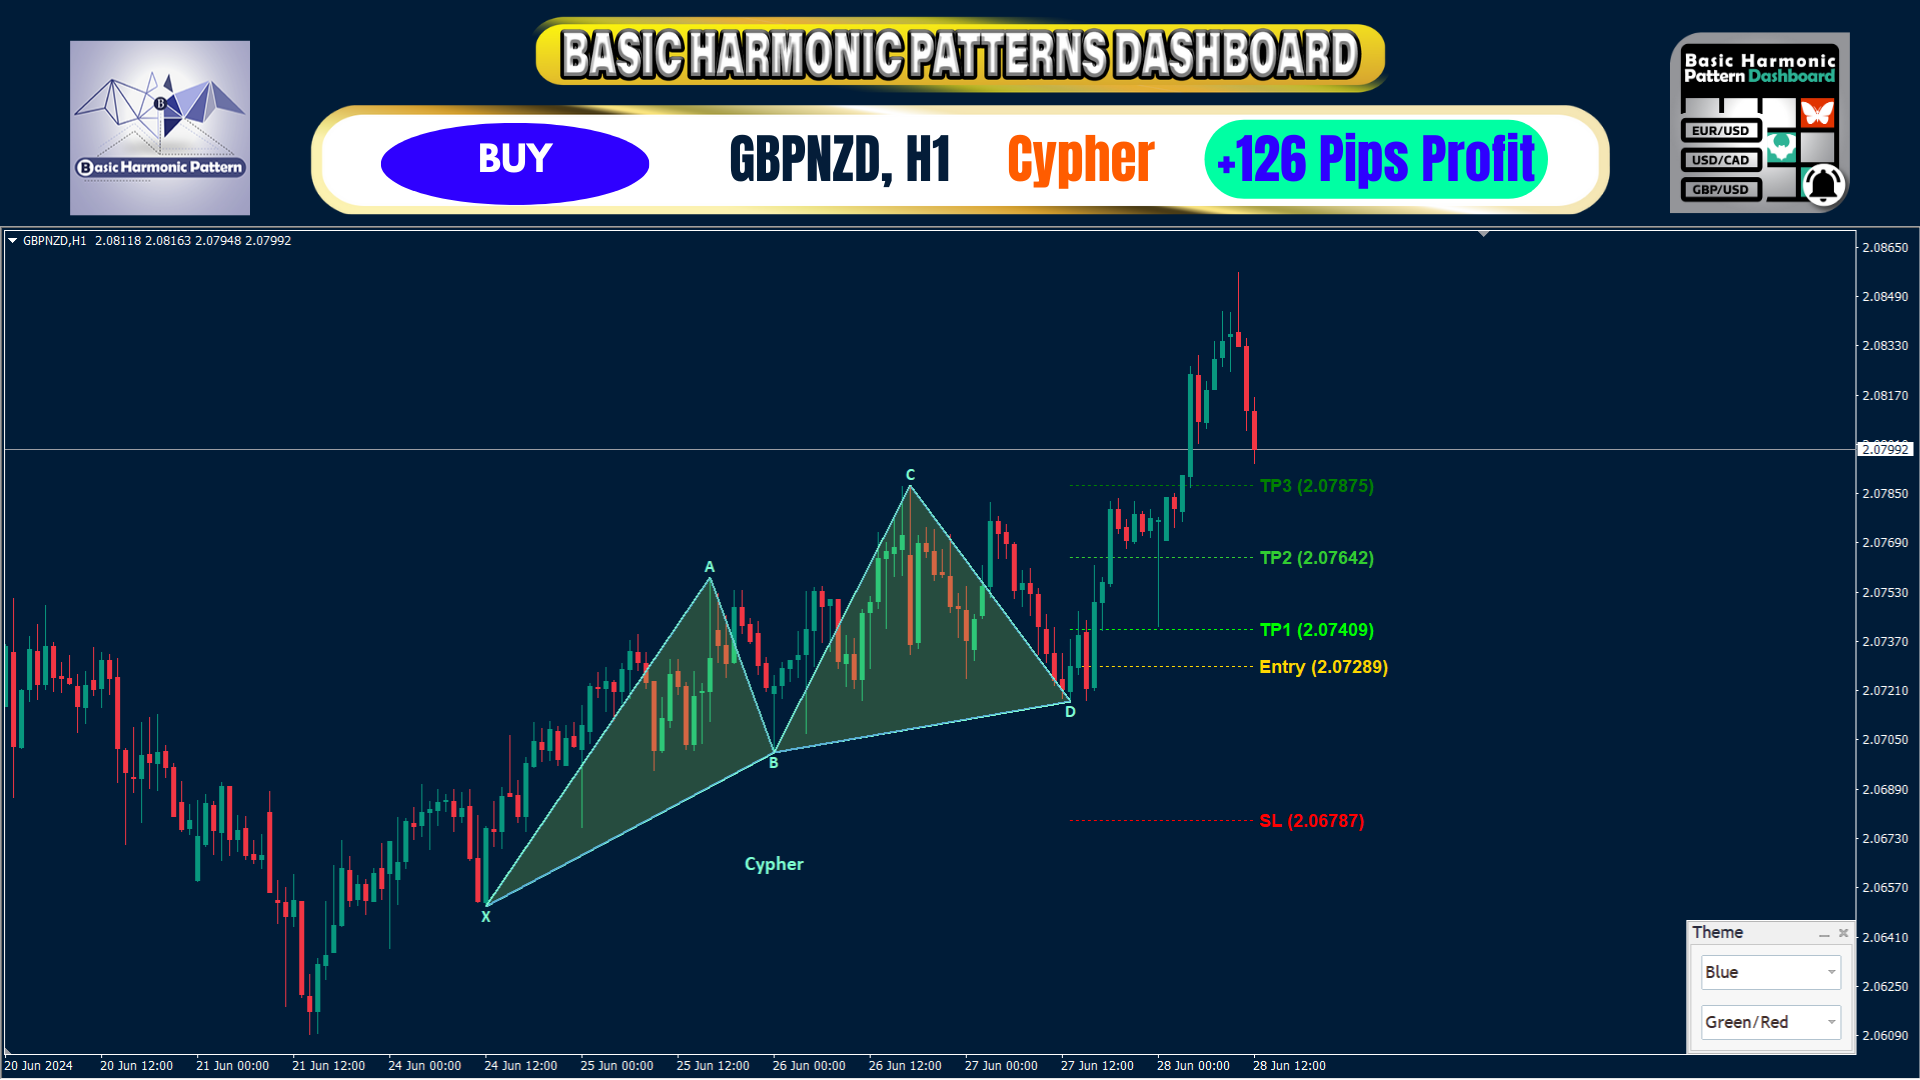
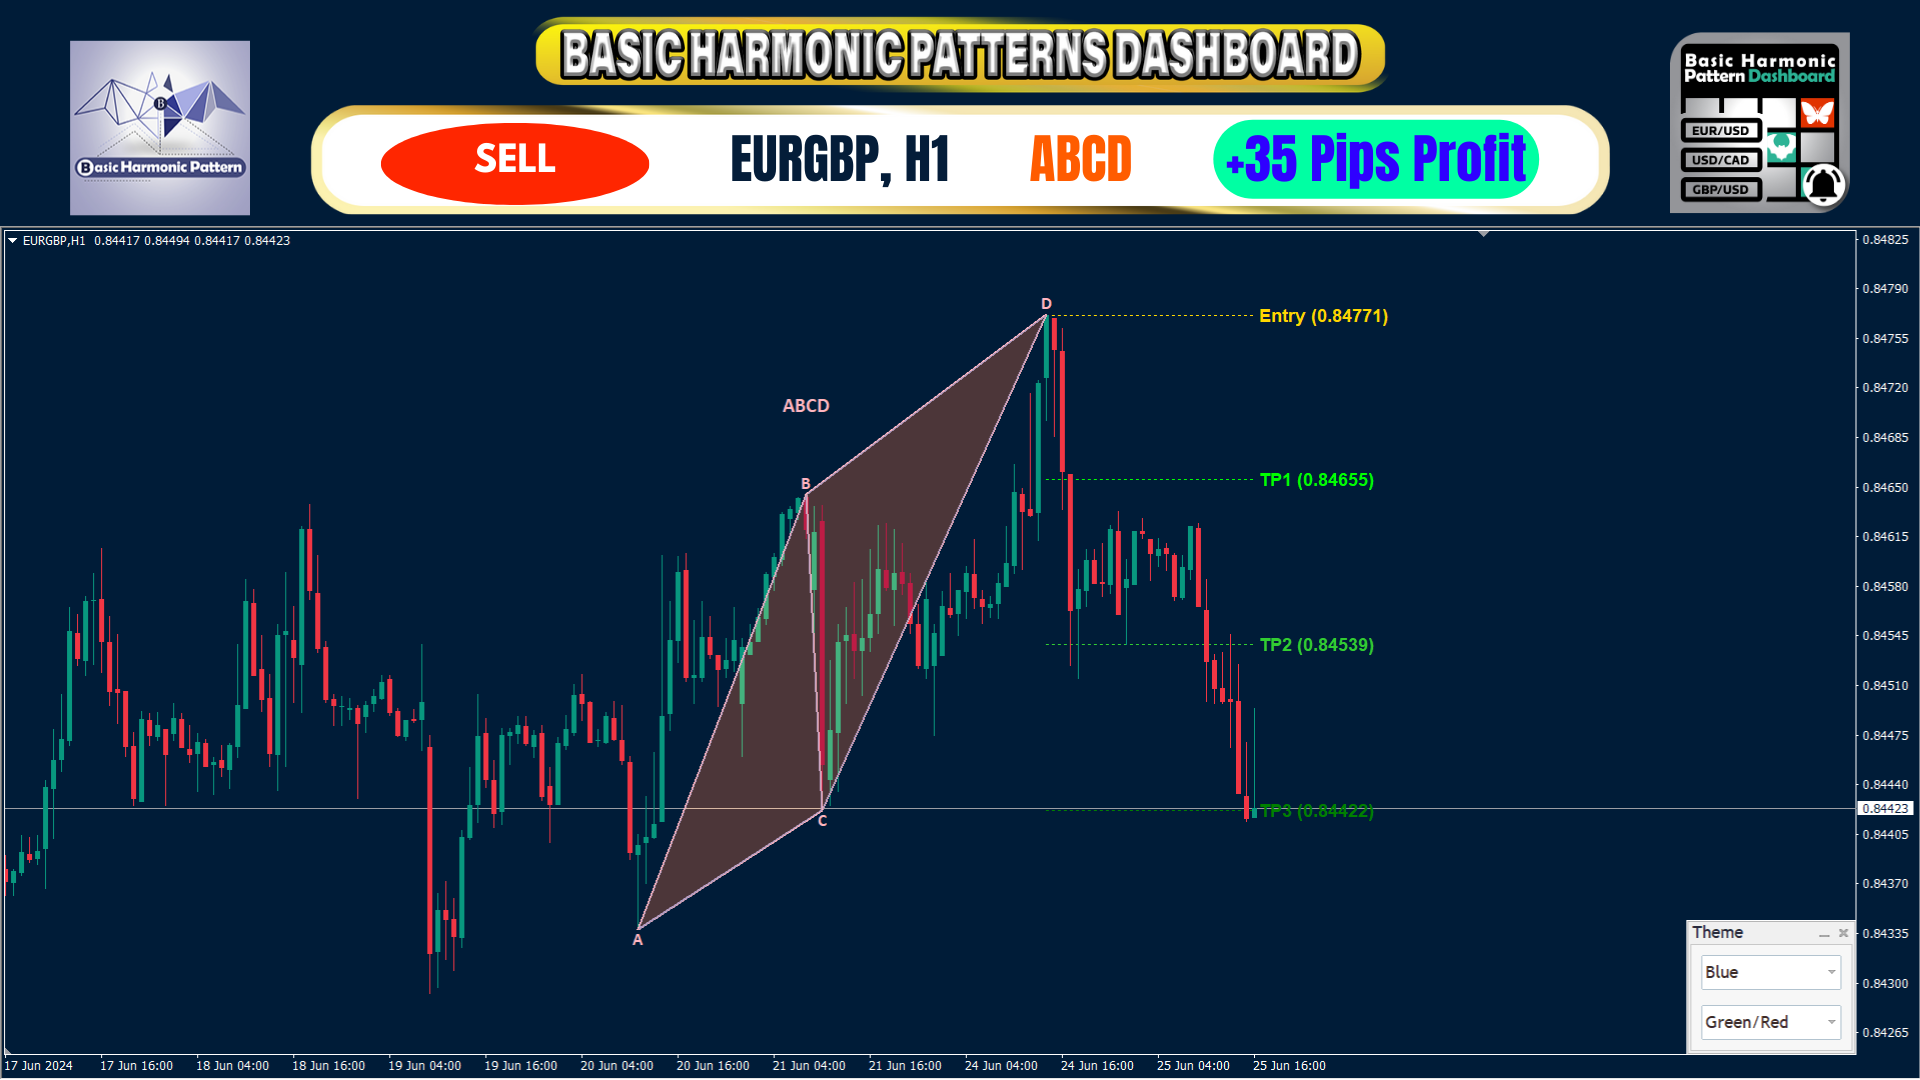
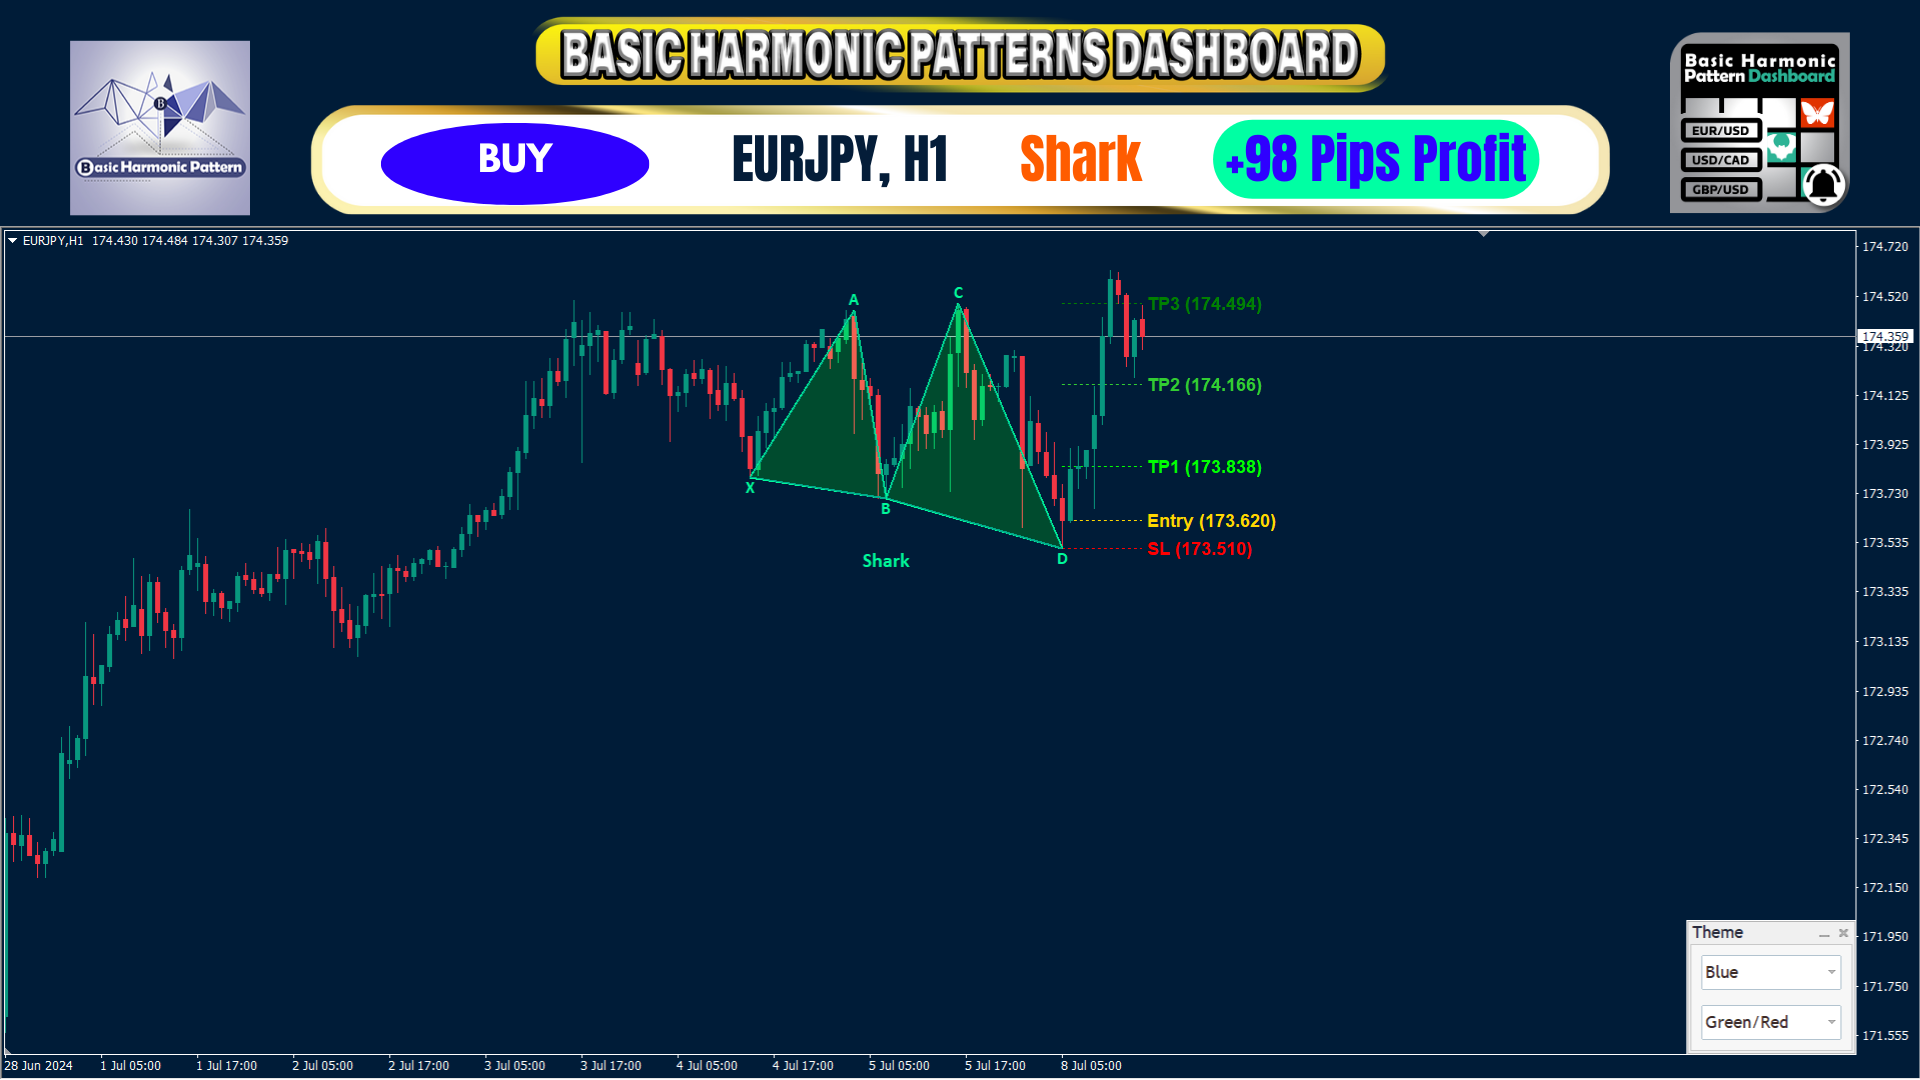
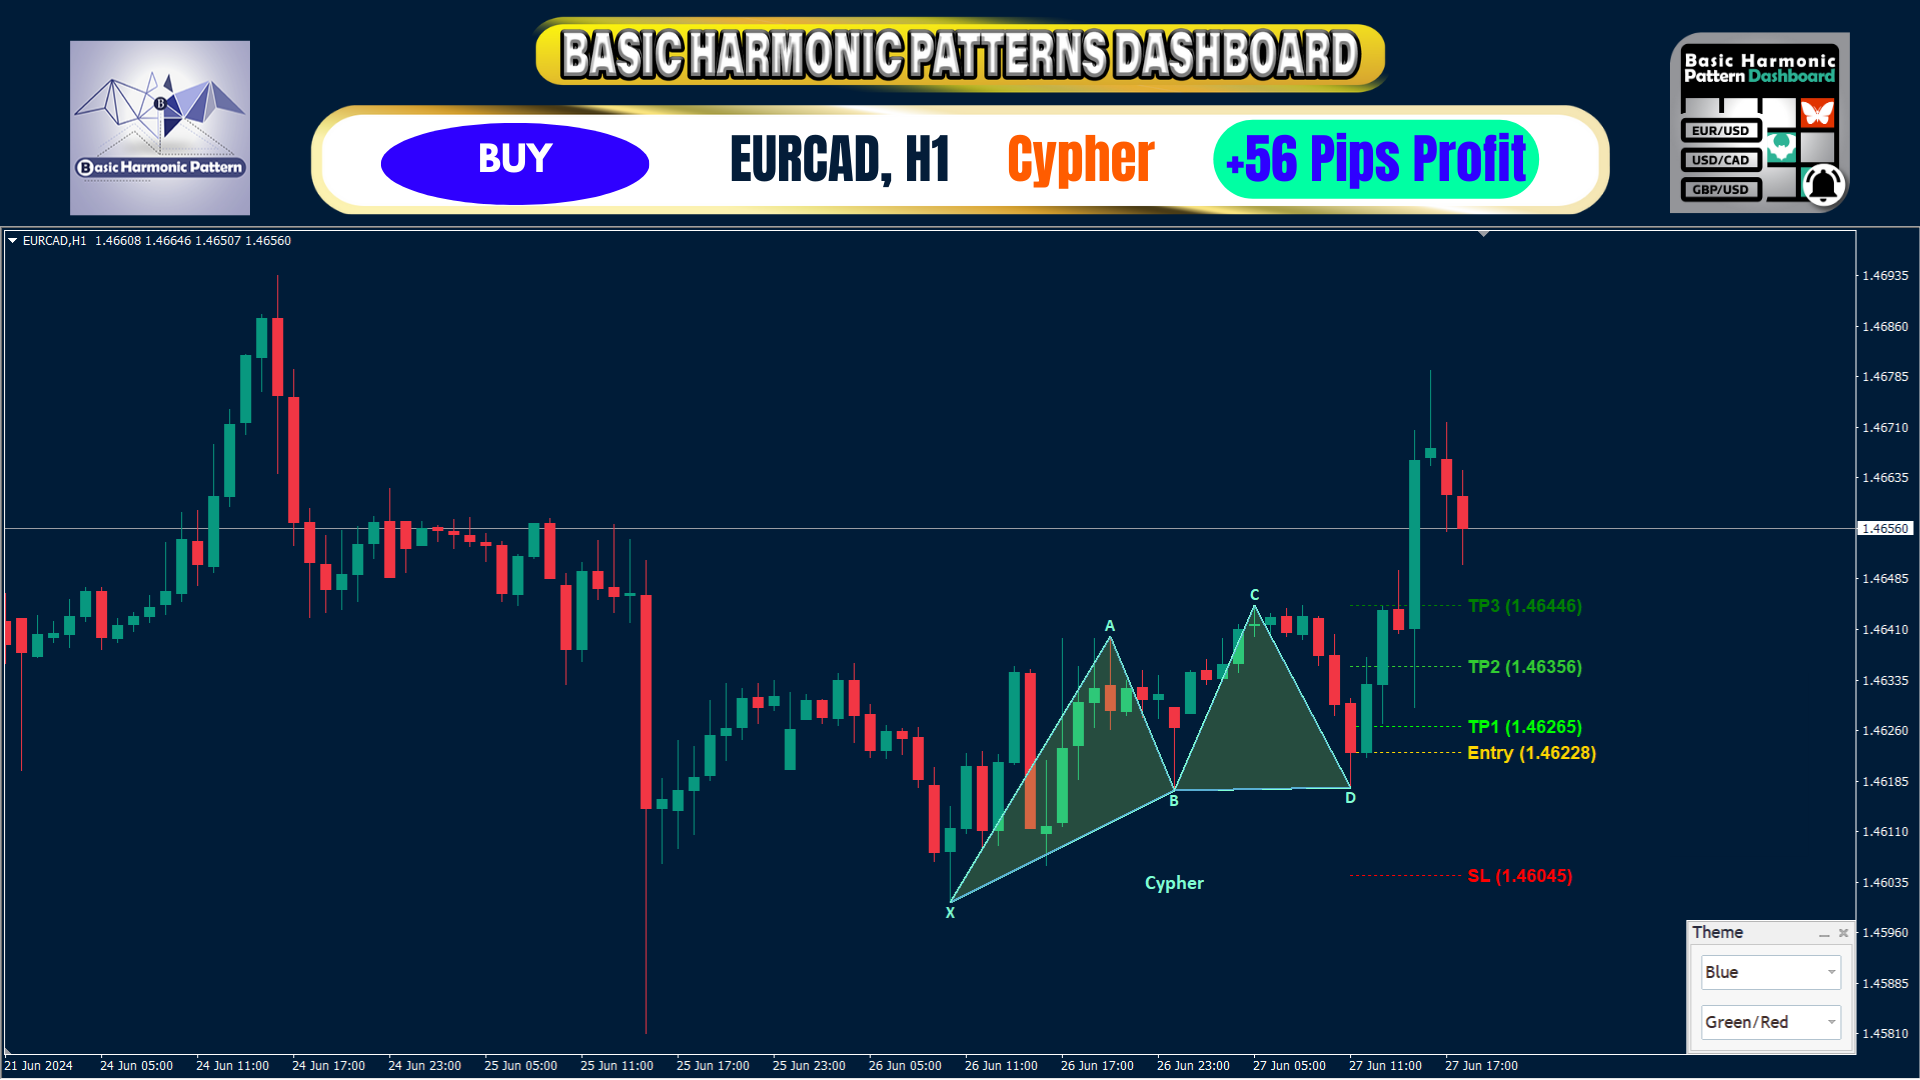
このインディケータは、相場の反転ポイントを予測する最もポピュラーなハーモニックパターンを識別します。これらのハーモニックパターンは、外国為替市場で常に繰り返され ている価格形成であり、将来起こりうる値動きを示唆します。/ MT4無料バージョン
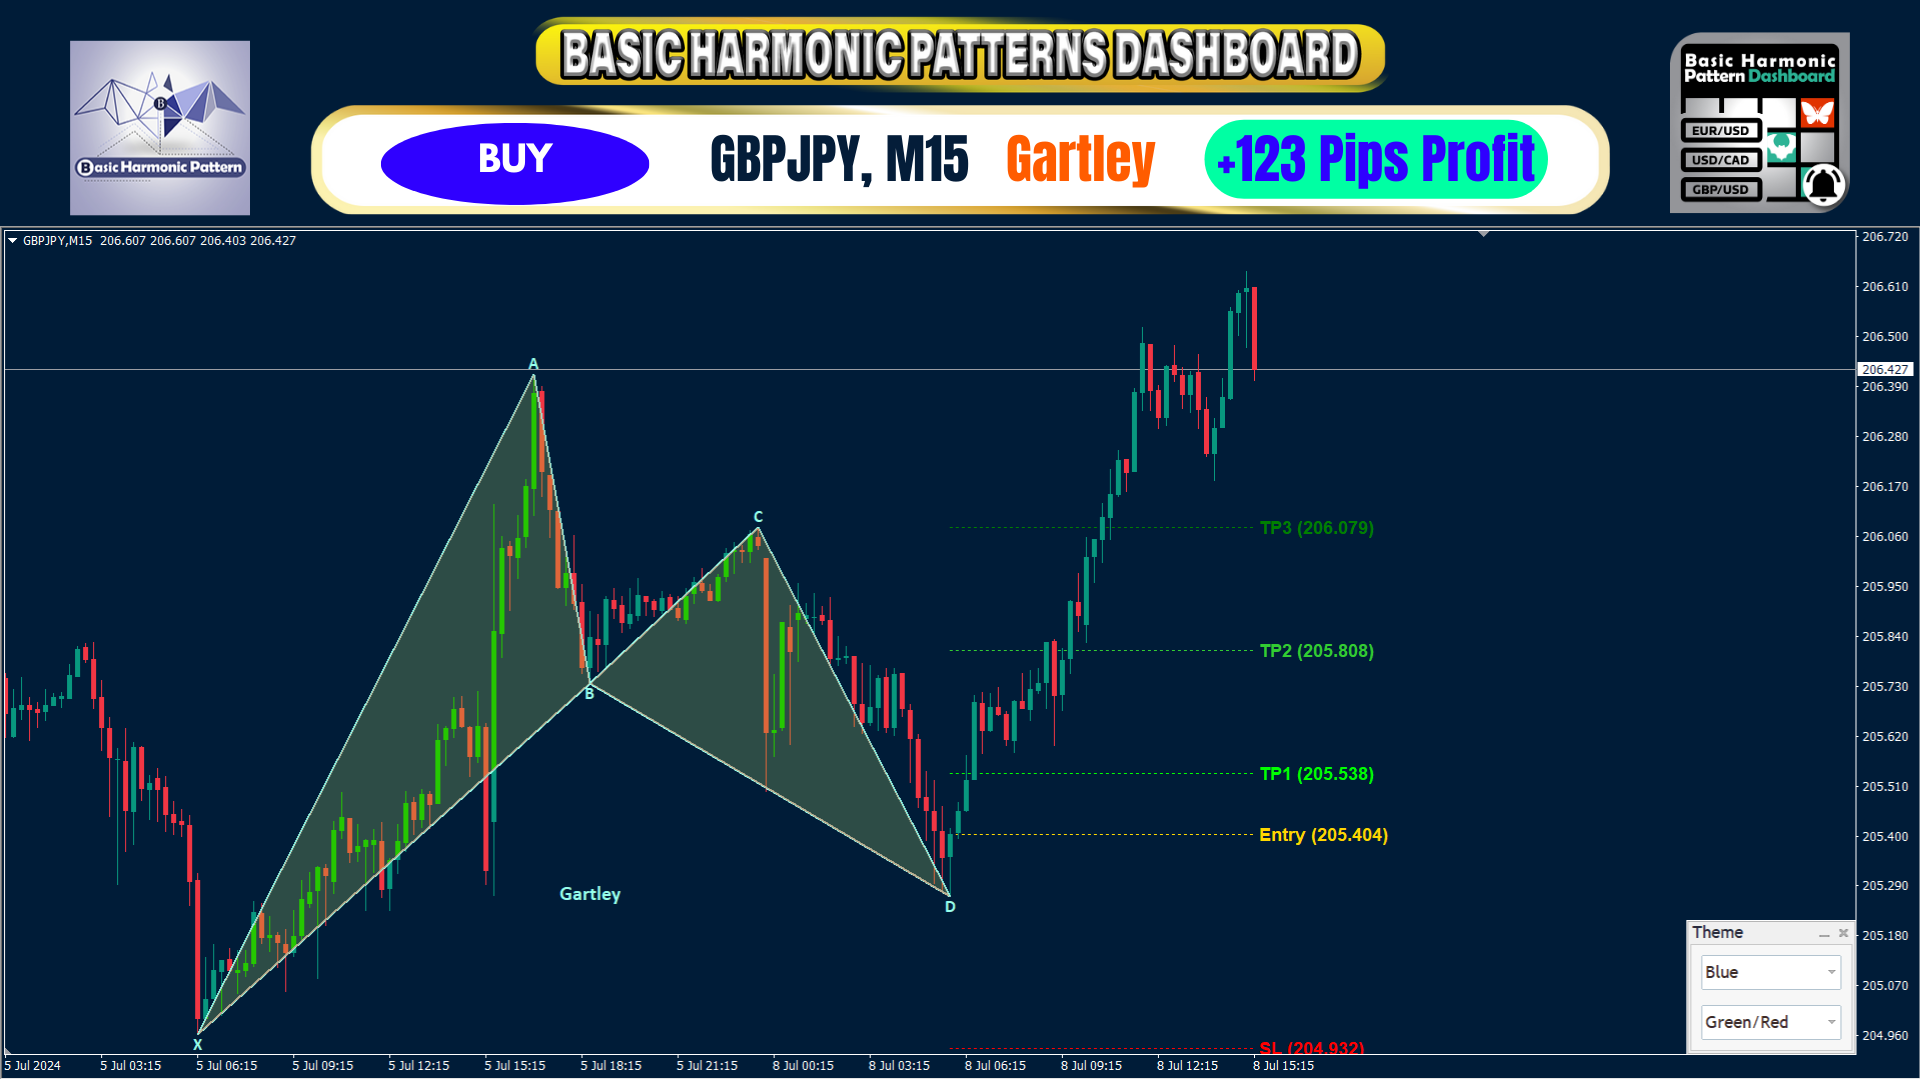
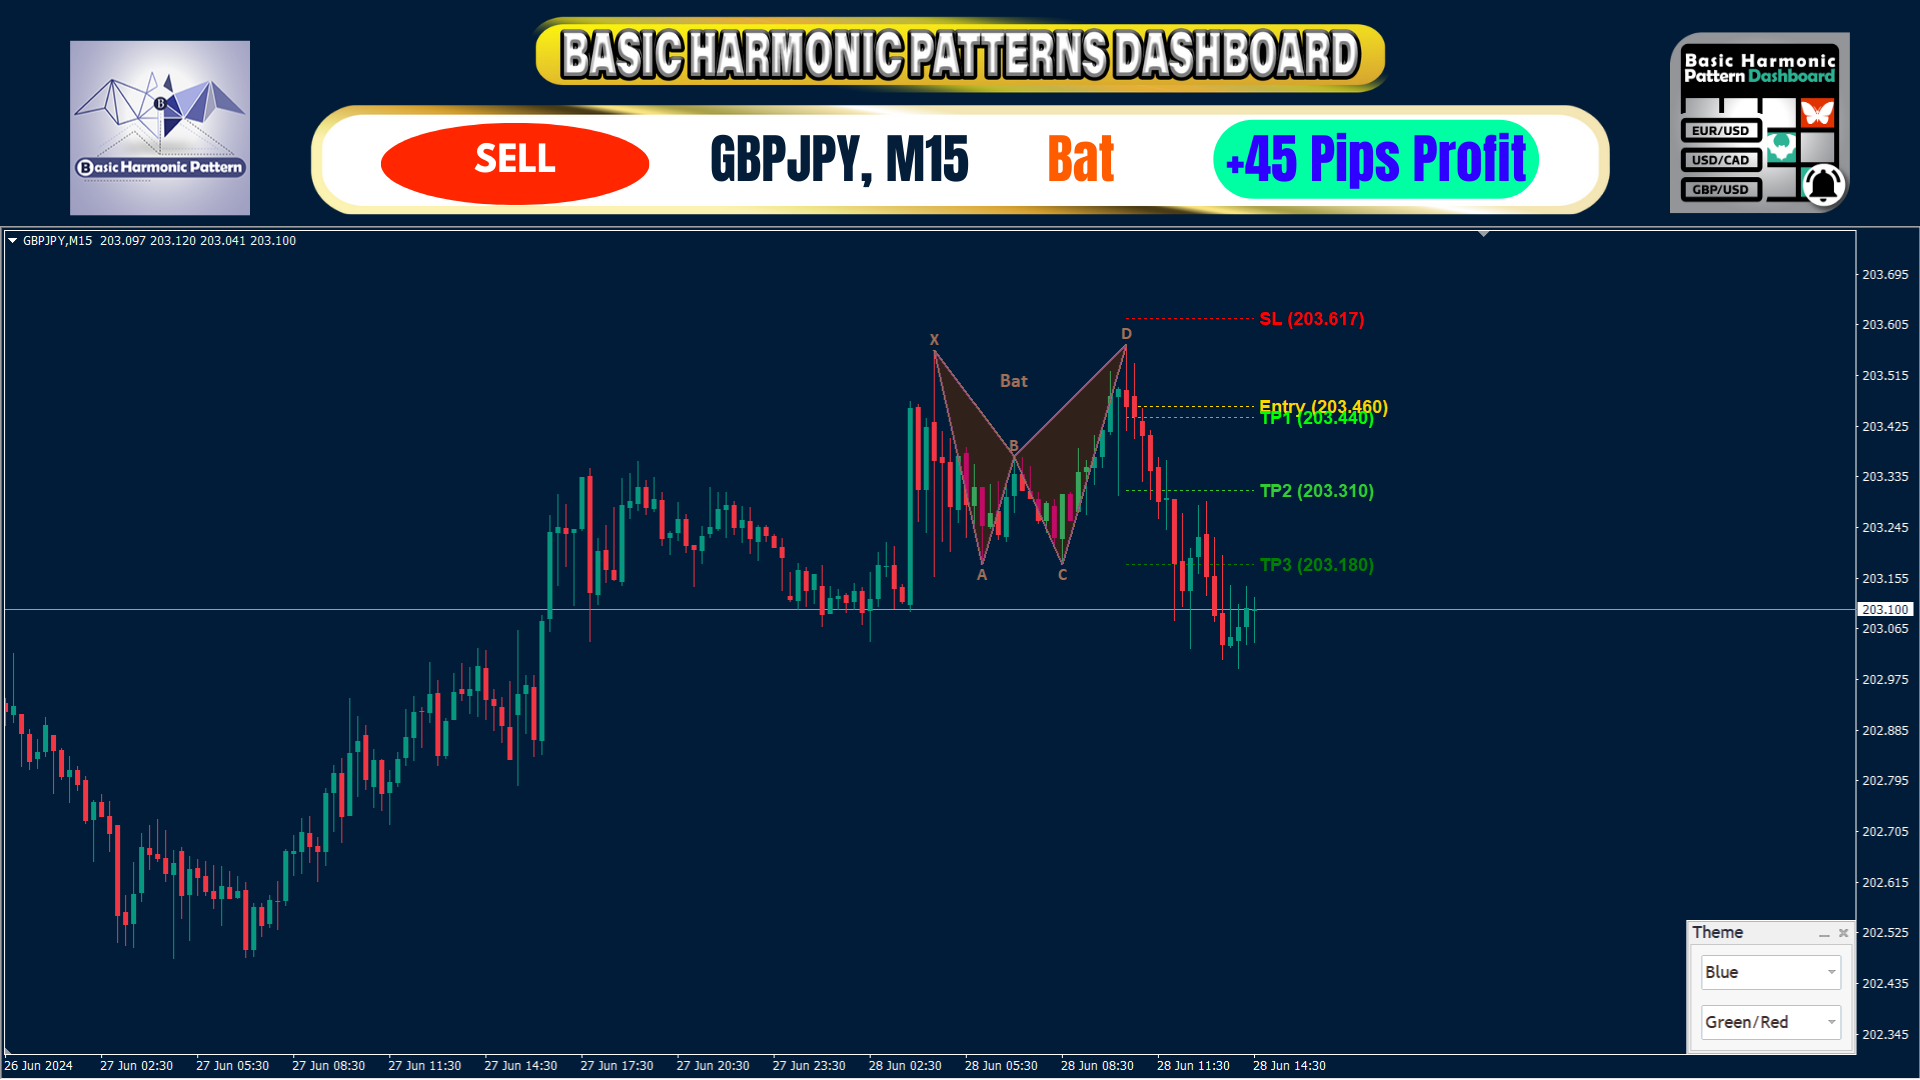
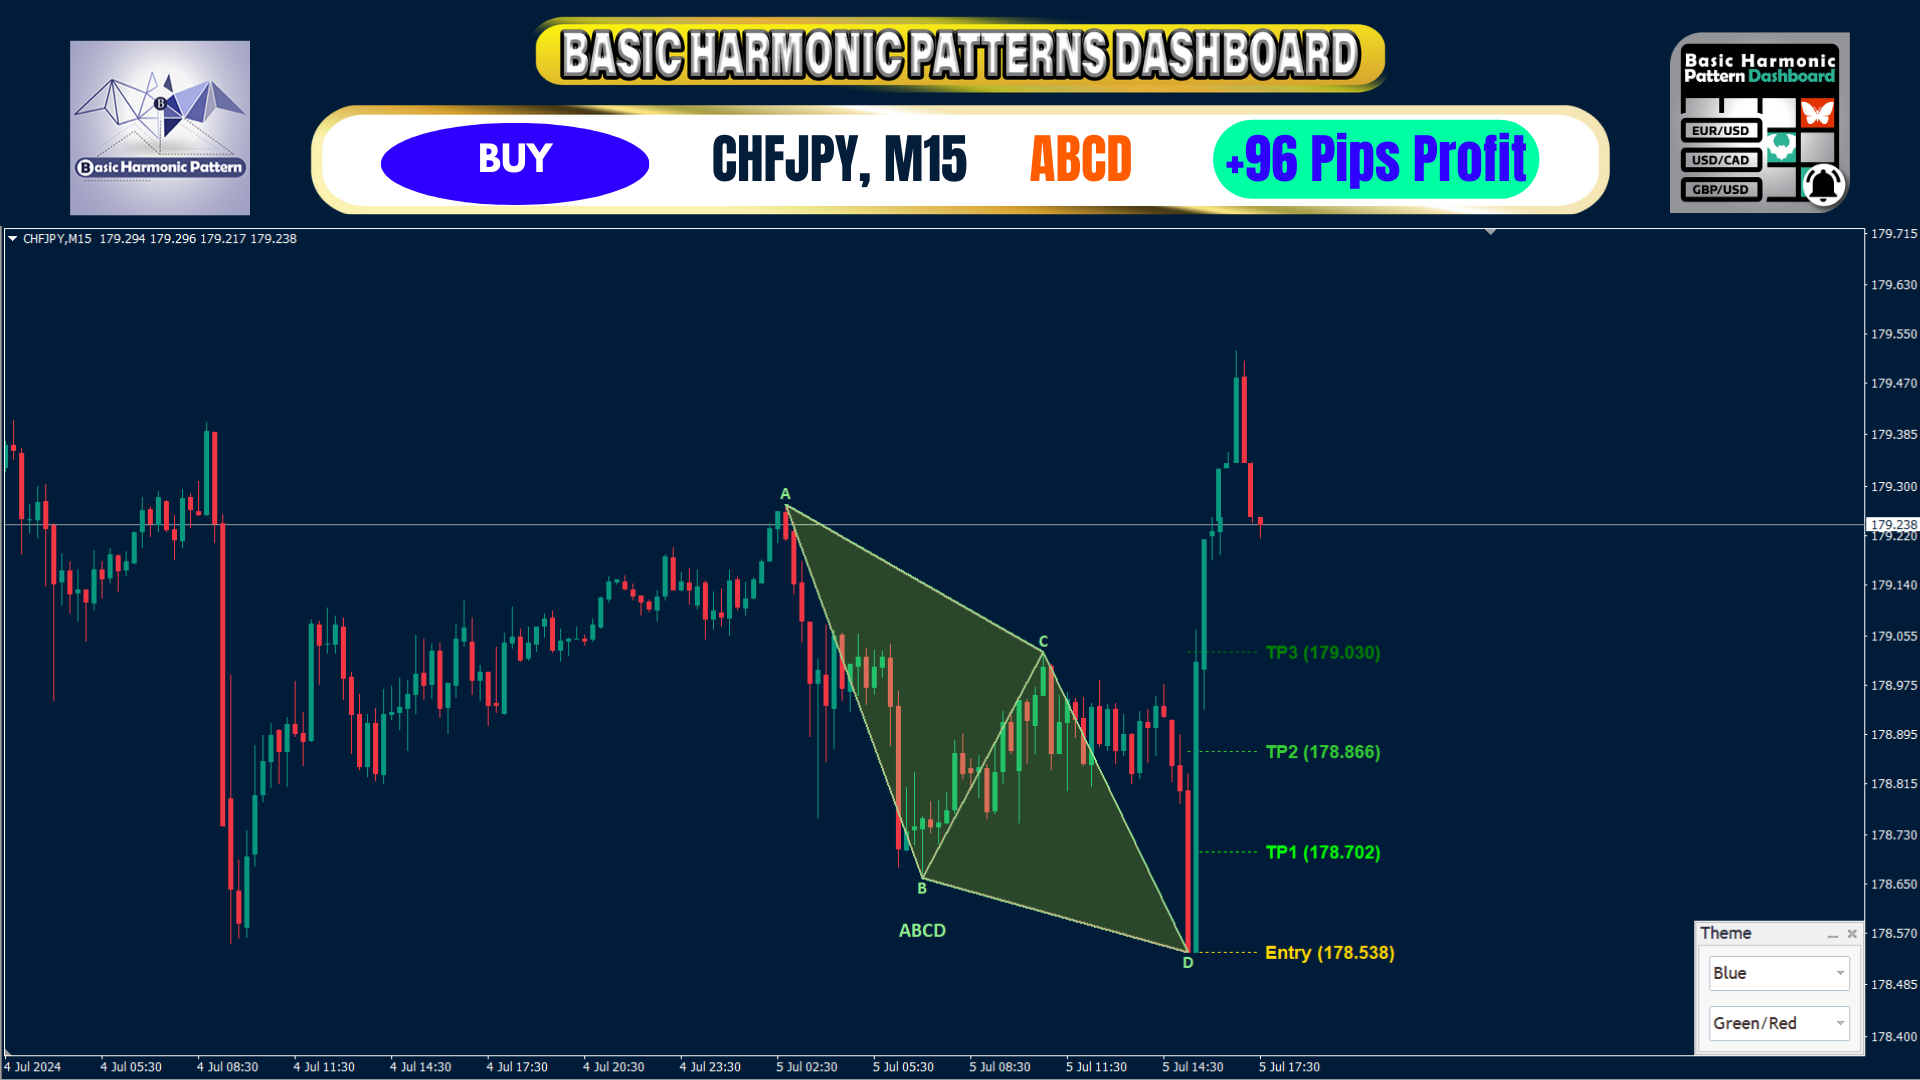
さらに、このインジケーターには、市場エントリーシグナルと、様々な利食いと損切りが組み込まれています。ハーモニック・パターン・インディケータは、それ自体で売買シグナルを発 信することができますが、他のテクニカル・インディケータを使用してこれらの シグナルを確認することをお勧めします。例えば、RSIやMACDなどのオシレーターを使用して、トレンドの方向性やモメンタ ムの強さを確認してから売買を行うことを検討するとよいでしょう。
このインディケータのダッシュボードスキャナ: (Basic Harmonic Patterns Dashboard)
含まれるハーモニックパターン
- ガートレー
- バタフライ
- バット
- カニ
- サメ
- サイファー
- ABCD
主な入力
- Max allowed deviation (%): このパラメータは、調和的パターンの形成に許容される許容誤差を示す。このパラメータは、インジケータがそれを有効な形成として破棄することなく、調和パターンの構造がどの程度変化するかを決定する。したがって、パーセンテージを高く設定すると、パターン識別に柔軟性が増し、低い値を設定すると、より制限的になります。例: 値を30%に設定した場合、インジケータは、現在の価格の±30% の範囲内でパターンの比率に適合するフォーメーションを有効なフォーメーションと見なします。
- Depth: このパラメータは、ハーモニックパターンの各波動において、その波 動とみなすために必要な最小のバー数を決定します。数値が高いほど、パターンが長いことを意味し、逆も同様です。
- Deviation: 乖離とは、波の2つの振動(ピークまたは谷)間の価格の最大許容乖離量を指します。したがって、偏差が大きいほど、ピークまたは谷の価格差に大きなマージンを許容することになります。
- Backstep: このパラメータは、あるポイントが有効な高値または安値であ るかどうかを判断するために、インディケータが何本後ろのバー を探すかを指定します。言い換えれば、ジグザグ線をプロットする際に、何本後方のバー を考慮するかを示します。
- Pop-up alert: MT5ターミナルへのアラート。
- Email alert: 電子メールアラート
- Push notification alert: 電話へのアラート
*その他の入力は、色と透明度のカスタマイズに関係します。
売買シグナルは、Expert Advisorで使用したい人のために、バッファとして定義されています。
買いシグナル・バッファ = 6
売りシグナルバッファ = 7
警告 2つ目の入力を使って、インジケータを再描画するか、遅延させるかを選択できます。遅延に設定すると、インジケータはパターン形成後にシグナルを調整しません。このオプションは、誤ったシグナルを避け、トレードの一貫性を高めたいトレー ダーには好ましいでしょう。ただし、遅延させたインジケータは、市場の急激な変化に対応する感度と能力を失う可能性があることに注意する必要があります。


thank you