Area of Interest MT5
- インディケータ
- バージョン: 1.0

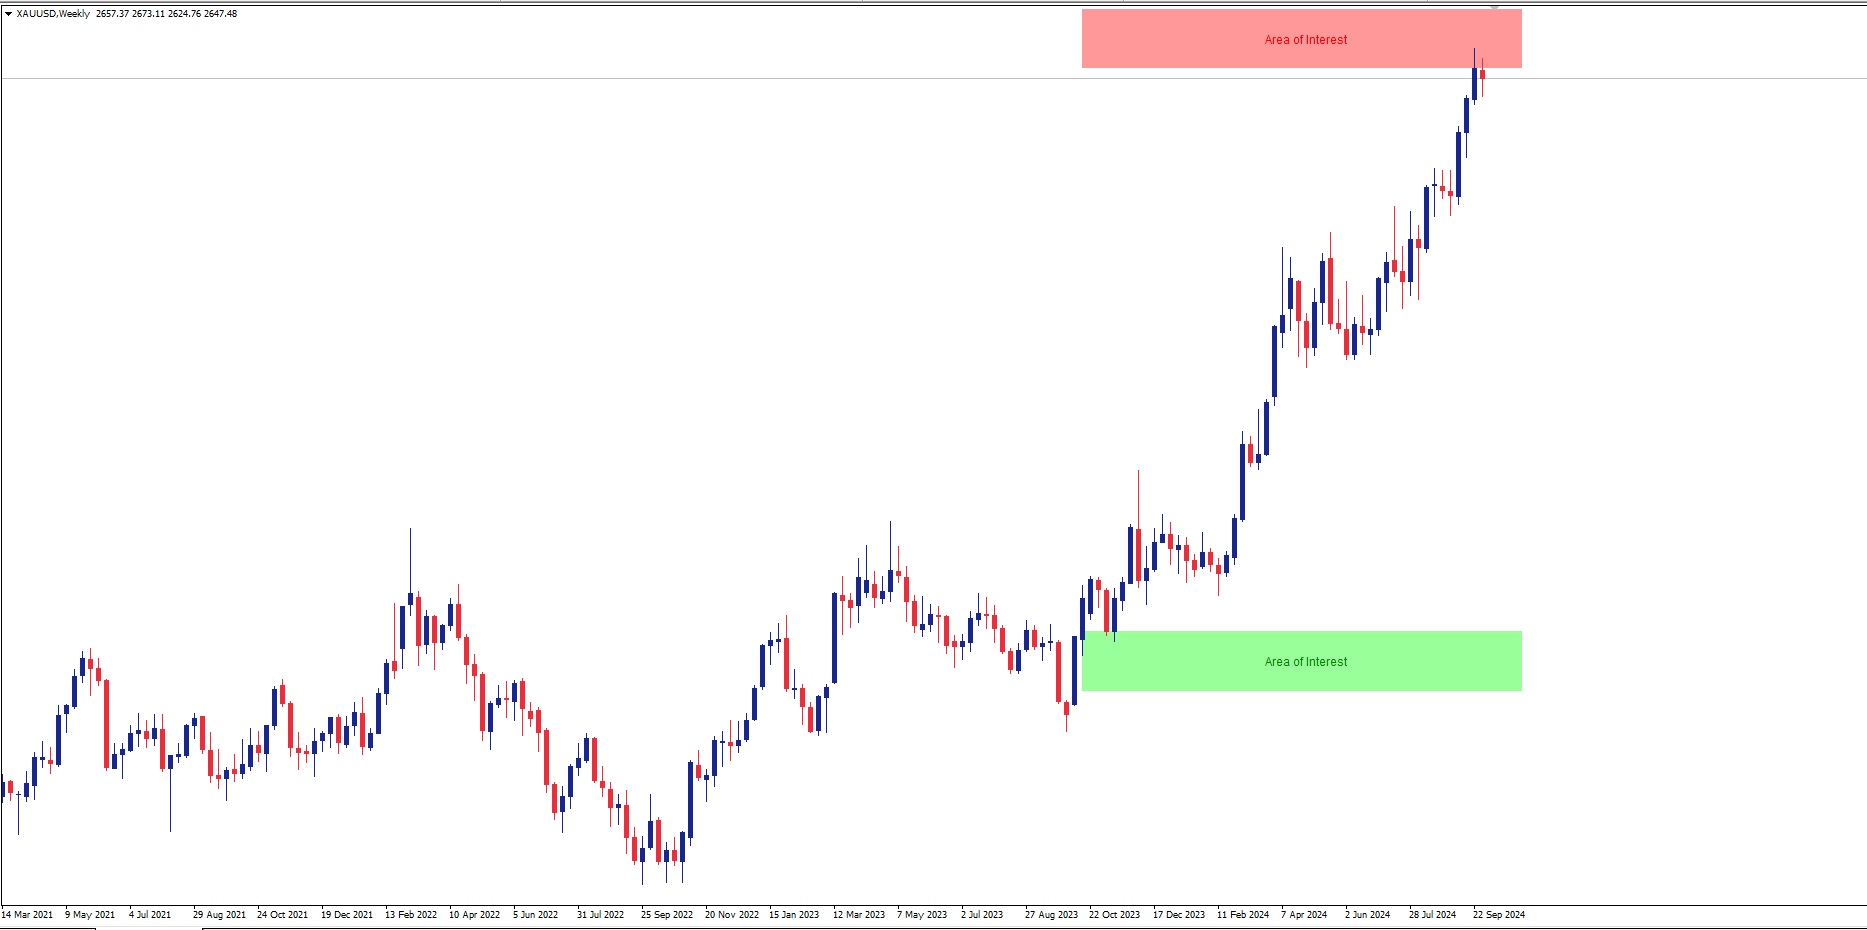
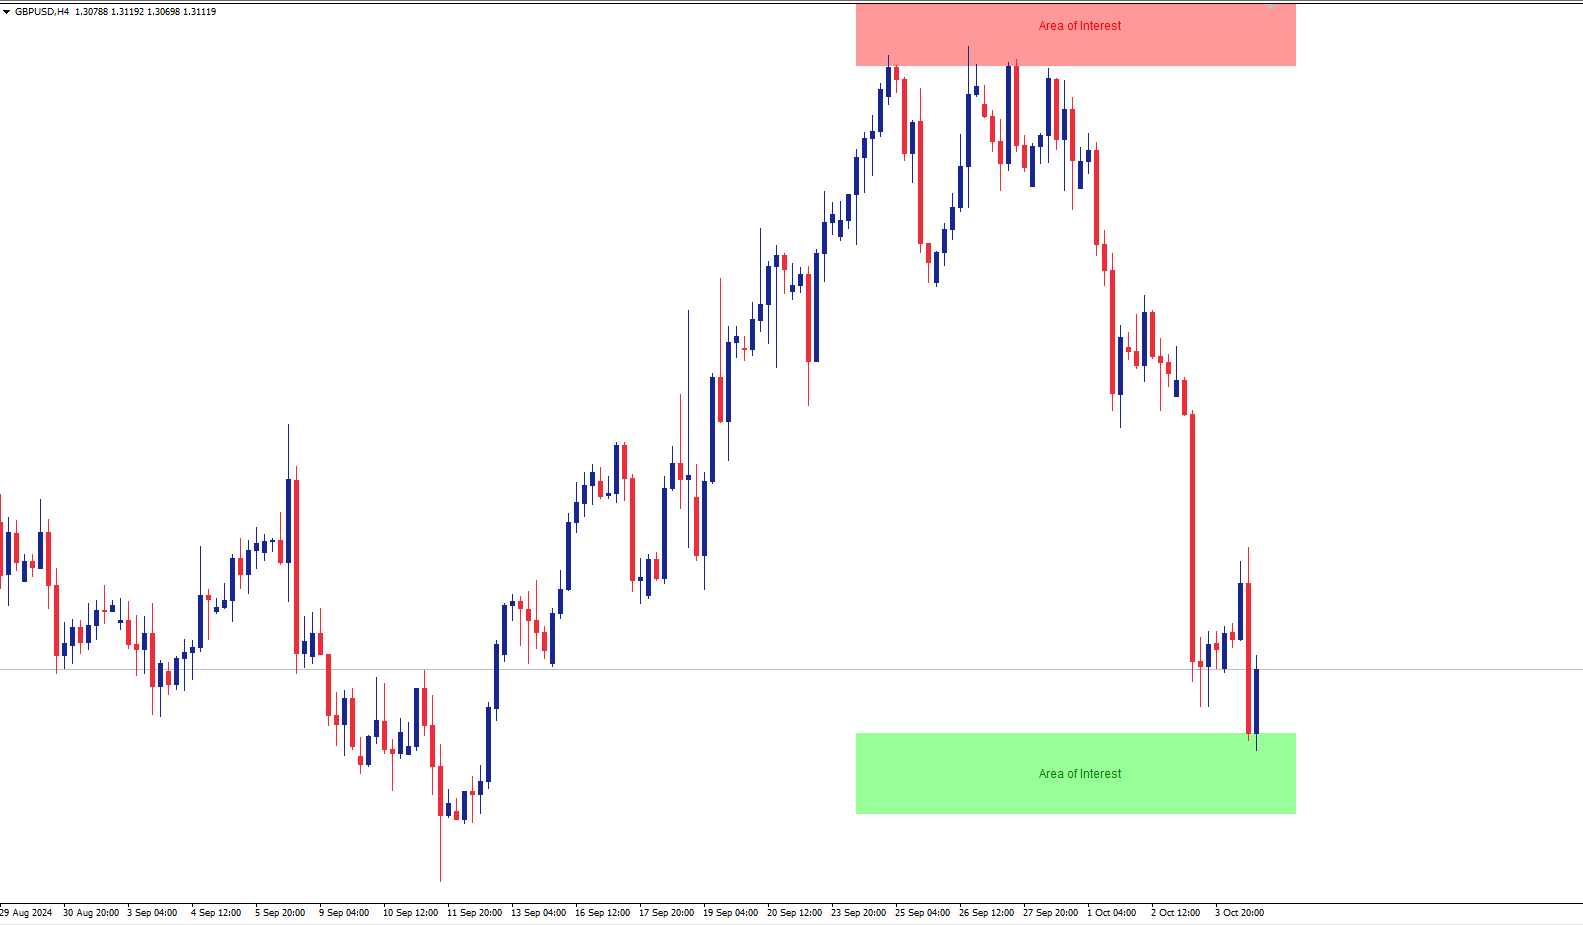
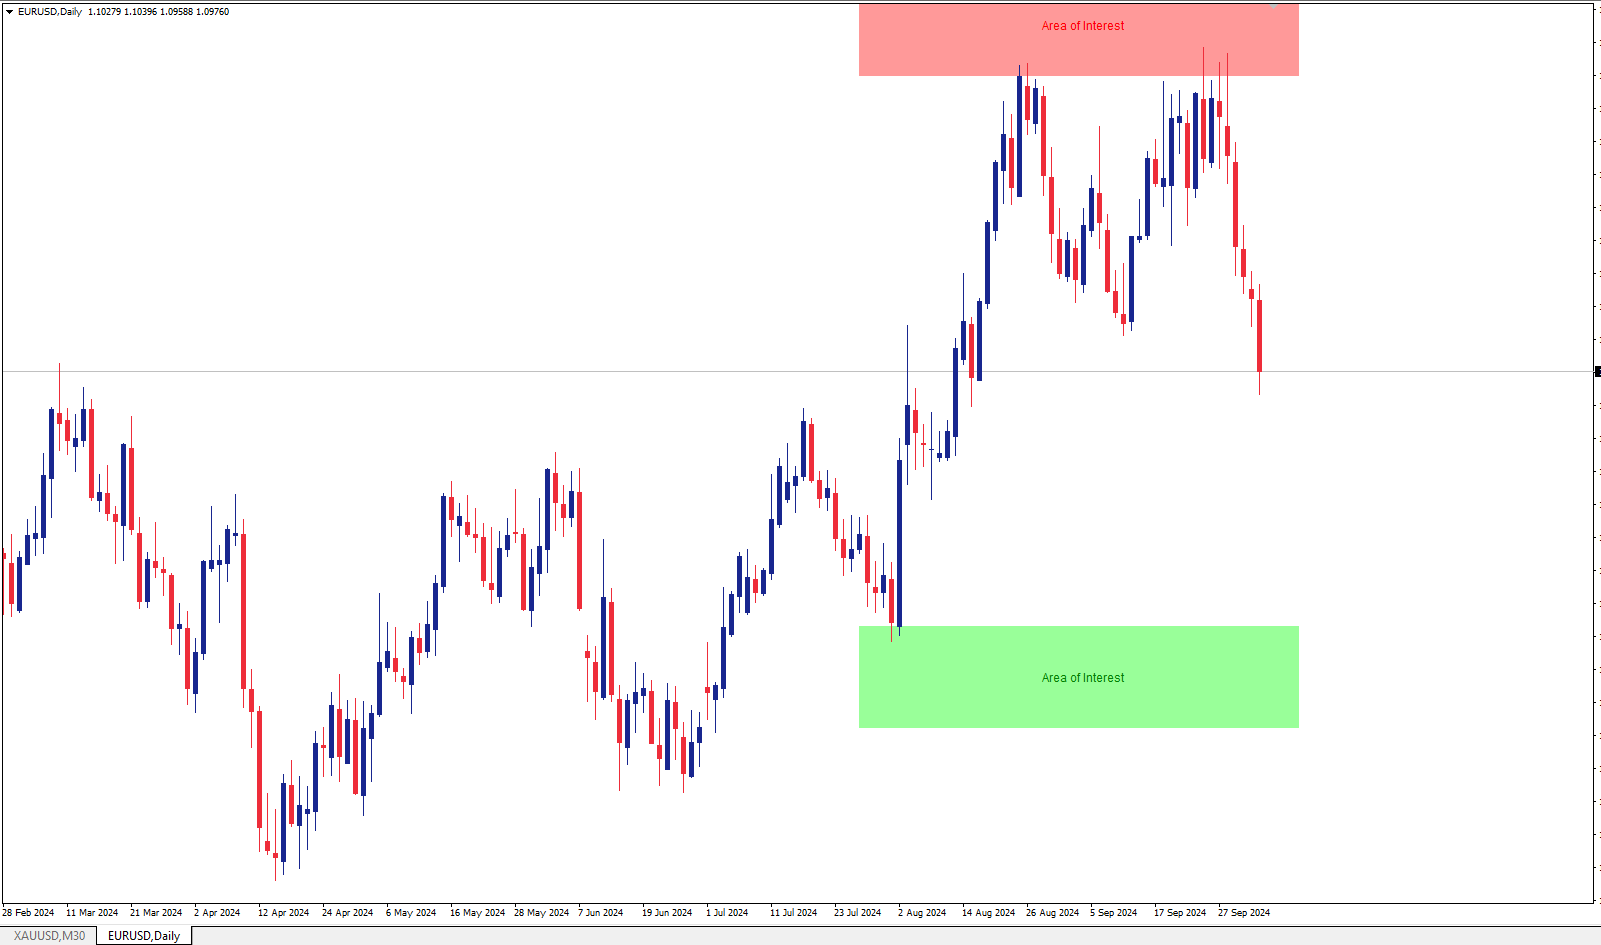
The Area of Interest (AOI) Indicator is a powerful tool designed to help traders identify key market zones where price reactions are highly probable. This indicator specifically highlights two critical zones:
-
Seller AOI (Area of Interest): This zone represents areas where sellers are likely to enter the market, often acting as resistance. When the price approaches or touches this zone, it signals that a potential sell-off could occur.
-
Buyer AOI (Area of Interest): The BOI zone identifies regions where buyers are expected to step in, typically serving as a support level. As the price reaches this zone, the indicator alerts traders that a potential buying opportunity may arise.
MT4 Version - https://www.mql5.com/en/market/product/124327/
Join To Learn Market Depth - https://www.mql5.com/en/channels/suvashishfx
Alerts for Real-Time Reactions:
- The AOI Indicator provides real-time alerts whenever the price touches either the Seller AOI or Buyer AOI. This ensures that you never miss a key trading opportunity, whether you're looking for entries or exits based on these crucial zones.
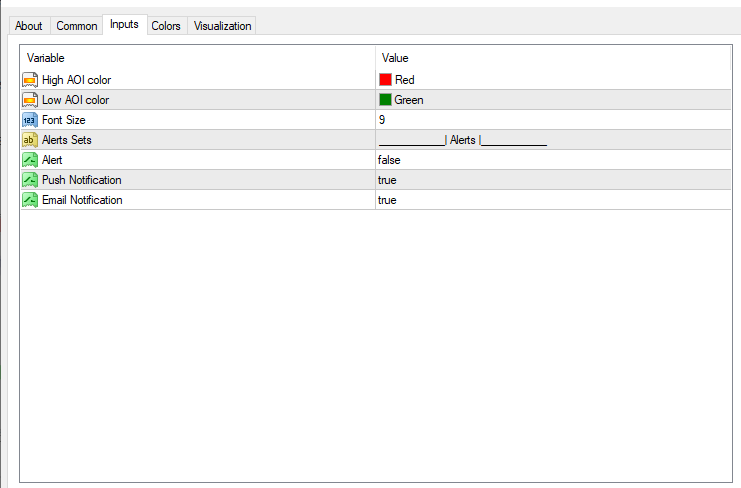
- Alerts are customizable, so you can receive notifications via pop-ups, sound, or email, depending on your preferences.
Key Features:
- Dynamic Zone Display: The indicator visually plots both the Seller and Buyer AOI directly on your chart, making it easy to spot potential areas where price may react.
- Price Touch Alerts: Receive instant alerts when the price touches either the Seller or Buyer AOI, giving you enough time to assess and act on market movements.
- Customizable Settings: You can fully customize the colors of the AOI zones to match your chart style. Additionally, there are options to adjust font sizes for better clarity and visibility.
This tool is perfect for traders who want to leverage key market zones for better entries and exits. Whether you're a beginner or an experienced trader, the AOI Indicator simplifies your analysis by highlighting the most important areas on the chart.
Note: Support is not available for free products, but the tool comes with easy-to-use customization options for changing zone colors, fonts, and alert settings.


Até o momento só sucesso.