Symbol Changer Pro for MT5
- インディケータ
- バージョン: 2.31
- アップデート済み: 14 2月 2025
- アクティベーション: 10
** NOTE: This indicator uses realtime data. Thus DO NOT download Demo version. If you still need demo version, please refer to trial version.
Version for MT4: https://www.mql5.com/en/market/product/123597
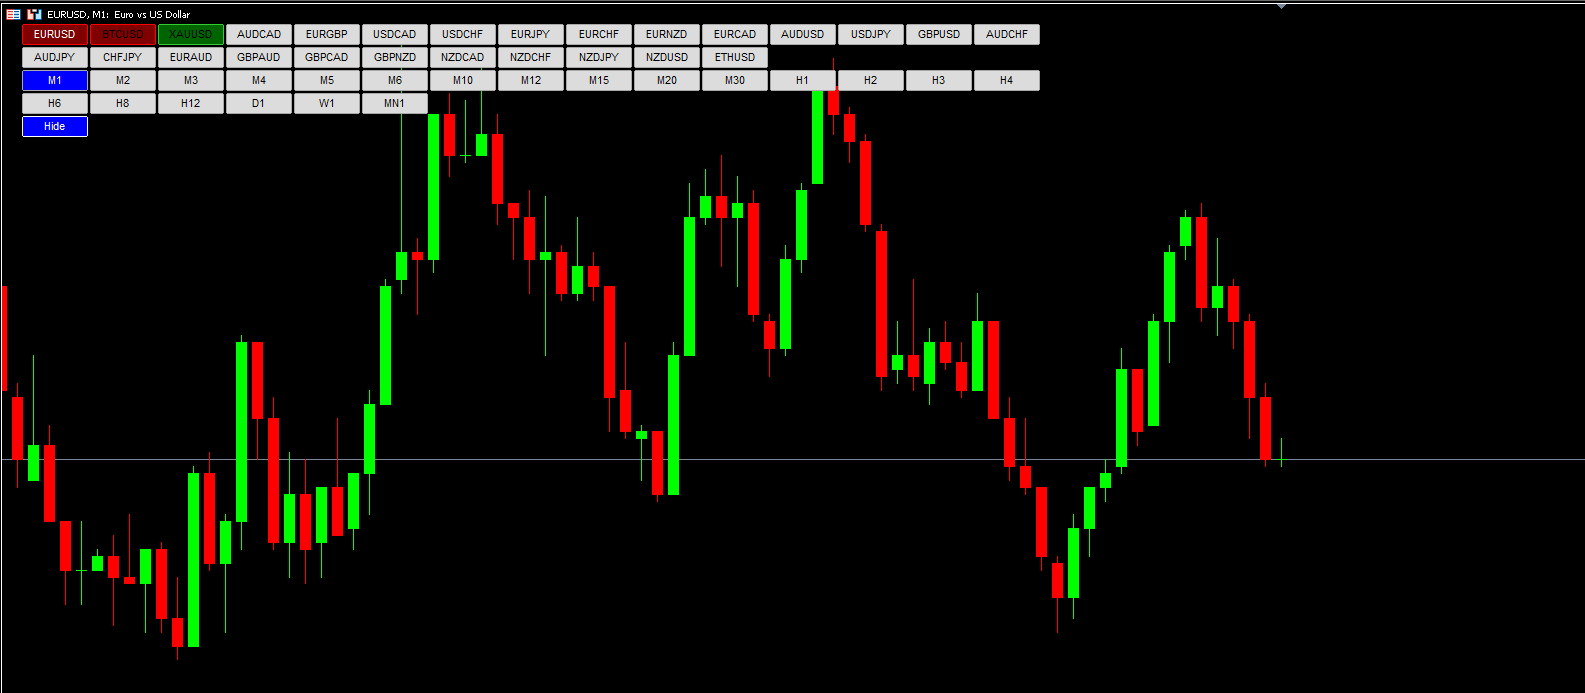
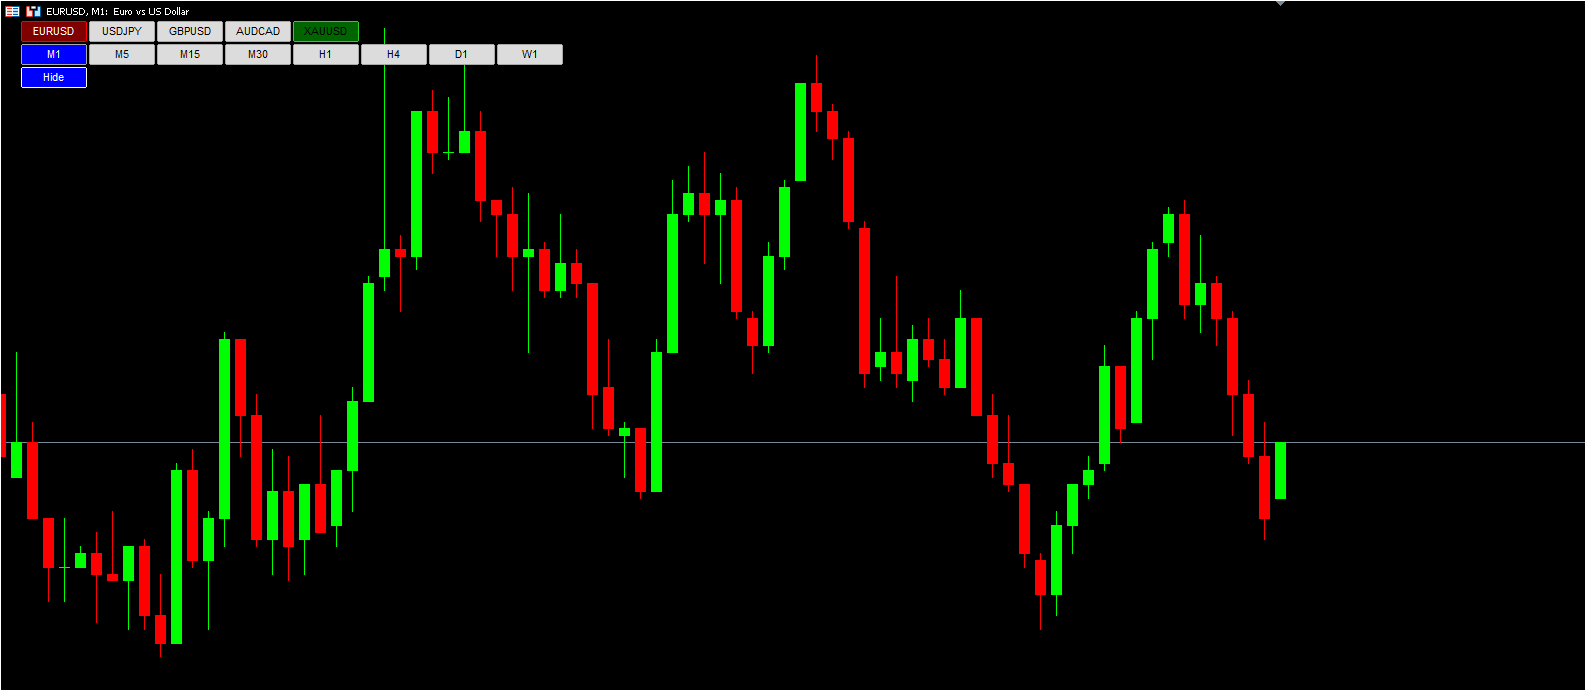
Symbol Chart Changer is an indicator/utility that offers you the option to switch between symbols and timeframes.
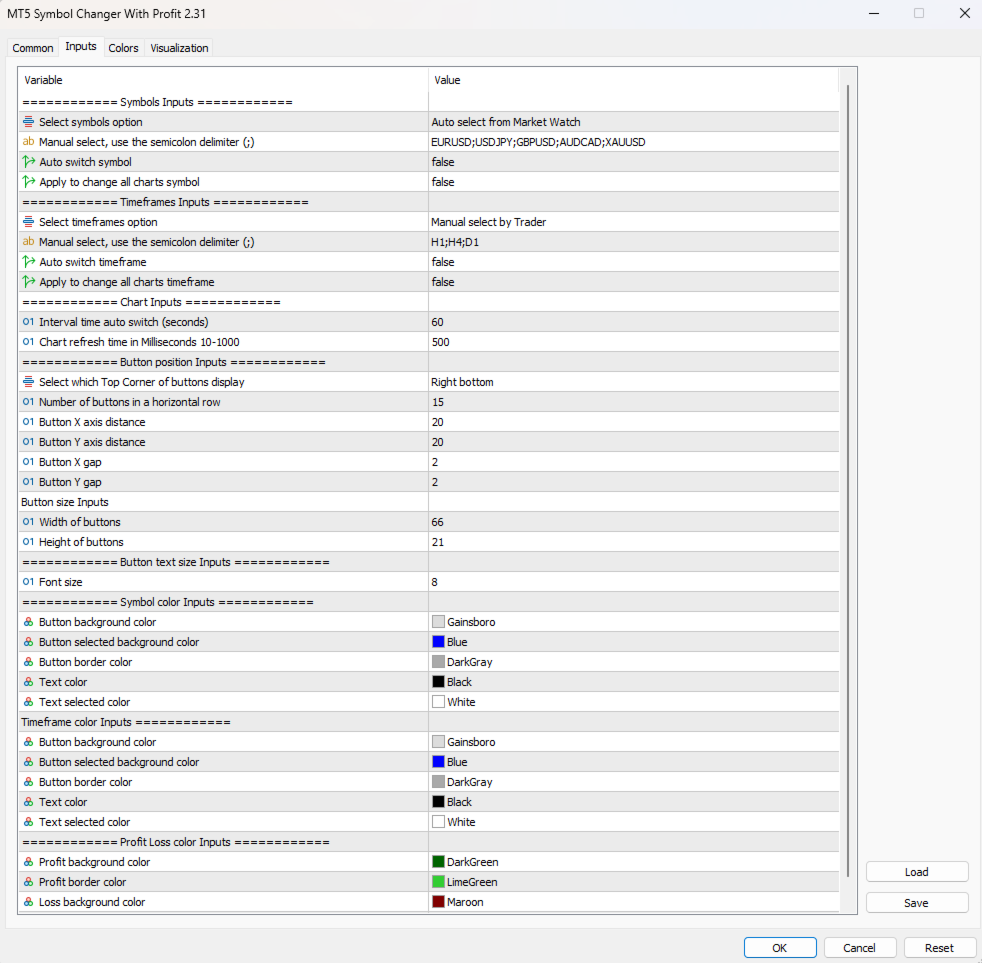
Click buttons on the chart to monitor all your favorite instruments. All symbols can be selected in MarketWatch or input manually. You can select all MT5 timeframe or some of them from Inputs window.
Indicator also provides an option to auto switch among symbols/timeframes.
Show profit of opening orders of symbol through the color of the buttons.
Contact me for support: https://www.mql5.com/en/users/thucpn
Check my other products: https://www.mql5.com/en/users/thucpn/seller