Advance Demand and Supply
- インディケータ
- バージョン: 2.1
- アップデート済み: 23 7月 2025

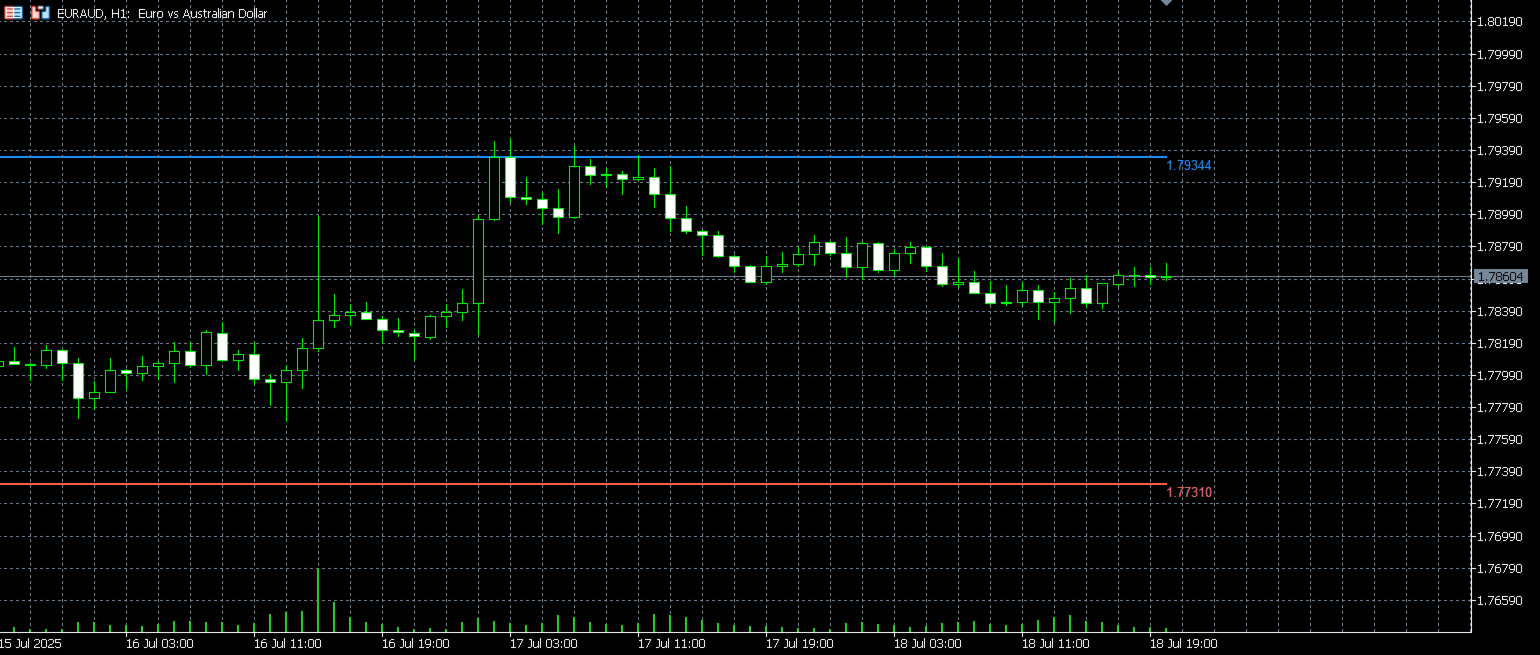
This Demand & Supply Zone Indicator with Volume Filtering is a technical analysis tool for MetaTrader that identifies key price zones where buying (demand) or selling (supply) pressure is concentrated. It uses fractals, volume analysis, and price action to detect and highlight these zones on the chart.
Key Features:
-
Zone Detection Based on Fractals
-
Identifies demand (support) and supply (resistance) zones using fractal patterns (local highs/lows).
-
Zones are formed from open prices around fractal points.
-
Adjustable fractal period ( FractalPeriod ) for sensitivity.
-
-
Volume-Based Filtering
-
Filters zones by trading volume ( EnableVolumeFilter ).
-
Keeps only the highest-volume zones ( VolumeFilterPercent ).
-
Helps focus on the most significant zones where institutional activity may be present.
-
-
Zone Strength Confirmation
-
Counts fractals within each zone ( fractalsCount ) to confirm strength.
-
Wider zones ( MinZoneWidth ) are considered more significant.
-
-
Broken Zone Detection
-
Detects when a zone is broken ( CandlesToConfirmBreak ).
-
Broken zones change color ( BrokenZoneColor ) to indicate invalidation.
-
-
Visual Customization
-
Adjustable colors for demand ( DemandZoneColor ), supply ( SupplyZoneColor ), and broken zones ( BrokenZoneColor ).
-
Optional zone fill for better visibility.
-
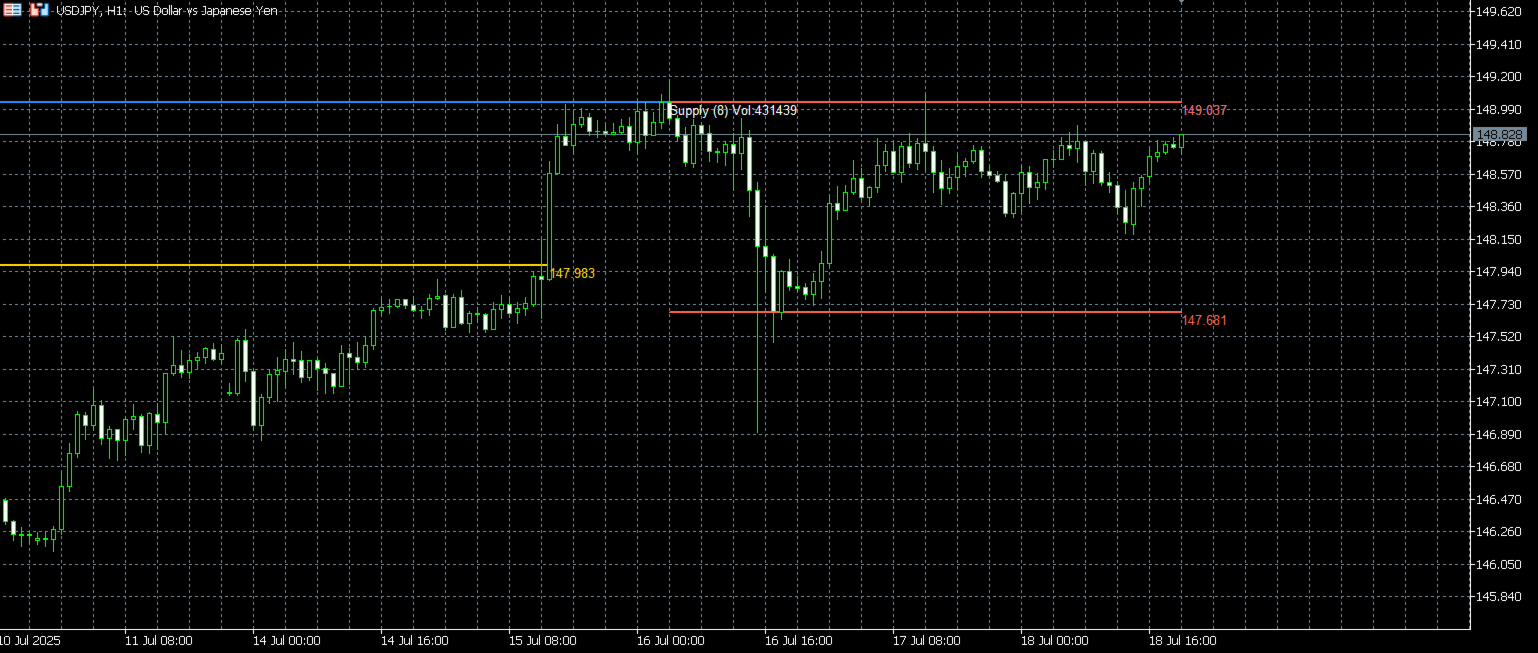
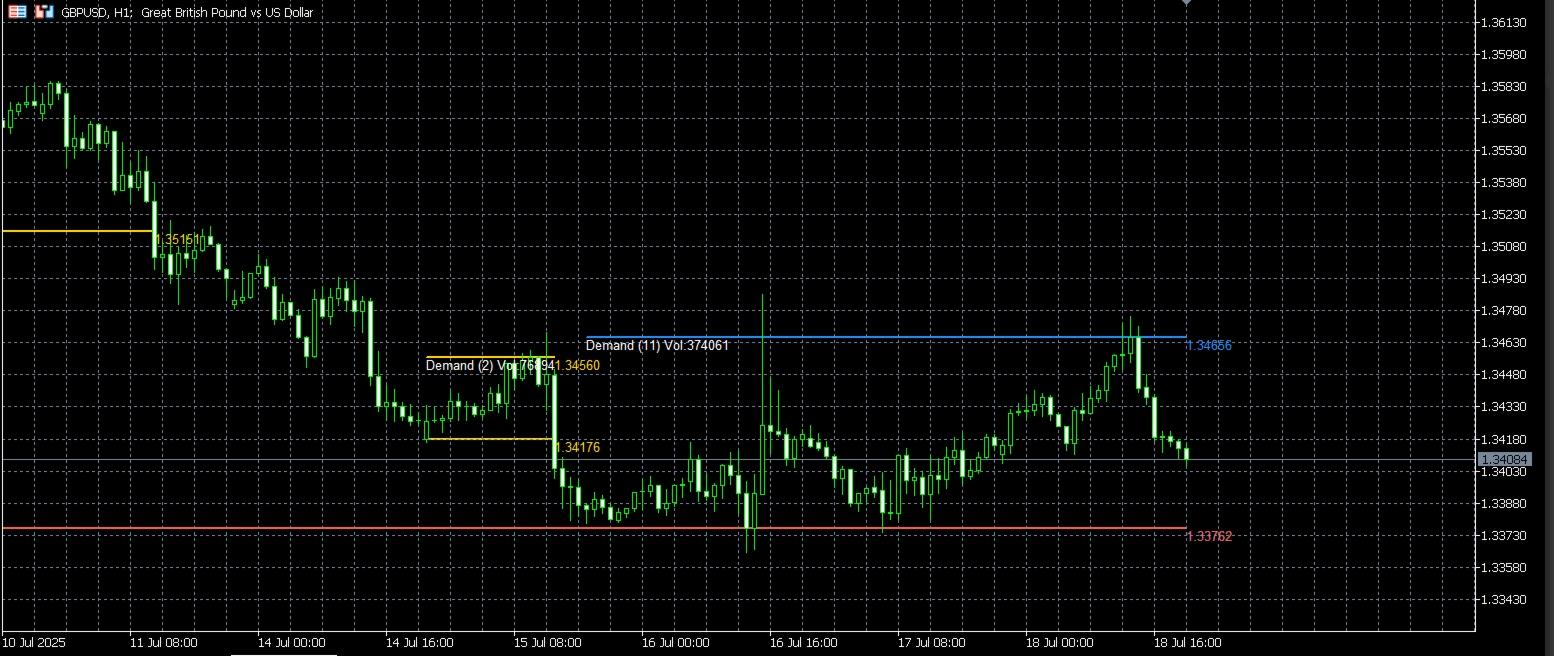
Price labels and volume/fractal count information
-
How It Works:
-
Demand Zones (Blue)
-
Formed when price makes a bottom fractal followed by a cluster of similar open prices.
-
High volume increases zone significance.
-
-
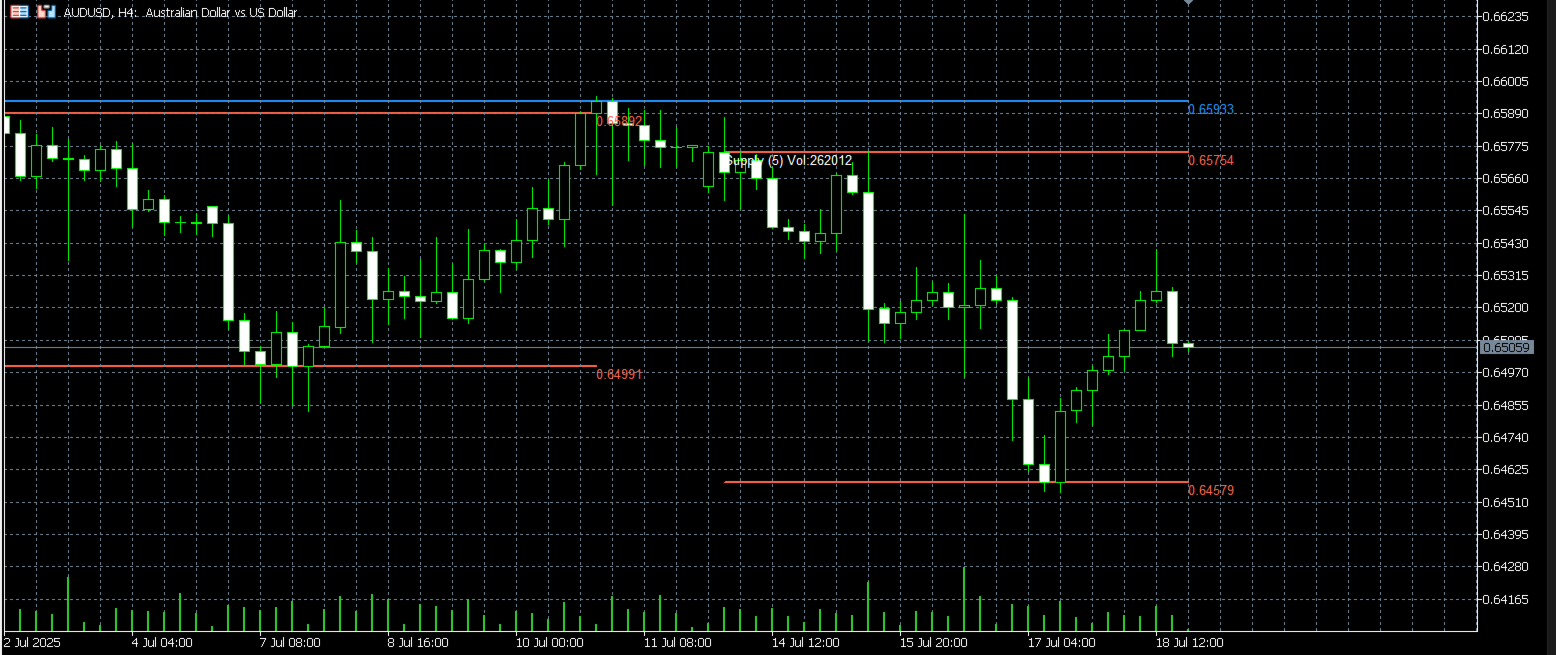
Supply Zones (Red)
-
Formed when price makes a top fractal followed by a cluster of similar open prices.
-
High volume increases zone significance.
-
-
Broken Zones (Gold)
-
When price closes beyond a zone for CandlesToConfirmBreak consecutive candles, the zone is marked as broken.
-
Use Cases:
-
Swing Trading: Trade bounces off demand/supply zones.
-
Breakout Trading: Watch for zones breaking with volume confirmation.
-
Price Action Confirmation: Combine with candlestick patterns for better entries.

great product