Fakeouts

Advanced Fakeout Detection Indicator 

Professional Liquidity Sweep & Market Structure Analysis for MetaTrader 5

The Advanced Fakeout Detection Indicator is a sophisticated technical analysis tool designed to identify high-probability market reversal opportunities by detecting liquidity sweeps and structural breaks in price action.


What This Indicator Does

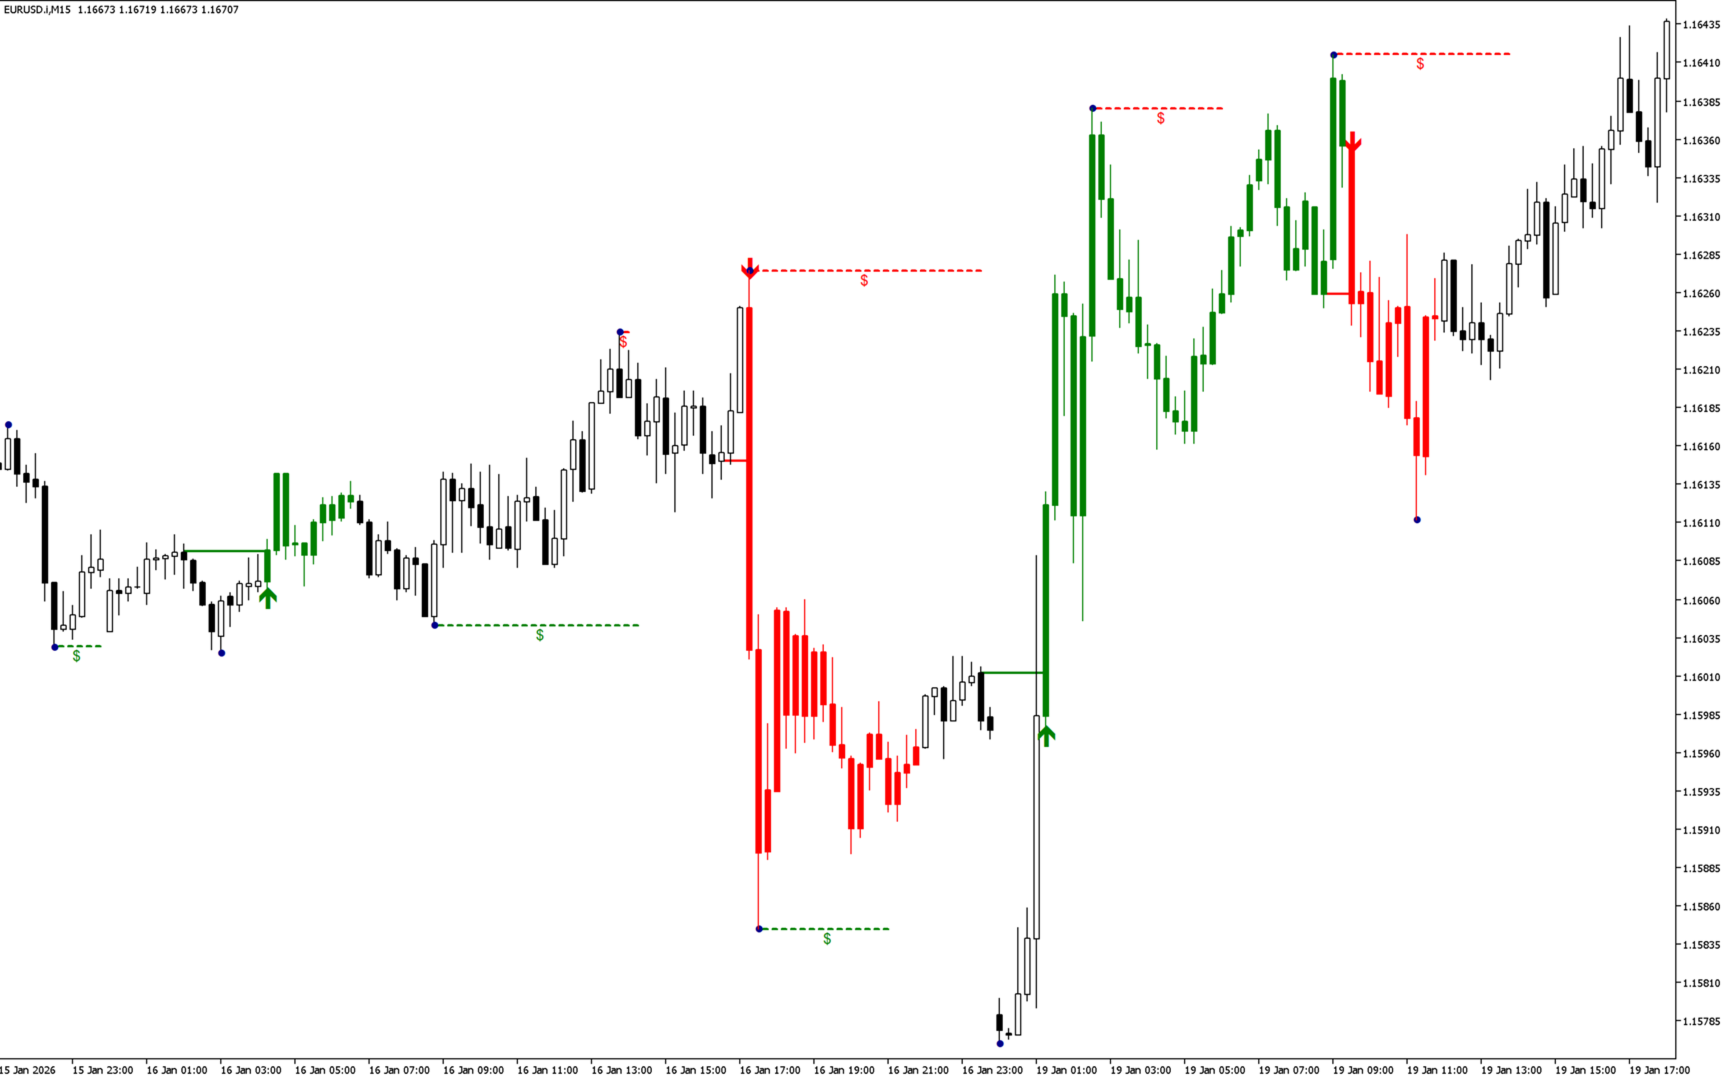
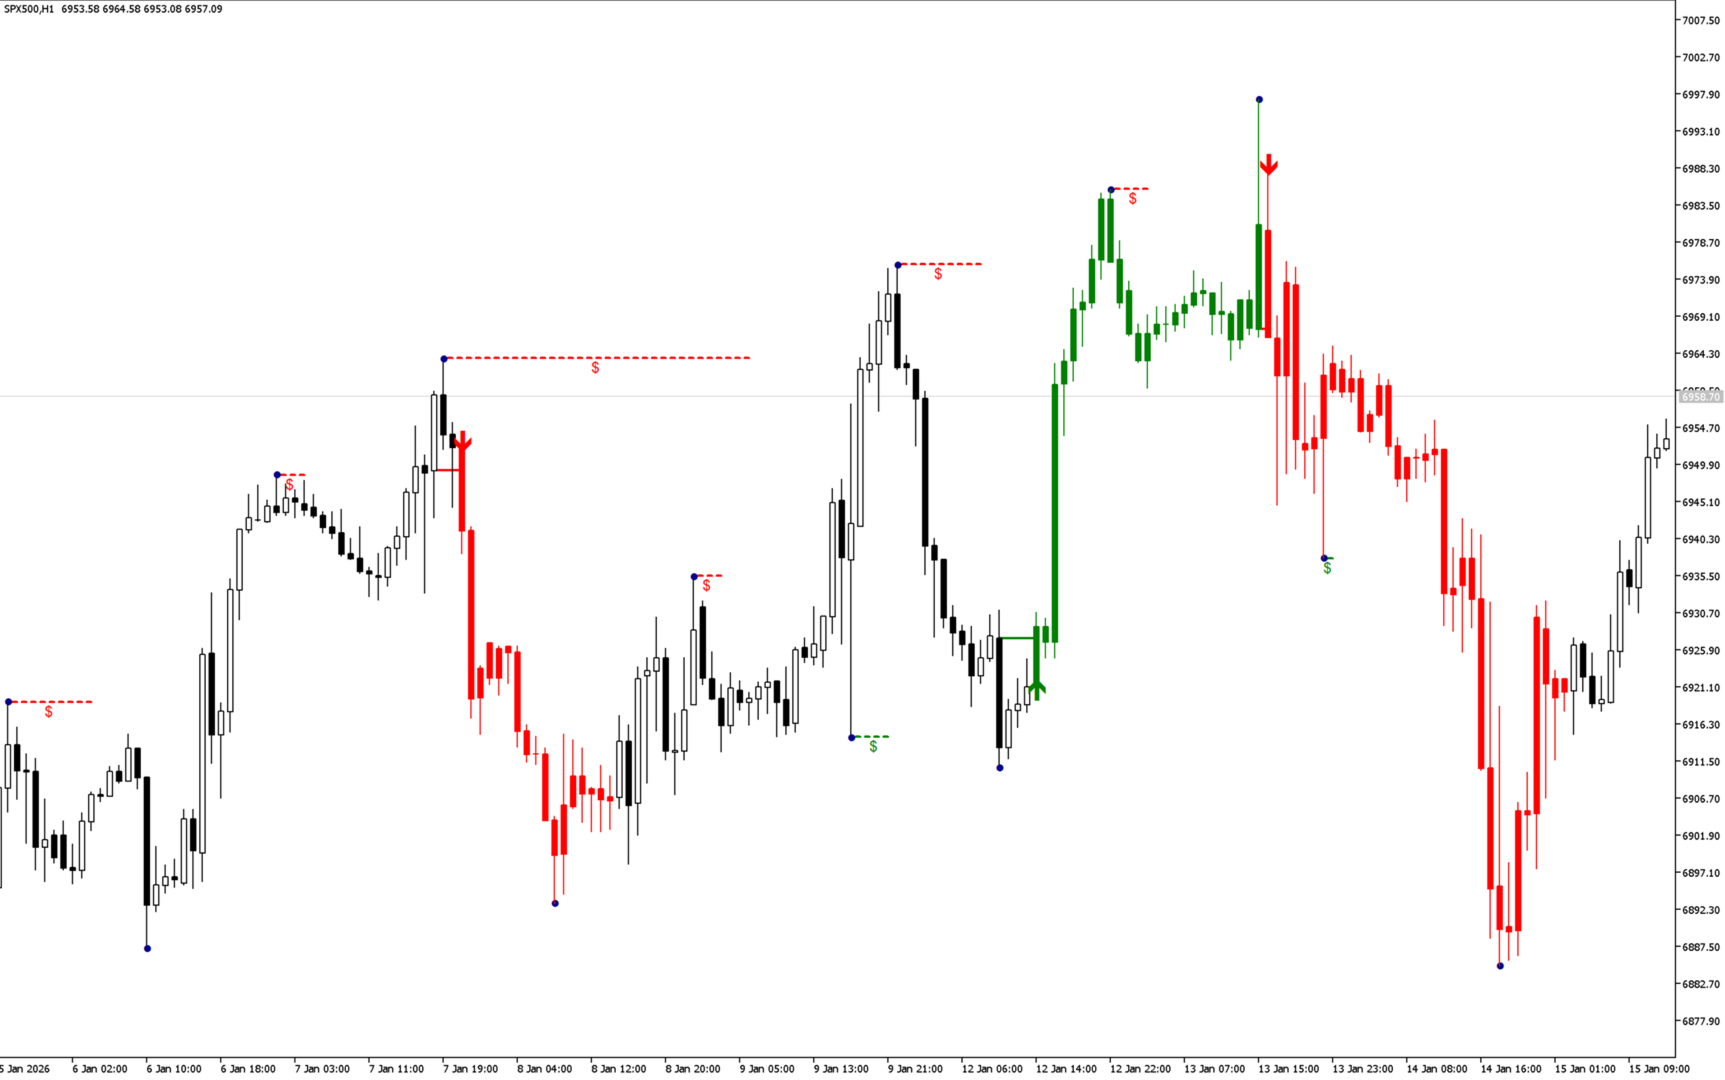
This indicator automatically identifies and visualizes potential fakeout scenarios where price temporarily breaks through significant levels before reversing. It combines multiple analytical components to provide traders with clear, actionable signals:

  • Automated Pivot Detection: Identifies significant swing highs and lows based on configurable parameters
  • Liquidity Sweep Recognition: Detects when price breaks beyond key pivots, potentially triggering stop losses
  • Confirmation Mechanism: Waits for price structure confirmation before generating signals
  • Visual Market Structure: Displays trend direction and potential reversal points directly on your chart

    Key Features

    Signal Generation

    • Bullish signals appear when conditions align after a downside liquidity sweep
    • Bearish signals appear when conditions align after an upside liquidity sweep
    • Clear arrow markers at potential entry points
    • Configurable patience parameter for signal confirmation

    Visual Components

    • Optional pivot point markers to visualize market structure
    • Horizontal lines showing sweep levels and structural breaks
    • Color-coded candles highlighting active signal zones
    • Dollar sign labels marking liquidity sweep locations

    Customizable Parameters

    • Pivot Length: Controls sensitivity of swing point detection (default 12)
    • Max Pivot Edge: Maximum age of pivots to consider (default 50 bars)
    • Confirmation Patience: Number of bars required for signal confirmation (default 7)
    • Trend Noise Filter: Threshold for filtering out low-quality setups (default 0.7)
    • History Bars: Number of historical bars to analyze (default 1000)

    Display Options

    • Customizable colors for bullish and bearish signals
    • Toggle pivot markers on/off
    • Toggle sweep and structure lines on/off
    • Toggle candle coloring on/off
    • Toggle dollar sign labels on/off

      How to Use

      1. Attach the indicator to any chart and timeframe
      2. Adjust the Pivot Length parameter based on your preferred swing detection sensitivity
      3. Set the Confirmation Patience to control signal timing
      4. Monitor for signal arrows combined with visual confirmations
      5. Use the displayed market structure lines to identify key levels

      The indicator works on all currency pairs, indices, commodities, and cryptocurrencies. It is most effective on timeframes from M15 to H4 where swing structure is clearly defined.


      Important Notes

      This indicator is a technical analysis tool designed to assist in identifying potential trading opportunities. It does not guarantee profits and should be used as part of a comprehensive trading strategy with proper risk management. All input parameter names and on-chart displays are in English as required by MQL5 marketplace standards.


      Performance Optimization

      The indicator uses an efficient full-rebuild architecture that recalculates only when new bars form, ensuring minimal CPU usage even with extended history analysis.


      Preferred Settings

      • Scalping (M5-M15): Pivot Length 8-10, Patience 3-5
      • Intraday (M15-H1): Pivot Length 12-15, Patience 5-7
      • Swing Trading (H1-H4): Pivot Length 15-20, Patience 7-10


      This is not financial advice! 


      おすすめのプロダクト
      Crash 1000 AI Indicator is an AI-powered, highly accurate trading system designed for Deriv Boom & Crash indices and Weltrade Pain & Gain assets. It delivers precise spike and scalping signals, clear entries, stop-loss guidance, and smart exit alerts. Built for consistency, speed, and real profitability, this indicator helps traders trade with confidence and control using advanced AI logic. . Why Traders Are Choosing This Indicator: Advanced AI-powered logic for precision trading Highly ac
      The indicator to trade price consolidation is designed to identify price contraction and alerts us on formation. It does this by analyzing historical price data and identifying price action patterns. The algorithm then uses this information to mark the zone , potential targets and liquidity lines, giving us valuable insights into market behavior.  Traders can adjust parameters such as colors ,alerts types and how many  previously formed zones to display on chart . Furthermore, the indicator can
      MTF Candle Panel   displays real multi-timeframe candlesticks in a compact side panel on your chart, allowing you to instantly see price action from higher and lower timeframes   without switching charts . Each timeframe is shown in its own row with properly scaled candles, so you get an accurate visual of structure, direction, and momentum at a glance. MT4 Version -  https://www.mql5.com/en/market/product/163704/ Join To Learn Market Depth -   https://www.mql5.com/en/channels/suvashishfx How it
      Order Block Tracker   is here to solve one of the biggest challenges traders face: identifying order blocks. Many traders fail to spot these critical zones, often missing out on key market entries. But with   Order Block Tracker , you no longer have to worry about that. This advanced indicator automatically highlights these crucial zones for you, giving you the confidence to enter the market at the right time. MT4 Version -  https://www.mql5.com/en/market/product/123358/ Key Features of   Order
      VWAP Bands
      Rafael Caetano Pinto
      This indicator uses VWAP and projects this VWAP into up to 3 levels, shifted by a percentage of the chart's symbol. How to configure: Choose the symbol and desired graphic time Set the start time of the symbol (in bovespa, WIN and WDO start at 9 o'clock). This time is used as the cutoff reference for VWAP. Check which VWAP period fits the chart better: Ideally, a period when VWAP is not too distant from the chart Set percentage levels: Ideally, you should set levels based on history, so that le
      Market Sessions + Pro Sentiment VP (Full Theme Sync Edition) The All-in-One Institutional Workspace for MetaTrader. Elevate your trading environment with a professional-grade toolkit designed for high-precision day trading. This isn't just an indicator; it’s a total chart transformation. The   Market Sessions + Pro Sentiment VP   replaces cluttered, manual setups with an automated, institutional-style dashboard. Key Features: Automatic Theme Sync:   Instantly transforms your MetaTrader interfac
      Precision Trading SystemsによるPTS Demand Indexコード Demand IndexはJames Sibbetによる創造物であり、複雑なコードを使用して、ボリュームと価格の組み合わせの解釈を簡単にします。 ボリュームの理解は決して簡単な作業ではありませんが、この美しいプログラミングの一部は、それをはるかに簡単にします。 このインジケータがトレーダーや投資家にどのように利益をもたらすか、いくつかの方法があります。 ダイバージェンス(先行指標として) 私は多くの技術指標を数年間研究してきましたが、Demand Indexは意義深いダイバージェンスを見つけるためのキングの1つだという意見を持っています。 市場価格が新高値を記録し、Demand Indexがそうでない場合、これはベアリッシュダイバージェンスとして知られています。どのように探すかを理解するのに役立つ、極端なダイバージェンスの例を示す私のウェブサイトにはいくつかのドラスティックな写真があります。ダイバージェンスの差が大きいほど、トレンド変更イベントを予測するポインターとしてその重
      Daily & Composite Volume Profile   This is a professional-grade market profile tool designed for MetaTrader 5. It utilizes a   Dual-Profile System   to visualize supply, demand, and liquidity concentrations. Key Features Left Side: Daily Session Profiles Automatically identifies the start and end of every trading day. Generates a unique Volume Profile for each individual day. Allows you to see how value migrated from yesterday to today (e.g., Is today's volume higher or lower than yesterday?).
      The Urgently indicator is designed to quickly determine the situation in the market, reflect the state of the market and signal profitable levels for opening trades. Market conditions change quickly enough, requiring constant calibration of trading strategies. Recommended for use in conjunction with any of the oscillators. The Urgently forex market trend indicator shows the trend direction and entry points. It smooths out price fluctuations when generating a signal by averaging the data and the
      A simple Zig Zag indicator with added visualization of Higher High, Lower High, Higher Low, Lower Low. This indicator will be very helpful when working with support/resistance levels. The ZigZag indicator is a fundamental tool that will significantly help you navigate complex situations in the financial markets. By providing a clear visual representation of price movements and trends, it simplifies the analysis process and improves decision-making capabilities. Its role in identifying trends and
      Indicator-forecaster. Very useful as an assistant, acts as a key point to forecast the future price movement. The forecast is made using the method of searching the most similar part in the history (pattern). The indicator is drawn as a line that shows the result of change of the close price of bars. The depth of history, the number of bars in the forecast, the patter size and the quality of search can be adjusted via the indicator settings. Settings: PATTERN_Accuracy_ - quality of the search.
      FREE
      Markets Heat indicator can help you determine correct course of action at current market situation, by calculating market's "heat level". What is market's "heat level"? Well, it's my own way of simplifying complex market conditions to ease decision-making process. How does it work? Most of time market is moving in some narrow range and can't "decide" where to go -> flat market -> cold market. Other times, price goes Up or Down -> making trend movements -> heating the market. More powerful trends
      Volume Delta Candles offer a straightforward way to analyze trading activity within each candle, making it easier to see what's happening without needing an extra volume indicator. This tool uses lower timeframe or real-time data to show the percentage of buying and selling volume within a candle as a colored bar. Make sure you understand Volume and Volume Delta before jumping in. If you’re not sure, reach out to me first for a quick rundown. But if you're already familiar, you're good to go! Ke
      Do you use volume in your reading of the market? Certainly many traders use it, and do not imagine operating without it. The Color Histogram Volume Set indicator allows the user to choose the value that he considers interesting to monitor. When you pass this you will have visual confirmation and if you want you will also have the audible alert that is given by the indicator. Of course, there are other ways to try to find a high volume, such as assessing whether the volume is above av
      The indicator automatically calculates the level and   real volume       Point of control, and also displays the market profile for an array of candles, within the boundaries of a rectangle. If your strategy is based on taking profit on a rebound from price accumulations,   the Range profile indicator will become the main tool in scalping trading. Point of control is calculated based on the total volume for each tick or minute candles, depending on the settings and trading timeframe. In the abse
      Introducing Genius EA Creator for MetaTrader 5: Simplify Your Automated Trading Like Never Before Ready to automate your trading without worrying about coding? Genius EA Creator for MetaTrader 5 is here to transform the way you trade by offering a flexible and powerful platform that anyone can use. Whether you’re a beginner or an experienced trader, you’ll appreciate how this tool allows you to design and execute strategies tailored to your needs—no programming skills required! Key Features and
      Dual Bollinger Session Channel MetaTrader 5 向けプロフェッショナル固定セッション ボリンジャーチャネル リアルなセッションデータを用いた、プライスアクション、ブレイクアウト、機関的マーケット構造分析のために設計されています。 製品概要 Dual Bollinger Session Channel は MetaTrader 5 向けのプロフェッショナルグレードのテクニカルインジケーターであり、直近の 実際の取引セッション (日足または週足)に基づき、2つの独立したボリンジャーバンド計算から固定された統計的価格チャネルを構築します。 従来のボリンジャーバンドが新しい足が形成されるたびに継続的に再計算されるのに対し、本インジケーターは 現在のアクティブセッション全体を通じてすべてのチャネルレベルを固定 し、取引期間中、安定的かつ信頼性の高い統計的枠組みを提供します。 このアプローチにより、以下の要素を正確に可視化できます: 価格の均衡ゾーン 統計的な過伸長領域 ボラティリティの拡大・収縮領域 本インジケーターは すべての時間足 (タイムフレーム
      インジケーター技術仕様 – Delta Profile for MetaTrader 5 Delta Profile は MetaTrader 5 用に開発されたインジケーターで、指定されたローソク足範囲内の出来高フローを詳細に分析するためのものです。異なる価格レベルにおける正の出来高(上昇に関連)と負の出来高(下降に関連)の不均衡を構造化し、可視化します。その結果、ユーザーは最も多くの取引が集中する価格帯や実際の市場不均衡が形成される領域を明確に把握できます。 以下に、本インジケーターの主要な技術特性と設定パラメータを示します。 基本コンセプト インジケーターは 価格レベル を識別し、それらを正の出来高、負の出来高、および純 Delta(正負の出来高差)に分類します。 各価格レベルは 水平バー としてチャートに表示され、市場の活動ゾーンや不均衡領域を視覚的に確認できます。 ユーザーは 分析対象ローソク足数 、 価格の丸め精度 、 最大表示レベル数 、および 表示スタイル を自由に設定できます。 主要機能 価格レベルのマッピング :設定された精度に基づき価格を丸め、対応するローソク足の
      The   ICT Unicorn Model   indicator highlights the presence of "unicorn" patterns on the user's chart which is derived from the lectures of   "The Inner Circle Trader" (ICT) . Detected patterns are followed by targets with a distance controlled by the user.   USAGE (image 2) At its core, the ICT Unicorn Model relies on two popular concepts, Fair Value Gaps and Breaker Blocks. This combination highlights a future area of support/resistance. A   Bullish Unicorn Pattern   consists out of:
      Delta + CVD & CVD Candles Order-flow indicator combining Delta (Ask–Bid), Cumulative Volume Delta (CVD), and a unique CVD-based synthetic candle system. Shows buy/sell pressure, volume aggressiveness, and momentum shifts with optional Delta histogram, CVD line, and CVD+Delta combined candles. Useful for scalping, intraday trading, divergence detection, and understanding buyer/seller dominance. Overview The Delta + CVD & CVD Candles Indicator combines multiple order-flow tools into one clean
      Product Description  Clean, Smart Sessions is a professional trading sessions indicator designed to provide traders with a clear, accurate, and clutter-free view of the active market sessions directly on the chart. The indicator dynamically detects and displays the active trading session (Asian, London, and New York) in real time, drawing a clean session box that continuously updates to reflect the session’s true high and low. When sessions overlap, each active session is handled independently
      FREE
      SPECIAL LAUNCH OFFER: $30 (1-Month Rent) Limited time offer to build our community and gather feedback! AmbM GOLD Institutional Scalper A high-precision M5 algorithm for XAUUSD (Gold) , engineered to trade exclusively at Institutional Liquidity Levels ($5/$10 psychological marks). PERFORMANCE DATA (BUY ONLY) • Win Rate: 87.09%. • Safe Growth: +$4,113 profit on $10k (13.75% Max Drawdown). • Extreme Stress Test: Successfully generated +$22,997 in a 5-year stress test (2020-2026), proving
      メタトレーダー用ボリュームプロファイルインジケーターで、ボリューム分析の威力を実感してください! /   MT4バージョン ベーシックボリュームプロファイルは、取引の最適化を目指すマニュアルトレーダーのために特別に設計されたインジケーターです。ボリューム・プロファイル・インジケータは、市場の動きをより深く理解したい本格的なトレーダーにとって不可欠なツールです。当社の革新的なソリューションにより、取引量が価格にどのように分布しているかを明確かつ簡潔に視覚化することができます。これにより、支持線・抵抗線、集積・分配ゾーン、重要なコントロール・ポイントなど、主要な注目エリアを特定することができます。特定の日の取引量を表示する通常の出来高インジケーターとは異なり、ベーシック・ボリューム・プロファイルは特定の価格における取引量を表示します。 当社のインジケータは、直感的でカスタマイズ可能なインターフェイスを備えており、お客様の取引の好みに合わせてカスタマイズすることができます。 特徴 価格チャート上に出来高プロフィールを明確に表示。 出来高の多いエリアと少ないエリアを素早く識別。 取引ス
      AUC - Super Trends   は、価格の動きに基づいた視覚的なラインで市場の方向を示すインジケーターです。 このインジケーターは、価格追跡システムを使用して上昇局面と下降局面の変化を示します。ラインは市場の変動に応じて自動的に調整されます。 Forex、指数、ゴールドなどのさまざまな金融商品や複数の時間足で使用できます。 ---------------------------------------------------- 機能 市場方向の可視化 価格変動の変化の識別 トレンド分析の補助 ---------------------------------------------------- 特徴 上昇および下降局面の視覚的表示 価格への自動適応 シンプルで分かりやすい表示 複数の時間足に対応 さまざまな金融商品で使用可能 注意 本インジケーターは分析を補助するツールであり、リスク管理や意思決定の代替ではありません。
      FREE
      SMC Venom Model BPR インジケーターは、スマート マネー (SMC) コンセプトで取引するトレーダー向けのプロフェッショナル ツールです。価格チャート上の 2 つの主要なパターンを自動的に識別します。 FVG   (フェアバリューギャップ) は、3 本のローソク足の組み合わせで、最初のローソク足と 3 番目のローソク足の間にギャップがあります。ボリュームサポートのないレベル間のゾーンを形成し、価格修正につながることがよくあります。 BPR   (バランス価格範囲) は、2 つの FVG パターンの組み合わせで、「ブリッジ」を形成します。これは、価格がボリュームアクティビティの少ない動きで動くときに、ブレイクアウトしてレベルに戻るゾーンで、ローソク足の間にギャップを作成します。 これらのパターンは、大規模な市場プレーヤーと一般参加者の相互作用が発生するチャート上のボリュームと価格動向の分析に基づいて、トレーダーが主要なサポート/レジスタンス レベル、ブレイクアウト ゾーン、エントリ ポイントを識別するのに役立ちます。 インジケーターは、長方形と矢印の形でパターンを視覚
      MT5対応の強力なCrypto_Forexインジケーター、HTF WPRオシレーター。 - MT5対応のプロフェッショナルHTF WPRオシレーターで、トレード手法をアップグレードしましょう。HTFとはHigher Time Frame(高時間枠)の略です。 - WPRはスキャルピングに最適なオシレーターの一つです。 - このインジケーターは、売られ過ぎ/買われ過ぎの領域からプライスアクションエントリーを行うマルチタイムフレームトレードシステムに最適です。 - HTF WPRインジケーターを使用すると、高時間枠のWPRを現在のチャートに表示できます。これはプロフェッショナルなトレードアプローチです。 - インジケーターにはモバイルとPCの両方に対応したアラート機能が搭載されています。 高品質のトレーディングロボットとインジケーターをご覧になるにはここをクリックしてください! これは、このMQL5ウェブサイトでのみ提供されるオリジナル製品です。
      CosmiCLab SMC STABLE Smart Market Structure (BOS / CHoCH) for MetaTrader 5 CosmiCLab SMC STABLE is a professional Smart Money Concept–based market structure indicator for MetaTrader 5. The indicator automatically detects: • Swing High / Swing Low levels • Break of Structure (BOS) • Change of Character (CHoCH) • Bullish and Bearish structural shifts Designed for traders who prefer clear structure visualization without chart clutter or repainting. How It Works The indicator identifies confirmed
      Trade Sniper のご紹介: 市場で優位に立つ。 MT4 バージョン: https://www.mql5.com/en/market/product/122371 収益性の高い取引を逃したり、市場の間違った側に捕まったりすることにうんざりしていませんか? トレンドの力を活用して取引で鋭い優位性をもたらす最先端のインジケーター、Trade Sniper をご紹介します。 Trend Sniper は、ありふれたインジケーターではありません。高度なアルゴリズムと実績のある取引原則を組み合わせた洗練されたツールで、驚異的な精度で高確率の取引機会を見つけることができます。 Trade Sniper が市場での秘密兵器となる理由は次のとおりです: 強化されたトレンド検出: 当社独自の AIgo は、複数の市場要因をリアルタイムで分析し、従来のインジケーターをはるかに超える精度でトレンドを特定します。 非常に明確なシグナル: 混乱を招くチャートの乱雑さに別れを告げましょう。 Trade Sniper は、チャート上で明確で実用的な売買シグナルを提供します。 スマートなリスク管
      Caicai L&S Yield Histogram Important Notice: This indicator is an integral tool of the automated EA Caicai Long and Short Pair Trading . This indicator visually displays the percentage deviation (Yield %) of a pair's current spread relative to its own historical mean. It is an excellent tool for quickly visualizing the gross financial potential of a market distortion in Long & Short operations. Main Features: Percentage Visualization: Understand the size of the distortion in palpable percentage
      Contact me after payment to send you the user manual PDF file. Download the MT4 version here. Unlocking Trading Insights Dive into the heart of market dynamics with Advance Divergence Scanner designed for traders seeking a competitive edge. The Divergence Indicator is your key to identifying crucial divergences across various charts, empowering you to make informed decisions in the dynamic world of financial markets. The Divergence A Divergence signals a potential reversal point because directi
      このプロダクトを購入した人は以下も購入しています
      SuperScalp Pro
      Van Minh Nguyen
      4.59 (22)
      SuperScalp Pro – 高度なマルチフィルタースキャルピングインジケーターシステム SuperScalp Pro は、クラシックな Supertrend と複数のインテリジェント確認フィルターを組み合わせた高度なスキャルピングインジケーターです。M1 から H4 まで複数の時間足で効率的に動作し、XAUUSD、BTCUSD、主要 Forex 通貨ペア向けに最適化されています。 このインジケーターは明確な Buy / Sell シグナルを提供し、ATR に基づいてエントリー価格、Stop Loss、Take Profit を自動計算します。Fibonacci Take Profit 機能により、重要な価格帯で早期決済し、到達時に通知を送信します。 初期設定では Fibonacci Take Profit が有効化されており、より安定した取引体験を重視しています。チャートに適用するだけですぐ利用可能です。上級者向けに、すべてのパラメータは自由にカスタマイズできます。 EMA、RSI、ADX、Volume、VWAP、Bollinger Bands、MACD Divergence な
      Entry In The Zone and SMC Multi Timeframe is a real-time 2-in-1 market analysis tool that combines market structure analysis and a No Repaint BUY / SELL signal system into a single indicator, built on Smart Money Concepts (SMC) — a widely adopted framework used by professional traders to understand market structure. This indicator helps you see the market more clearly, make decisions based on structure rather than guesswork, and focus on high-probability zones where price is more likely to react
      このインジケーターを購入された方には、以下の特典を 無料 で提供しています: 各トレードを自動で管理し、ストップロスとテイクプロフィットを設定し、戦略ルールに基づいてポジションを決済する補助ツール 「Bomber Utility」 様々な銘柄に合わせたインジケーターの設定ファイル(セットファイル) 「最小リスク」、「バランスリスク」、「待機戦略」 の3つのモードで使用できる Bomber Utility 用の設定ファイル このトレーディング戦略をすぐに導入・設定・開始できる ステップバイステップのビデオマニュアル ご注意: 上記の特典を受け取るには、MQL5のプライベートメッセージシステムを通じて販売者にご連絡ください。 オリジナルのカスタムインジケーター 「Divergence Bomber(ダイバージェンス・ボンバー)」 をご紹介します。これは、MACDのダイバージェンス(乖離)戦略に基づいた 「オールインワン」型のトレーディングシステム です。 このテクニカルインジケーターの主な目的は、価格とMACDインジケーターの間に発生するダイバージェンスを検出 し、将来の価格の動きを示す
      Power Candles V3 - 自己最適化型強弱インジケーター Power Candles V3は 、通貨や銘柄の強さを、適用されたすべてのチャート上で実行可能なトレードプランに変換します。単にローソク足を色分けするだけでなく、バックグラウンドでリアルタイムの自動最適化を実行し、目の前の銘柄に対して最適なストップロス、テイクプロフィット、およびシグナルの閾値を提示します。ワンクリックで実取引に適用でき、エントリーポイント、ストップロス、テイクプロフィットのラインが正確な価格位置にチャート上に表示され、方向性を示すアラートがリアルタイムで発動します。 このツールは、Stein Investmentsのエコシステムの一部です。  18種類以上のツールをすべて閲覧し、AIを活用したセットアップの推奨事項を入手し、  https://stein.investments でコミュニティに参加しましょう クローズしたバーごとに3,000回以上のトレードシミュレーション。9つの強さの状態。2つの戦略を並行してテスト。勝率の高い設定をワンクリックで適用。 なぜこれが必要なのか ほとんどの強
      優れたテクニカルインジケーター「Grabber」をご紹介します。これは、すぐに使える「オールインワン」トレーディング戦略として機能します。 ひとつのコードに、市場のテクニカル分析ツール、取引シグナル(矢印)、アラート機能、プッシュ通知が強力に統合されています。 このインジケーターを購入された方には、以下の特典を無料で提供します: Grabberユーティリティ:オープンポジションを自動で管理するツール ステップバイステップのビデオマニュアル:インジケーターのインストール、設定、取引方法を解説 カスタムセットファイル:インジケーターをすばやく自動設定し、最大限の成果を出すための設定ファイル 他の戦略はもう忘れてください!Grabberだけが、あなたを新たなトレードの高みへと導いてくれるのです。 Grabber戦略の主な特徴: 推奨タイムフレーム:M5〜H4 対応通貨ペア・資産:どれでも使用可能ですが、私が実際に検証した以下を推奨します(GBPUSD、GBPCAD、GBPCHF、AUDCAD、AUDUSD、AUDSGD、AUDCHF、NZDUSD、NZDCAD、EURCAD、EURUSD、E
      SignalTech MT5 is a trading system for EURUSD, USDCHF, USDJPY, AUDUSD, NZDUSD, EURJPY, AUDJPY, NZDJPY, CADJPY H2 and H3 Timeframe.  It can generate signals with Buy/Sell Arrows and Pop-Up/Sound Alerts. Each signal has clear Entry and Stop Loss levels, which should be automatically flagged on the chart, as well as potential Targets 1, 2, and 3. The Entry and TP levels are fixed after the trade is taken. The exit level is dynamic. If there are signs of a potential short-term trend reversal, the
      このインジケーターを購入すると、プロ仕様のトレードマネージャーを無料で差し上げます。 まず第一に、このトレーディングシステムがノンリペイント、ノンリドロー、ノンラグのインジケーターであることを強調する価値がある。これにより、手動取引とロボット取引の両方に理想的なものになっています。 オンラインコース、マニュアル、プリセットのダウンロード。 「スマートトレンドトレーディングシステム MT5」は、新規および経験豊富なトレーダー向けにカスタマイズされた包括的なトレーディングソリューションです。10以上のプレミアムインジケーターを組み合わせ、7つ以上の堅実なトレーディング戦略を備えており、多様な市場状況に対応する多目的な選択肢となっています。 トレンドフォロー戦略:トレンドを効果的に乗り越えるための正確なエントリーとストップロス管理を提供します。 リバーサル戦略:潜在的なトレンドの反転を特定し、トレーダーがレンジ相場を活用できるようにします。 スキャルピング戦略:高速で正確なデイトレードおよび短期取引のために設計されています。 安定性:すべてのインジケーターはノンリペイント、ノンリドロー、ノ
      Gann Made Easy   は、ミスター・ギャンの理論を使用した取引の最良の原則に基づいた、プロフェッショナルで使いやすい外国為替取引システムです。 W・D・ガン。このインジケーターは、ストップロスとテイクプロフィットレベルを含む正確な買いと売りのシグナルを提供します。 PUSH通知を利用して外出先でも取引可能です。 ご購入後、取引方法の説明と優れた追加インジケーターを無料で入手するには、私にご連絡ください! おそらく、ギャンの取引手法についてはすでに何度も聞いたことがあるでしょう。通常、ギャンの理論は初心者のトレーダーだけでなく、すでにある程度の取引経験がある人にとっても非常に複雑なものです。なぜなら、ギャンの取引手法は理論的にはそれほど簡単に適用できるものではないからです。私はその知識を磨き、最良の原則を私の外国為替インジケーターに組み込むために数年を費やしました。 このインジケーターは非常に簡単に適用できます。必要なのは、それをチャートに添付し、簡単な取引推奨事項に従うだけです。このインジケーターは常に市場分析の仕事を行い、取引の機会を探します。適切なエントリーポイントを検
      BTMM State Engine Pro is a MetaTrader 5 indicator for traders who use the Beat The Market Maker approach: Asian session context, kill zone timing, level progression, peak formation detection, and a multi-pair scanner from a single chart. It combines cycle state logic with a built-in scanner dashboard so you do not need the same tool on many charts at once. What it does Draws the Asian session range; session times can follow broker server offset or be set in inputs. Tracks level progression (L
      FX Trend NG:次世代マルチマーケット・トレンドインテリジェンス 概要 FX Trend NG は、複数の時間足に対応したプロフェッショナル向けトレンド分析およびマーケット監視ツールです。 市場全体の構造を数秒で把握することができます。 複数のチャートを切り替える必要はありません。どの銘柄がトレンド中なのか、どこでモメンタムが弱まっているのか、そしてどの時間足で強い整合性があるのかを瞬時に確認できます。 ローンチ特別オファー – FX Trend NG を $30(6ヶ月) または $80 永久ライセンス でご利用いただけます。 すでに Stein Investments のユーザーですか? -> メッセージを送信 して、プライベートグループへアクセスしてください。 セットアップや詳細情報が必要ですか? -> Stein Investments 公式ページ をご覧ください。 1. FX Trend NG が他と異なる理由 3ステート・トレンドロジック ― Buy と Sell だけではない • 多くのインジケーターは Buy または Sell の2状態のみを表示します。
      ご紹介     Quantum Breakout PRO は 、ブレイクアウト ゾーンの取引方法を変革する画期的な MQL5 インジケーターです。 13年以上の取引経験を持つ経験豊富なトレーダーのチームによって開発されました。     クォンタム ブレイクアウト プロ   は、革新的でダイナミックなブレイクアウト ゾーン戦略により、あなたのトレーディングの旅を新たな高みに押し上げるように設計されています。 クォンタム ブレイクアウト インジケーターは、5 つの利益ターゲット ゾーンを備えたブレイクアウト ゾーン上のシグナル矢印と、ブレイクアウト ボックスに基づいたストップロスの提案を提供します。 初心者トレーダーにもプロのトレーダーにも適しています。 量子EAチャネル:       ここをクリック 重要!購入後、インストールマニュアルを受け取るためにプライベートメッセージを送ってください。 推奨事項: 時間枠: M15 通貨ペア: GBPJPY、EURJPY、USDJPY、NZDUSD、XAUUSD アカウントの種類: ECN、Raw、またはスプレッドが非常に低い R
      Quantum TrendPulse を ご紹介します。これは、   SuperTrend   、   RSI   、および Stochastic のパワーを 1 つの包括的なインジケーターに組み合わせて、取引の可能性を最大限に引き出す究極の取引ツールです。精度と効率を求めるトレーダー向けに設計されたこのインジケーターは、市場のトレンド、勢いの変化、最適なエントリー ポイントとエグジット ポイントを自信を持って特定するのに役立ちます。 主な特徴: SuperTrend 統合: 現在の市場動向に簡単に追従し、収益性の波に乗ることができます。 RSI精度: 買われすぎと売られすぎのレベルを検出し、市場の反転のタイミングに最適で、SuperTrendのフィルターとして使用されます。 確率的精度: 確率的振動を活用して、変動の激しい市場で隠れたチャンスを見つけます。SuperTrend のフィルターとして使用されます。 マルチタイムフレーム分析:   M5 から H1 または H4 まで、さまざまなタイムフレームで市場を常に把握します。 カスタマイズ可能なアラート: カスタム取引条件が満たされ
      これはMT5のインジケーターで、再描画なしで取引に参入するための正確なシグナルを提供します。 外国為替、暗号通貨、金属、株式、インデックスなど、あらゆる金融資産に適用できます。かなり正確な見積もりを提供し、取引を開始して終了するのに最適な時期を教えてくれます。1つのシグナルを処理しただけでインジケーターの元が取れた例の 動画 (6:22)をご覧ください。Entry PointsPro インジケーターの助けを借りたほとんどのトレーダーの最初の1週間の結果が改善しています。 Telegramグループ に登録してください。Entry Points Proインジケーターのメリットは次の通りです。 再描画のないエントリーシグナル 再描画されるインジケーターでは一度表示されたシグナルが削除されて大きな金銭的損失につながることがありますが、これと異なり、表示されて確認されたシグナルは消えることがありません。 エラーなしの取引開始 インジケーターアルゴリズムによって取引を開始する(資産を売買する)理想的な瞬間を見つけることができます。それを使用するすべてのトレーダーの成功率が向上します。 あら
      まず第一に、この取引インジケーターは再描画されず、再描画されず、遅延しないことを強調する価値があります。これにより、手動取引とロボット取引の両方に理想的なものになります。 ユーザーマニュアル:設定、入力、戦略。 アトミックアナリストは、価格の強さとモメンタムを利用して市場でより良いエッジを見つけるためのPA価格アクションインジケーターです。ノイズや誤ったシグナルを除去し、取引ポテンシャルを高めるための高度なフィルターを備えています。複雑なインジケーターの複数のレイヤーを使用して、アトミックアナリストはチャートをスキャンし、複雑な数学的計算をシンプルなシグナルと色に変換します。これにより、どのような初心者トレーダーでも理解して使用し、一貫した取引の決定を行うことができます。 「アトミックアナリスト」は、新規および経験豊富なトレーダー向けにカスタマイズされた包括的な取引ソリューションです。プレミアムインジケーターとトップノッチの機能を1つの取引戦略に組み合わせ、すべてのタイプのトレーダーにとって汎用性のある選択肢にします。 デイリートレーディングとスキャルピング戦略:高速で正確なデイ
      トレンド スクリーナー インジケーターでトレンド取引の力を解き放ちます。ファジー ロジックと複数通貨システムを活用した究極のトレンド取引ソリューションです。 ファジー ロジックを活用した革新的なトレンド インジケーターである Trend Screener を使用して、トレンド取引を向上させます。 これは、13 を超えるプレミアム ツールと機能、および 3 つの取引戦略を組み合わせた強力なトレンド追跡インジケーターであり、Metatrader をトレンド アナライザーにする多用途の選択肢となります。 期間限定オファー : トレンド スクリーナー インジケーターは、わずか 65 ドルで生涯ご利用いただけます。 (元の価格 50$ ) (オファー延長) Trend Screener の 100% 非再描画精度の揺るぎない精度を体験して、取引の決定が過去の価格変動の影響を受けないようにしてください。 マルチタイムフレームおよびマルチ通貨機能の多用途性を解放し、比類のない自信を持って外国為替、商品、暗号通貨、インデックスの世界を取引できるようにします。 Trend Screener の包括的な戦
      OmniSync Projection
      Antonio-alin Teculescu
      5 (1)
      Chronos Fractal Engine is an innovative price projection indicator for MetaTrader 5, designed to transform your technical analysis by intelligently identifying and projecting historical price patterns. Built upon an advanced correlation algorithm and the fractal principles of the market, this powerful tool visualizes potential future price movements, giving you a unique edge in your trading decisions. What is Chronos Fractal Engine? At its core, the Chronos Fractal Engine employs a sophisticat
      このダッシュボードは、選択されたシンボルの最新の利用可能なハーモニックパターンを表示するので、時間を節約し、より効率的に /   MT4バージョン 。 無料インジケーター:   Basic Harmonic Pattern インジケーター列 Symbol : 選択したシンボルが表示されます。 Trend :   強気または弱気 Pattern : パターンの種類(ガートレー、バタフライ、バット、カニ、サメ、サイファー、ABCD) Entry : エントリー価格 SL: ストップロス価格 TP1: 1回目の利食い価格 TP2: 2回目の利食い価格 TP3:   3回目の利食い価格 Current price :   現在値 Age (in bars):    最後に描画されたパターンの年齢 主な入力項目 Symbols:   "28 Major Currency Pairs "または "Selected Symbols "から選択。 Selected Symbols:   カンマで区切られた監視したいシンボル("EURUSD,GBPUSD,XAUUSD")。ブローカーがペアに接
      Azimuth Pro
      Ottaviano De Cicco
      5 (7)
      Azimuth Pro V2:MT5向けシンセティック・フラクタル構造分析と確認済みエントリー 概要 Azimuth Pro は Merkava Labs によるマルチレベルスイング構造インジケーターです。4つのネストされたスイングレイヤー、スイングアンカーVWAP、ABCパターン検出、3タイムフレーム構造フィルタリング、そして確定バーでの確認済みエントリー — 1つのチャートで、ミクロスイングからマクロサイクルまでを網羅するワークフロー。 これはブラインドシグナル製品ではありません。ロケーション、コンテキスト、タイミングを重視するトレーダーのための構造ファーストワークフローです。 V2発売記念オファー — Azimuth Pro V2をUSD 399で(次の100本)。最終価格:USD 499。 1. V2での変更点 シンセティック・マルチタイムフレームエンジン 上位タイムフレーム分析をMeridian Proと同じ独自のシンセティックアーキテクチャで一から再構築。よりクリーンなHTFコンテキスト、安定したライブ動作、従来のMTF同期問題なし。シンセティックエンジンは 固定比率タ
      FX Levels: あらゆる市場における非常に高精度なサポート&レジスタンス 概要 通貨ペア、株式指数、個別銘柄やコモディティなど、どのような市場でも信頼できるサポートとレジスタンスを特定したいですか? FX Levels は伝統的な “Lighthouse” メソッドと先進的な動的アプローチを融合し、ほぼ汎用的な精度を実現します。ブローカーの実務経験を活かし、自動化されたデイリー更新とリアルタイム更新を組み合わせることで、 FX Levels は反転ポイントを見つけ、利益目標を設定し、自信をもってトレードを管理するための手助けをします。今すぐ試してみて、サポート/レジスタンス分析の正確性がどれほどトレードを向上させるかを実感してください! 1. FX Levels がトレーダーにとって非常に有用な理由 非常に正確なサポート&レジスタンスゾーン • FX Levels は異なるブローカー環境でもほぼ同一のゾーンを生成するよう設計されており、データフィードの差異や時刻設定のずれによる不一致を解消します。 • つまり、どのブローカーを利用していても一貫したレベルが得られるため、戦
      まず第一に、この取引ツールはノンリペイント、ノンリドロー、ノンラグの指標であり、プロの取引に理想的ですことを強調する価値があります。 オンラインコース、ユーザーマニュアル、デモ。 スマートプライスアクションコンセプトインジケーターは、新米から経験豊富なトレーダーまで、非常 に強力なツールです。Inner Circle Trader AnalysisやSmart Money Concepts Trading Strategiesなど、20以上の有用な指標を1つに組み合わせています。このインジケーターはスマートマネーコンセプトに焦点を当て、大手機関の取引方法を提供し、彼らの動きを予測するのに役立ちます。 特に、流動性分析に優れており、機関がどのように取引しているかを理解しやすくしています。市場のトレンドを予測し、価格の動きを慎重に分析するのに優れています。機関の戦略とトレードを合わせることで、市場の動向についてより正確な予測ができます。このインジケーターは多目的であり、市場構造を分析し、重要な注文ブロックを特定し、さまざまなパターンを認識するのに優れています。 このインジケーター
      RelicusRoad Pro: 定量的市場オペレーティングシステム 【期間限定】無制限アクセス 70% OFF - 2,000人超のトレーダーと共に なぜ多くのトレーダーは「完璧な」インジケーターを使っても失敗するのでしょうか? それは、文脈を無視して 単一の概念 だけでトレードしているからです。文脈のないシグナルは単なるギャンブルです。勝ち続けるには、 根拠の重なり(コンフルエンス) が必要です。 RelicusRoad Proは単なる矢印インジケーターではありません。完全な 定量的市場エコシステム です。独自のボラティリティモデリングを用いて、価格が推移する「適正価値の道(Fair Value Road)」をマッピングし、ノイズと真の構造的ブレイクを判別します。 推測はやめましょう。機関投資家レベルの「ロード・ロジック」でトレードを。 コアエンジン:「Road」アルゴリズム システムの中心となる Road Algo は、市場環境にリアルタイムで適応するダイナミックなボラティリティチャネルです。 安全ライン(平衡点) と、価格が数学的に反転しやすい 拡張レベル を投影します。 Si
      Trend Ai indicatorは、トレンドの識別と実用的なエントリポイントと反転アラートを組み合わせることで、トレーダーの市場分析を強化する優れたツールです。 この指標は、ユーザーが自信と正確さで外国為替市場の複雑さをナビゲートすることを可能にします トレンドAiインジケーターは、主要なシグナル以外にも、プルバックやリトレースメント中に発生するセカンダリエントリポイントを識別し、トレーダーが確立されたトレンド内の価格修正を活用できるようにします。 重要な利点: *MT4およびMT5の仕事 *明確な買いまたは売りシグナル *再描画しません ·すべての資産で動作します 私はeaやセットをtelegram it詐欺で販売しないように注意してください。 すべての設定はここでブログで無料です。  重要! 指示とボーナスを得るために購入後すぐに私に連絡してください! 私の他のプロダクトと同様、実質操作の監視はここに見つけることができます: https://www.mql5.com/en/users/mechanic/seller&nbsp ; 設定および入力: すべての
      まず正直に言いましょう。 どんなインジケーターも、それ単体であなたを利益化させることはできません。もしそう言う人がいるなら、それは夢を売っているだけです。完璧な売買シグナル(矢印)を表示するインジケーターは、いくらでも“完璧に見せる”ことができます。正しい過去の区間を拡大して、勝ちトレードだけを切り取ればいいだけです。私たちはそれをしません。 SMC Intraday Formula はツールです。 市場構造を読み取り、最も高い確率の価格ゾーンを特定し、今この瞬間のスマートマネーの痕跡をシンプルな言葉で正確に示します。最終判断はあなたが行います。トレードを実行するのもあなたです。しかし今は「希望」ではなく「精度」でエントリーできます。 私たちはこのインジケーターを、ゴールド(XAUUSD)および主要FX通貨ペアで約3年間、日々のスキャルピングに使用してきました。M1、M5、M15、M30の主要ツールです。これは未来を予測しようとするのではなく、今まさに形成されている高確率セットアップを示し、その理由を説明します。 他のすべてのインジケーターと何が違うのか? ほとんどのトレーディングイ
      Crystal Heikin Ashi Signals - Professional Trend & Signal Detection Indicator Advanced Heikin Ashi Visualization with Intelligent Signal System for Manual & Automated Trading Final Price: $149 ---------> Price goes up $10 after every 10 sales . Limited slots available — act fast . Overview Crystal Heikin Ashi Signals is a professional-grade MetaTrader 5 indicator that combines pure Heikin Ashi candle visualization with an advanced momentum-shift detection system. Designed for both manual traders
      ARICoin is a powerful trading companion designed to generate high-probability entry signals with dynamic TP/SL/DP levels based on volatility. Built-in performance tracking shows win/loss stats, PP1/PP2 hits, and success rates all updated live. Key Features: Buy/Sell signals with adaptive volatility bands Real-time TP/SL/DP levels based on ATR Built-in MA Filter with optional ATR/StdDev volatility Performance stats panel (Success, Profit/Loss, PP1/PP2) Alerts via popup, sound, push, or email Cust
      Market Structure Order Block Dashboard MT5 は、市場構造と主要な価格反応ゾーンをチャート上で直接読み取りたいトレーダー向けに設計された MT5 インジケーターです。BOS、ChoCH、オーダーブロック、Fair Value Gap (FVG)、流動性、Kill Zones、Volume Profile、そして素早い分析のためのコンパクトなダッシュボードを組み合わせています。 本インジケーターは、市場構造、ICT、Smart Money の概念を意思決定の枠組みとして使用するトレーダーを対象としています。トレンド継続、反転の可能性、価格の不均衡、流動性ターゲット、注目ゾーンをより構造的に特定する助けとなります。 購入者向けの付属リソース 購入後、MQL5 のプライベートメッセージにてご依頼いただくと、完全な PDF ユーザーガイドとパラメータ設定のヒントを提供いたします。MQL5 のプライベートメッセージによる直接的な技術サポート。 バージョン 1.20 では 2 つの重要な追加機能があります: Pending BOS / Pending Cho
      Smart Stop Indicator – チャート上で実現するインテリジェントなストップロス精度 概要 Smart Stop Indicator は、ストップロスを勘や感情ではなく、明確で体系的に設定したいトレーダーのために設計されています。本ツールは、クラシックなプライスアクション(高値更新・安値切り下げ)と最新のブレイクアウト認識ロジックを組み合わせ、次に来るべき論理的なストップレベルを正確に特定します。トレンド相場、レンジ、急速なブレイクアウト局面のいずれであっても、最適な SL ゾーンとその状態(“new”、“broken”、“valid”)をチャート上に直接表示します。さらに今回、SL 距離の %ADR 表示も新たに追加されています。 主な特徴 マーケット構造に基づく自動ストップ配置 • 市場構造とリアルタイムの値動きに基づき、意味のあるストップロスレベルを自動検出します。 スマートなブレイクアウト感知 • 急激な方向転換やブレイクアウトにも柔軟に対応し、早すぎるストップ調整を避けます。 SL %ADR の表示 • ストップロスまでの距離を ADR(Averag
      Meridian Pro
      Ottaviano De Cicco
      5 (1)
      Meridian Pro 2.00:MT5向けプロ仕様マルチタイムフレーム・トレンドマトリクス Meridian Pro 2.00 は、MetaTrader 5 向けのプロ仕様の適応型トレンドマトリクスです。オリジナルの Meridian トレンドエンジン、クリーンなチャート ribbon、確定足ベースのシグナル矢印、8時間足 dashboard、Fuel momentum、weighted consensus、synthetic HTF processing、そしてチャート上に直接表示される上位足コンテキストラインを統合します。 目的はシンプルです。現在のトレンド、マルチタイムフレーム構造、強度、momentum、EA-ready 状態を、複数チャートに無関係なインジケータを重ねるのではなく、1つの整理された workflow で読むことです。 Meridian Pro の違い 1つの適応型エンジン - 同じ volatility-aware Meridian ロジックを M1 から W1 まで適用します。 Synthetic HTF architecture - 上位足行は下位足デ
      Bill Williams Advanced is designed for automatic chart analysis using Bill Williams' "Profitunity" system. The indicator analyzes four timeframes at once. Manual (Be sure to read before purchasing) Advantages 1. Analyzes the chart using Bill Williams' "Profitunity" system. Signals are displayed in a table in the corner of the screen and on the price chart. 2. Finds all known AO and AC signals, as well as zone signals. Equipped with a trend filter based on the Alligator. 3. Finds "Divergence Bar
      FX Power: 通貨の強弱を分析して、より賢い取引を実現 概要 FX Power は主要通貨と金の実際の強弱をあらゆる市場状況で理解するための必須ツールです。強い通貨を買い、弱い通貨を売ることで、 FX Power は取引の意思決定を簡素化し、高い確率の取引機会を見出します。トレンドを追従する場合でも、極端なデルタ値を使用して反転を予測する場合でも、このツールはあなたの取引スタイルに完全に適応します。ただ取引するだけではなく、 FX Power で賢く取引をしましょう。 1. なぜ FX Power がトレーダーにとって非常に有益なのか 通貨と金のリアルタイム強弱分析 • FX Power は主要通貨と金の相対的な強弱を計算し、マーケットダイナミクスに関する明確な洞察を提供します。 • どの資産がリードしているか、または後れを取っているかを監視して、取引するペアを賢く選びましょう。 マルチタイムフレームの包括的なビュー • 短期、中期、長期のタイムフレームで通貨と金の強弱を追跡し、マーケットトレンドに基づいて取引戦略を調整できます。 • スキャルピングからスイングトレード
      作者のその他のプロダクト
      Multi-Indicator Trend Engine with Weighted Consensus Five professional trend indicators fused into one signal. Configurable weighting. Three aggregation modes. One regime per bar. The Aurora Trend Suite combines five independent trend-detection methods into a single, unified directional engine. Instead of cluttering your chart with five separate indicators that constantly disagree with each other, the Suite votes them into one clean regime — so you always know exactly where the consensus stands
      The Candle Smoother is an indicator for MetaTrader 5 that helps you see price movements more calmly and clearly. It removes unnecessary "market noise" and displays the true trend more effectively. What does the "Candle Smoother Indicator" do? It smooths the classic candlestick data (Open, High, Low, Close). This filters out chaotic, hectic candles. Additionally, an EMA line (Exponential Moving Average) is calculated based on the smoothed prices. This helps you better recognize where the market
      FREE
      Let us introduce the Heikin Ashi RSI Oscillator! This indicator combines the concepts of Heikin Ashi candles with the RSI (Relative Strength Index) to produce an oscillator-like format that can be used to filter out some of the noise associated with standard RSI readings. This provides traders with a smoother representation of market conditions. Here are some articles to read more about the RSI and Heikin Ashi candles: https://www.investopedia.com/terms/r/rsi.asp https://www.investopedia.com/ter
      ApexVol Grid EA
      TECHAURORA - FZCO
      5 (1)
      ATTENTION This is NOT a normal Grid / Martingale EA. Here are the setfiles: https://mega.nz/folder/fQF0hbRR#oIvhJcOVZXGRZMLYHr9_vw ApexVol Grid EA is a fully automated trading algorithm for MetaTrader 5. It is built on a volatility-filtered grid trading system and operates using dynamic moving average channels. The EA is designed to detect optimal entry zones during stable market conditions and execute trades in both directions based on predefined grid levels. The first 5 copies are availa
      フィルタ:
      レビューなし
      レビューに返信