Monthly Levels Pro

ITALIANO – Monthly Levels Pro v1.0

L’indicatore definitivo dei livelli mensili di mercato

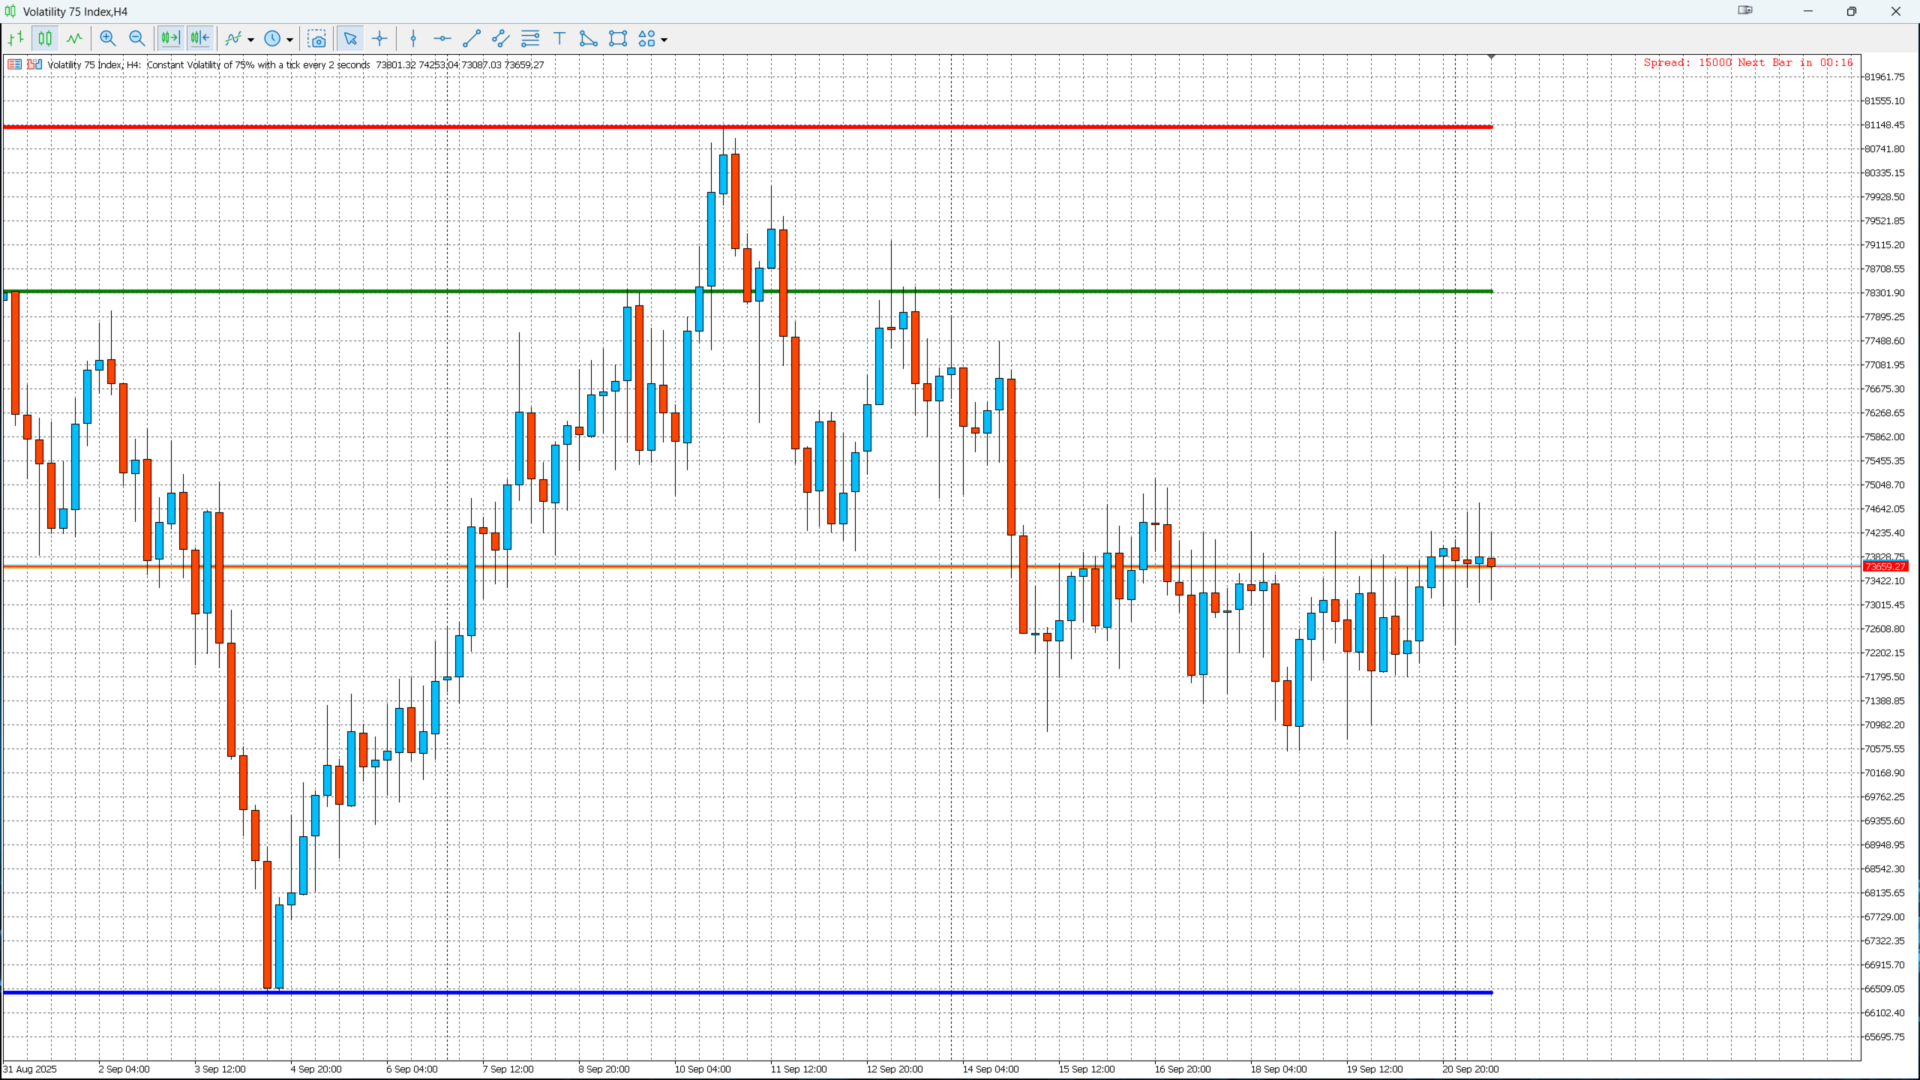
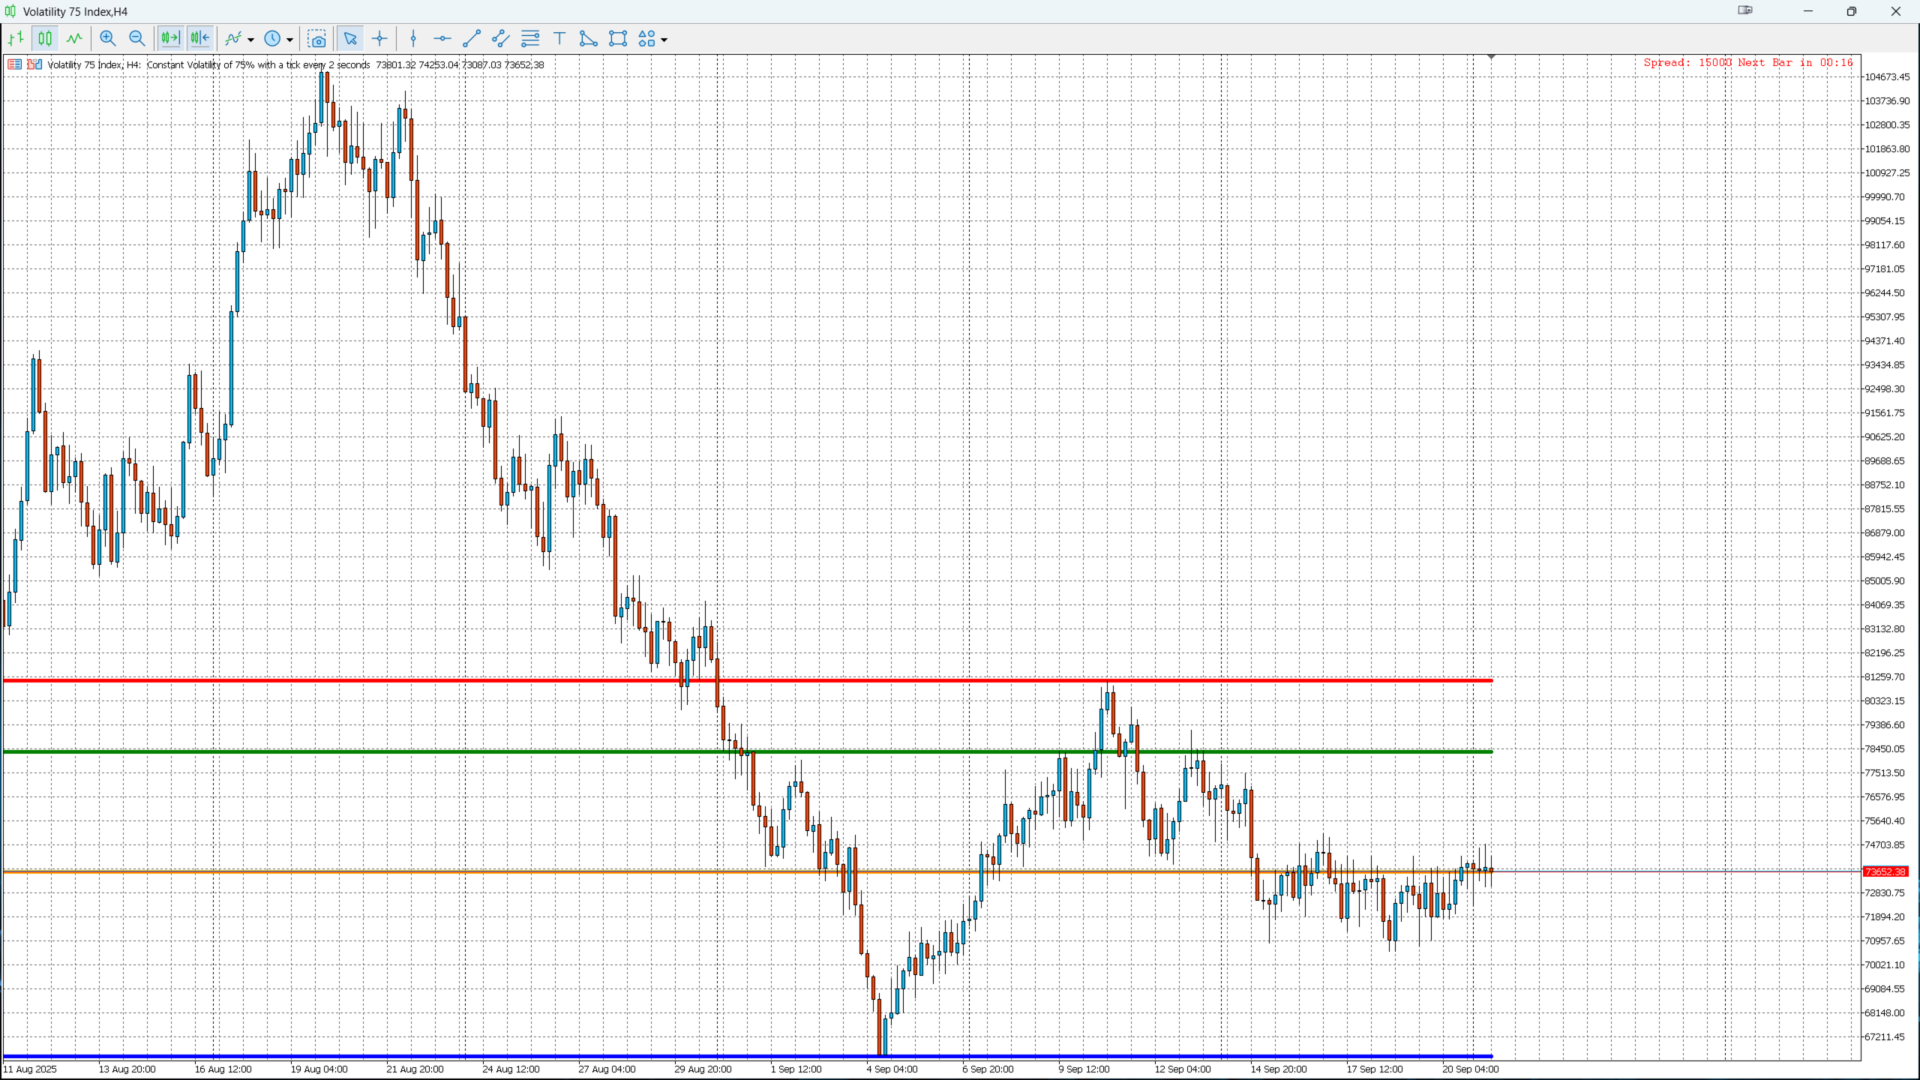
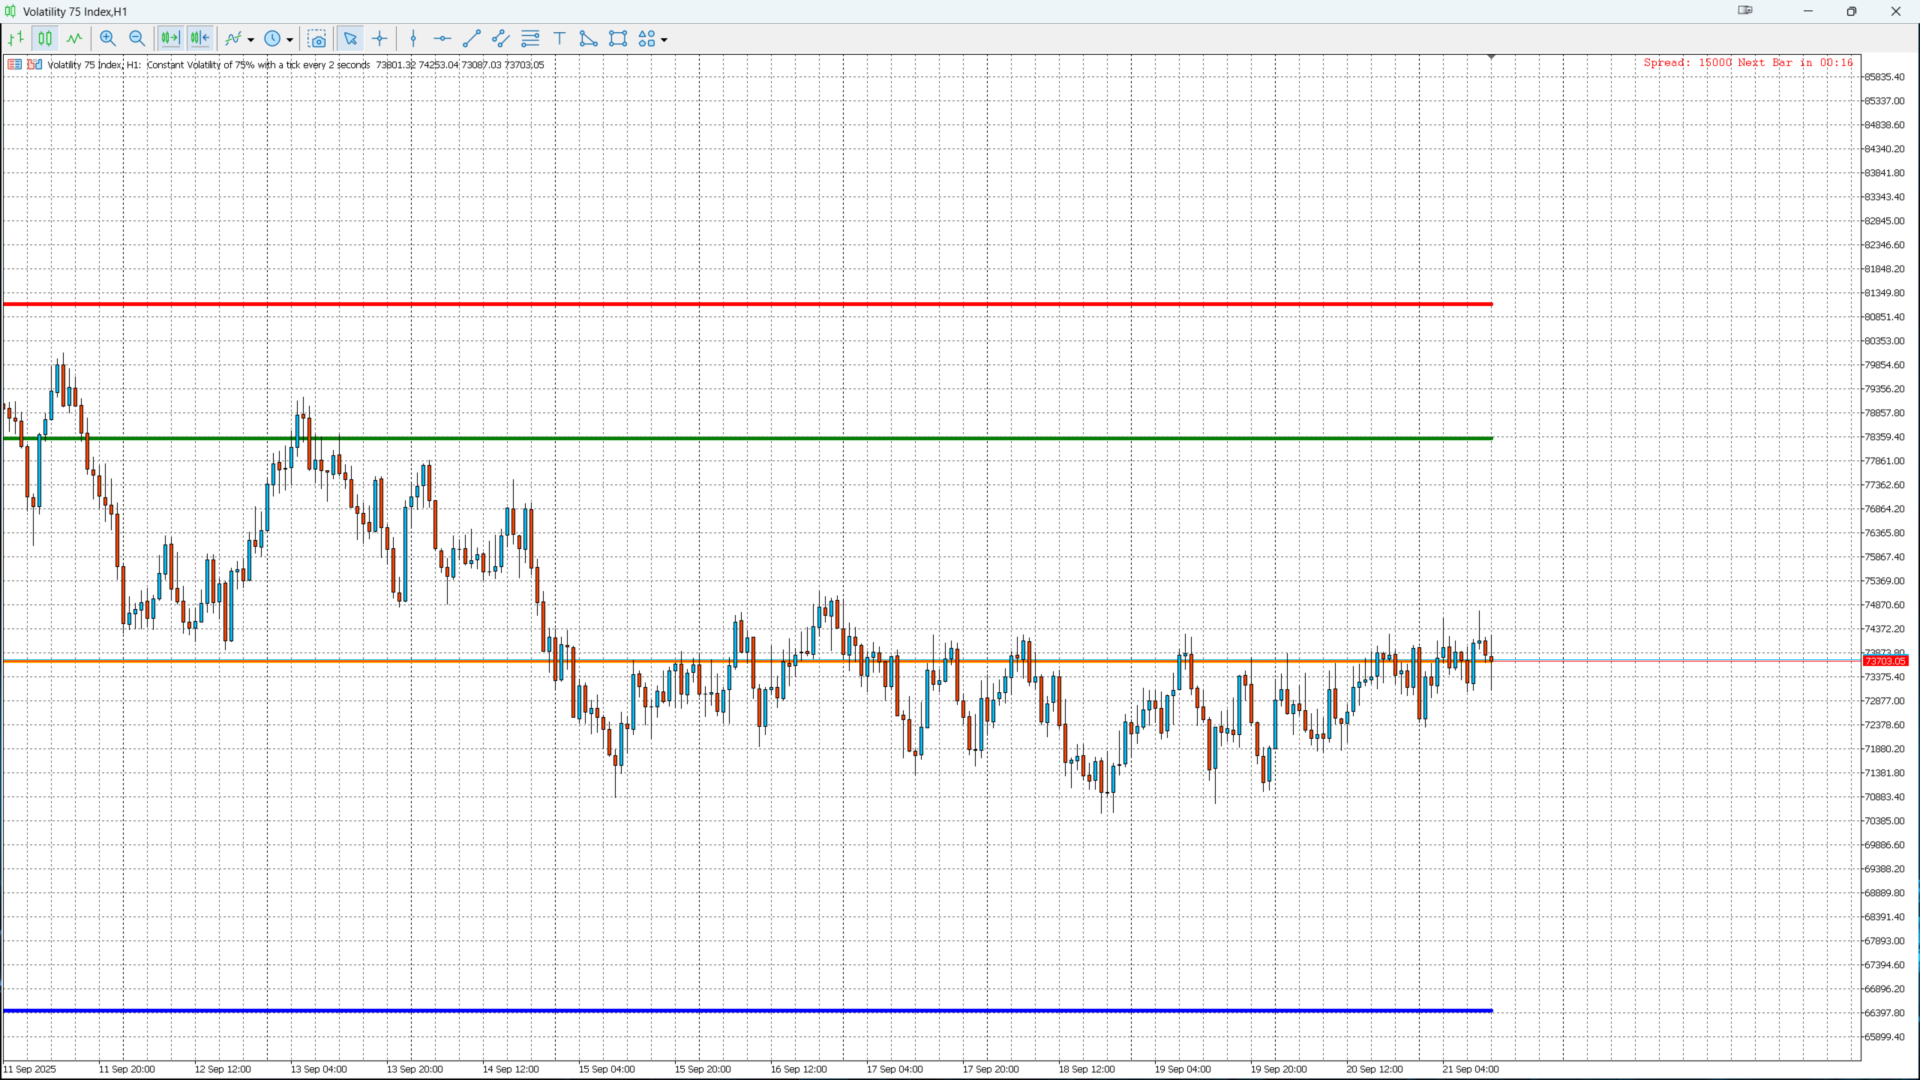
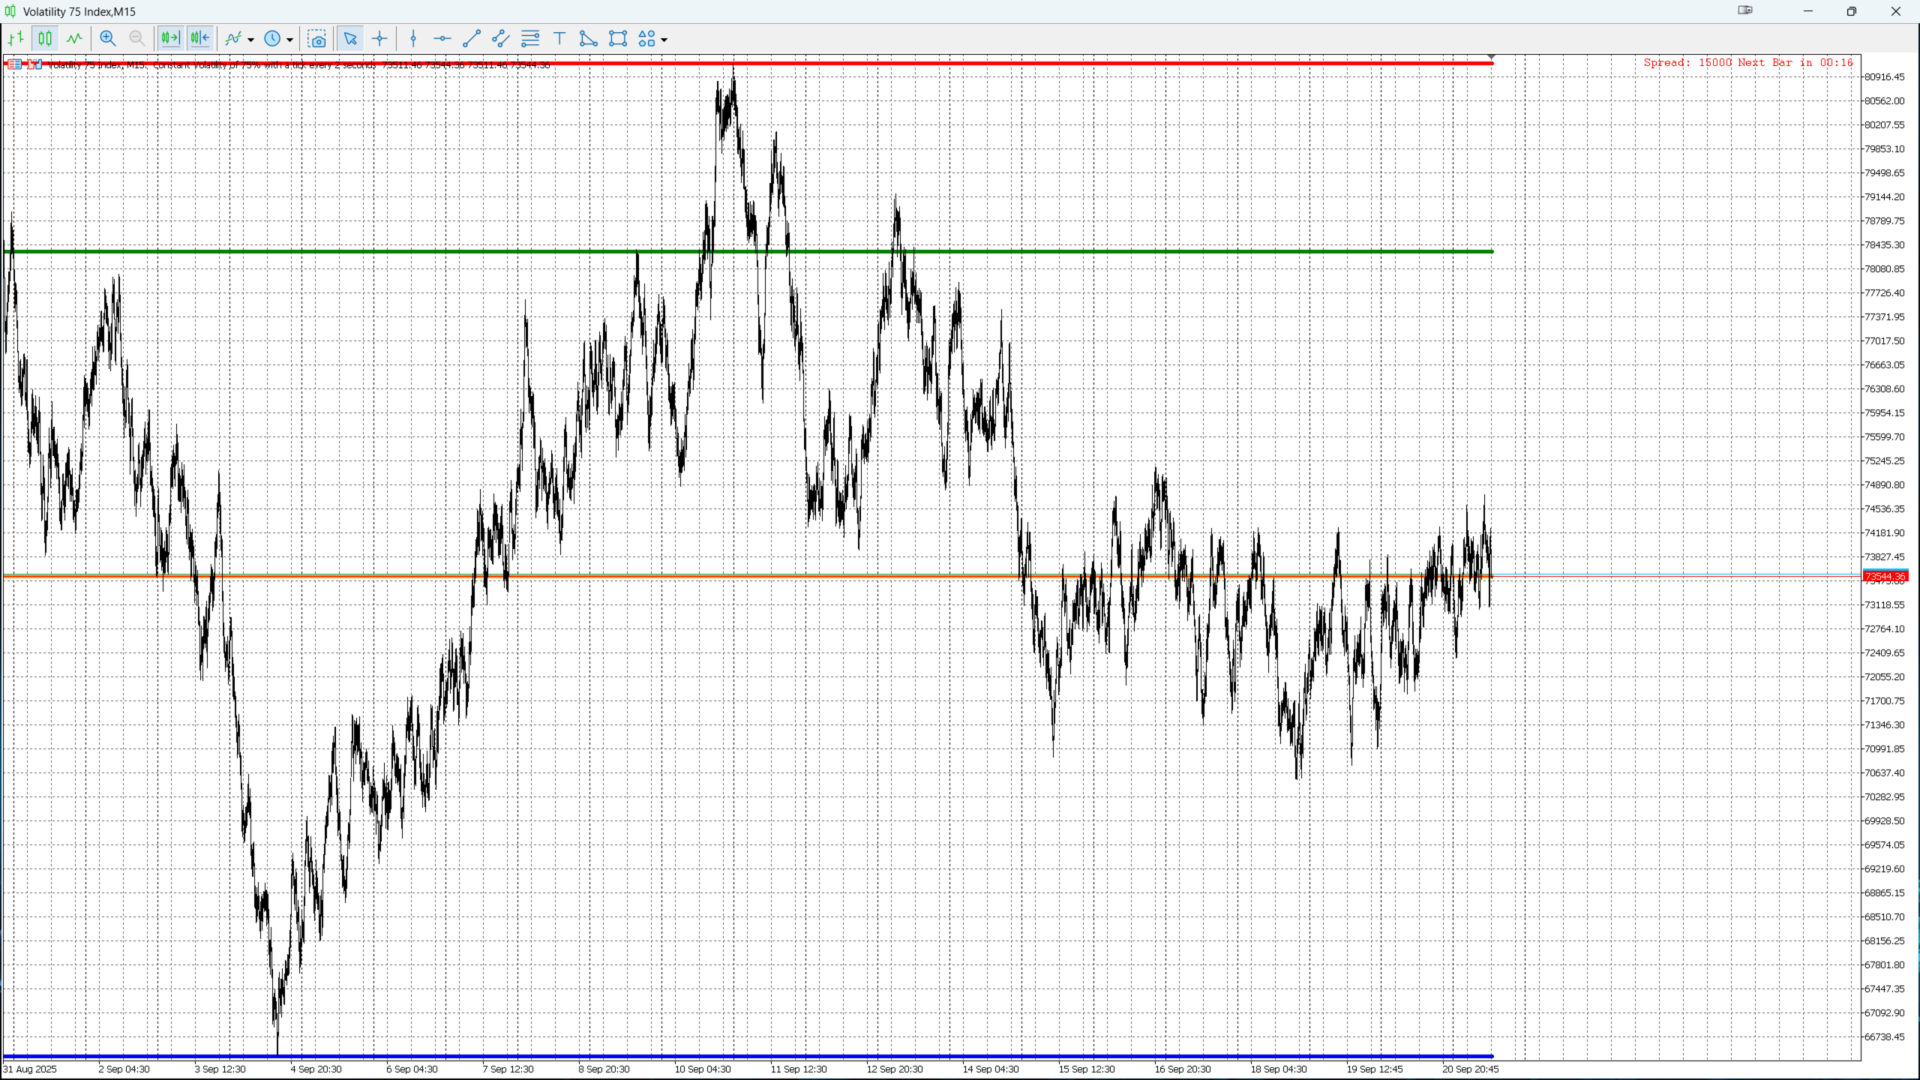
Controlla le zone chiave del mercato a colpo d’occhio. Monthly Levels Pro ti permette di analizzare le tendenze a lungo termine e individuare rapidamente supporti e resistenze mostrando automaticamente High, Low, Open e Close della candela mensile.

Vantaggi:
✅ Analisi immediata
✅ Trading più intelligente
✅ Chiarezza visiva
✅ Flessibile
✅ Semplice ed efficace

Compatibilità: MT5, tutti i timeframe


Prodotti consigliati
Owl Smart Levels MT5
Sergey Ermolov
4.03 (32)
Versione MT4  |  FAQ L' indicatore Owl Smart Levels è un sistema di trading completo all'interno dell'unico indicatore che include strumenti di analisi di mercato popolari come i frattali avanzati di Bill Williams , Valable ZigZag che costruisce la corretta struttura a onde del mercato, e i livelli di Fibonacci che segnano i livelli esatti di entrata nel mercato e luoghi per prendere profitti. Descrizione dettagliata della strategia Istruzioni per lavorare con l'indicatore Consulente-assistente
Harmonic Pattern Suite Pro Introduction Harmonic Pattern Suite Pro is an indicator designed to identify and display harmonic structures on the chart based on X-A-B-C-D sequences. Its purpose is to present pattern formations that meet geometric and proportional criteria, providing a clear visual representation directly on the chart. The indicator automates the detection process, removing the need for manual measurement of ratios and allowing the user to review the structural configuration withou
FREE
Il livello Premium è un indicatore unico con una precisione superiore all'80% delle previsioni corrette! Questo indicatore è stato testato dai migliori Specialisti di Trading per più di due mesi! L'indicatore dell'autore che non troverai da nessun'altra parte! Dagli screenshot puoi vedere di persona la precisione di questo strumento! 1 è ottimo per il trading di opzioni binarie con un tempo di scadenza di 1 candela. 2 funziona su tutte le coppie di valute, azioni, materie prime, criptovalu
Noize Absorption Index - is the manual trading system that measures the difference of pressure between bears forces and bulls forces. Green line - is a noize free index that showing curent situation. Zero value of index shows totally choppy/flat market.Values above zero level shows how powerfull bullish wave is and values below zero measures bearish forces.Up arrow appears on bearish market when it's ready to reverse, dn arrow appears on weak bullish market, as a result of reverse expectation.
STRICTLY FOR BOOM INDEX ONLY!!!!! Here I bring the Maximum Trend Arrows OT1.0 MT5 indicator. This indicator is made up of a combination of different trend indicators for entries and exits, for entries an orange arrow will paint on the chart below the current market and a red flag for closing of trades and it produces buy arrows only. When the orange arrow appears, it will appear along with it's sound to notify you. The 1H timeframe is recommended, don't use it anywhere else than on the 1H timefr
Trade smarter, not harder: Empower your trading with Harmonacci Patterns This is arguably the most complete harmonic price formation auto-recognition indicator you can find for the MetaTrader Platform. It detects 19 different patterns, takes fibonacci projections as seriously as you do, displays the Potential Reversal Zone (PRZ) and finds suitable stop-loss and take-profit levels. [ Installation Guide | Update Guide | Troubleshooting | FAQ | All Products ] It detects 19 different harmonic pri
Inverted_Chart_EA Utility Expert Advisor Inverted_Chart_EA creates and maintains a mirror-inverted chart of any symbol and timeframe. It automatically generates a custom instrument (e.g. US30_INV ) and keeps its price history updated in real time, with bars mirrored around a chosen pivot. This utility gives traders a new way to analyze the market from a different perspective by flipping the chart upside down. Why use an inverted chart? Highlight hidden patterns – price formations that look ordin
# DRAWDOWN INDICATOR V4.0 - The Essential Tool to Master Your Trading ## Transform Your Trading with a Complete Real-Time Performance Overview In the demanding world of Forex and CFD trading, **knowing your real-time performance** isn't a luxury—it's an **absolute necessity**. The **Drawdown Indicator V4.0** is much more than a simple indicator: it's your **professional dashboard** that gives you a clear, precise, and instant view of your trading account status. --- ## Why This Indicator
Pro Gold System Indicator
PEDRO JOAQUIM GONCALVES GOMES
ADVANCED FUNCTIONALITIES: Trend Score (0-100) with visual bar Intelligent signals with adjustable strength (1-10) Risk management with automatic TP/SL Audible and visual alerts Price zones with smooth filling Multi-indicator analysis (RSI, ATR, BB, EMAs) DESIGN FEATURES Modern Visual: Smooth and well-spaced lines (EMA with 2-3px width) Vibrant and professional colors (Sky Blue, Orange, Gold) Modern arrows (code 233/234) for buy/sell signals Configurable dark/light theme Adjustable transparency f
##   ONLY GOLD ##   Тiльки Золото ## **Mercaria Professional Trading Zones - Complete Guide** ## **Mercaria Professional Trading Zones - Повний посібник** ### **How Mercaria Zones Work / Як працюють зони Mercaria** **English:** Mercaria Zones is an advanced trading indicator that identifies high-probability support and resistance areas using ZigZag extremes combined with mathematical zone calculations. The indicator works on multiple timeframes simultaneously, providing a comprehensive view
Informazioni sull'indicatore Questo indicatore si basa sulle simulazioni Monte Carlo sui prezzi di chiusura di uno strumento finanziario. Per definizione, Monte Carlo è una tecnica statistica utilizzata per modellare la probabilità di diversi risultati in un processo che coinvolge numeri casuali basati su risultati osservati in precedenza. Come funziona? Questo indicatore genera diversi scenari di prezzo per un titolo modellando i cambiamenti di prezzo casuali nel tempo sulla base dei dati stor
The   Trendlines Oscillator   helps traders identify trends and momentum based on the normalized distances between the current price and the most recently detected bullish and bearish trend lines. The indicator features bullish and bearish momentum, a signal line with crossings, and multiple smoothing options. USAGE The   Trendlines Oscillator   works by systematically: Identifying pivot highs and lows. Connecting pivots to form bullish (support) and bearish (resistance) trendlines. Measuring
PipFinite Trend PRO MT5
Karlo Wilson Vendiola
4.84 (556)
Breakthrough Solution For Trend Trading And Filtering With All Important Features Built Inside One Tool! Trend PRO's smart algorithm detects the trend, filters out market noise and gives entry signals with exit levels. The new features with enhanced rules for statistical calculation improved the overall performance of this indicator. Important Information Revealed Maximize the potential of Trend Pro, please visit www.mql5.com/en/blogs/post/713938 The Powerful Expert Advisor Version Automatin
PZ Support Resistance MT5
PZ TRADING SLU
3.71 (7)
Unlock key market insights with automated support and resistance lines Tired of plotting support and resistance lines? This is a multi-timeframe indicator that detects and plots supports and resistance lines in the chart with the same precision as a human eye would. As price levels are tested over time and its importance increases, the lines become thicker and darker, making price leves easy to glance and evaluate. [ Installation Guide | Update Guide | Troubleshooting | FAQ | All Products ] Boos
MercariaPattern1-2-3 відстежує рух ціни, знаходить трьоххвильові структури 1-2-3 та підсвічує момент, коли сценарій підтверджується пробоєм ключового рівня. MercariaPattern1-2-3 tracks price movement, detects three-leg 1-2-3 structures and highlights the moment when the scenario is confirmed by a key level breakout. Індикатор збирає локальні свінги в компактну фігуру 0–1–2–3 , чекає підтвердженого пробою та будує стрілку входу з готовими рівнями SL/TP. The indicator combines local swings into a
L'indicateur SMC Venom Model BPR est un outil professionnel pour les traders travaillant dans le concept Smart Money (SMC). Il identifie automatiquement deux modèles clés sur le graphique des prix: FVG   (Fair Value Gap) est une combinaison de trois bougies, dans laquelle il y a un écart entre la première et la troisième bougie. Forme une zone entre les niveaux où il n'y a pas de support de volume, ce qui conduit souvent à une correction des prix. BPR   (Balanced Price Range) est une combinaiso
Terra Infinity is a flat indicator. This improved version of the CalcFlat indicator has three additional lines that significantly increase its effectiveness. Unlike its predecessor with two static levels, Terra Infinity adds three dynamic lines above the main histogram, which are interpreted as follows: base signal line, minimum signal line, maximum signal line. These lines are formed using the additional parameter Avg, which is the average value of the histogram. Averaging produces a line cl
Moving Average Surfer
Rowan Stephan Buys
Moving Average Surfer – Cattura del Trend con Precisione per MT5 Surfa le onde del mercato con Moving Average Surfer, progettato per offrire precisione e gestione del rischio completamente automatizzata. Caratteristiche principali: Doppia analisi delle medie mobili Filtro RSI integrato Gestione dinamica del rischio Direzioni operative flessibili Stop/target basati su ATR Funziona su qualsiasi timeframe Magic Number univoco Costruito per chi vuole una soluzione disciplinata, automatica e altament
The indicator detects and displays М. Gartley's Butterfly pattern. The pattern is plotted by the extreme values of the ZigZag indicator (included in the resources, no need to install). After detecting the pattern, the indicator notifies of that by the pop-up window, a mobile notification and an email. The pattern and wave parameters are displayed on the screenshots. The default parameters are used for demonstration purposes only in order to increase the amount of detected patterns. Parameters z
Overview Harmonic Patterns MT5 is a technical analysis indicator designed for the MetaTrader 5 platform. It identifies and displays harmonic price patterns, such as Butterfly, Cypher, Crab, Bat, Shark, and Gartley, in both bullish and bearish directions. The indicator calculates key price levels, including entry, stop loss, and three take-profit levels, to assist traders in analyzing market movements. Visual elements and customizable alerts enhance usability on the chart. Features Detects six ha
Trend Lines Scalper
Magdalena Estefania Colonna
TREND LINES Scalper Professional Indicator OVERVIEW Trend Lines Scalper is a highly accurate, advanced indicator designed specifically for professional traders looking to maximize their scalping opportunities by automatically detecting trend lines and high-probability signals. This powerful algorithm combines classic technical analysis with modern technology, automatically identifying price patterns and generating accurate, real-time signals for successful scalping trades. MAIN FEATURES
L'indicatore costruisce le quotazioni attuali, che possono essere confrontate con quelle storiche e su questa base fanno una previsione del movimento dei prezzi. L'indicatore ha un campo di testo per una rapida navigazione fino alla data desiderata. Opzioni: Simbolo - selezione del simbolo che visualizzerà l'indicatore; SymbolPeriod - selezione del periodo da cui l'indicatore prenderà i dati; IndicatorColor - colore dell'indicatore; HorisontalShift - spostamento delle virgolette disegnate d
RM Divergence Pro
Mohammadreza Mahdi Mavaddat
RM Divergence Pro is a professional, non-repainting RSI divergence indicator designed for traders who want real structural insight beyond classic divergence tools. It accurately detects Regular Divergence (RD), Hidden Divergence (HD), Inability (IA), and Potential Divergence (P-DVG) using stable swing-based logic. Built for clarity, precision, and clean market structure analysis. -------------------------------------------------- OVERVIEW RM Divergence Pro is an advanced RSI-based divergence
TRI Visualizer
Yoshimi Mon 三 Ura
TRI Visualizer MT5 – Thermodynamic Market Analysis Overview The TRI (Thermal Range Indicator) Visualizer Enhanced is a rare market analysis indicator that goes beyond conventional technical analysis, applying principles of thermodynamics from physics. It interprets market price fluctuations as “thermodynamic energy,” enabling the highly accurate detection of subtle market changes that are often overlooked. Innovative Mechanisms 1. Dual Calculation Engines Classic TRI Mode Formula: |Close
Fibo Channels
Jeffrey Quiatchon
Fibo Daily Channel Indicator The  Indicator is a powerful tool for traders, providing precise daily support and resistance levels based on Fibonacci retracement and extension calculations. This indicator automatically draws key pivot points (PP, R1, R2, S1, S2) as well as additional extension levels (R3, R4, S3, S4), helping traders identify potential reversal and breakout zones with ease. It includes customizable alerts and push notifications, allowing traders to receive updates whenever the pr
"Impulses and Corrections 5" is created to help traders navigate the market situation. The indicator shows multi-time frame upward and downward "Impulses" of price movements. These impulses are the basis for determining the "Base" , which is composed of zones of "Corrections" of price movements, as well as "Potential" zones for possible scenarios of price movement. Up and down impulses are determined based on a modified formula of Bill Williams' "Fractals" indicator. The last impulse is always
Overview Mirror Signals Service EA (Text only)   is a powerful monitoring Expert Advisor that automatically sends   real-time Telegram notifications   for all important trade events on your MetaTrader 5 account. It is engineered specifically for   signal providers ,   trade-copier operators ,   auditors ,   educators , and   professional trading services   that require immediate, detailed, and reliable reporting. Everything from   entries, exits, SL/TP changes, comment changes, trailing sto
Order Book, known also as Market Book, market depth, Level 2, - is a dynamically updated table with current volumes of orders to buy and to sell specific financial instument at price levels near Bid and Ask. MetaTrader 5 provides the means for receiving market book from your broker, but in real time only, without access to its history. The indicator OrderBook Cumulative Indicator accumulates market book data online and visualizes them on the chart. In addition, the indicator can show the market
**   All Symbols   x   All Timeframes   scan just by pressing scanner button ** Discount: The price is $50$, But now it is just $39, Limited time offer is active. *** Contact me  to send you instruction and add you in "Trend Reversal group" for sharing or seeing experiences with other users. Introduction: Trendlines are the most famous technical analysis in trading . Trendlines continually form on the charts of markets across all the different timeframes providing huge opportunities for traders
PZ Divergence Trading MT5
PZ TRADING SLU
3.71 (7)
Unlock hidden profits: accurate divergence trading for all markets Tricky to find and scarce in frequency, divergences are one of the most reliable trading scenarios. This indicator finds and scans for regular and hidden divergences automatically using your favourite oscillator. [ Installation Guide | Update Guide | Troubleshooting | FAQ | All Products ] Easy to trade Finds regular and hidden divergences Supports many well known oscillators Implements trading signals based on breakouts Displays
Gli utenti di questo prodotto hanno anche acquistato
AriX
Temirlan Kdyrkhan
1 (4)
AriX Indicator for MT5 A powerful trend-following and signal-evaluation tool AriX is a custom MT5 indicator that combines Moving Averages and ATR-based risk/reward logic to generate clear buy/sell signals. It visualizes dynamic SL/TP levels, evaluates past trade outcomes, and displays win/loss statistics in a clean on-chart panel. Key features include: Buy/Sell signals based on MA crossovers ATR-based SL/TP1/TP2/TP3 levels with visual lines and labels Signal outcome tracking with real-time stat
ARICoins
Temirlan Kdyrkhan
ARICoin is a powerful trading companion designed to generate high-probability entry signals with dynamic TP/SL/DP levels based on volatility. Built-in performance tracking shows win/loss stats, PP1/PP2 hits, and success rates all updated live. Key Features: Buy/Sell signals with adaptive volatility bands Real-time TP/SL/DP levels based on ATR Built-in MA Filter with optional ATR/StdDev volatility Performance stats panel (Success, Profit/Loss, PP1/PP2) Alerts via popup, sound, push, or email Cust
TrendMaestro5
Stefano Frisetti
Attenzione alle truffe, questo indicatore e' distribuito esclusivamente su MQL5.com nota: questo indicatore e' per METATRADER5, se vuoi la versione per  METATRADER4 questo e' il link:   https://www.mql5.com/it/market/product/108106 TRENDMAESTRO ver 2.5 TRENDMAESTRO   riconosce un nuovo TREND sul nascere, non sbaglia mai. La sicurezza di identificare un nuovo TREND non ha prezzo. DESCRIZIONE TRENDMAESTRO identifica un nuovo TREND sul nascere, questo indicatore prende in esame la volatilita' i
L'indicatore " Dynamic Scalper System MT5 " è progettato per il metodo di scalping, ovvero per il trading all'interno di onde di trend. Testato sulle principali coppie di valute e sull'oro, è compatibile con altri strumenti di trading. Fornisce segnali per l'apertura di posizioni a breve termine lungo il trend, con ulteriore supporto al movimento dei prezzi. Il principio dell'indicatore. Le frecce grandi determinano la direzione del trend. Un algoritmo per generare segnali per lo scalping sott
Ottieni l’indicatore AUX GRATUITO e il supporto EA Download diretto — Clicca qui [ D.I.C.E ] The DICE Indicator  Divergence in Chaos Environment è uno strumento MT5 specializzato per trader che applicano la Teoria delle Onde di Elliott nel contesto delle tecniche di Trading Chaos. Identifica divergenze nascoste e regolari nell’azione dei prezzi, sincronizzate con l’ambiente di mercato caotico descritto da Bill Williams. Caratteristiche principali Divergenza allineata alle Onde di Elliott: rilev
+++++++++++++++++++++++++++++++++++++++++++++++++++++++++++++++++++++++++++++++++++++++++++++++++ +++ Link to EURUSD Only Free Version -->  https://www.mql5.com/en/market/product/156904?source=Unknown +++++++++++++++++++++++++++++++++++++++++++++++++++++++++++++++++++++++++++++++++++++++++++++++++ Hallo Trader, This is a traditional GANN & FIBONACCI strategy based on detection of an impulsive move in the opposite direction. This is called a Breakout. At the moment of Breakout, the indicator draw
Frontier Pivots
Nestor Jose Mendez Boza
FRONTIER PIVOTS - Geometric Levels Indicator This indicator plots support and resistance levels/ranges on the chart using mathematical calculations. It helps traders identify potential price reaction zones based on geometric patterns. Main Features: Automatically calculates and displays key price levels Plots both support and resistance lines Uses daily price data for level calculation Clean visual presentation with different colors for different level types No repainting - levels remain static
Pantera Indicator
Temirlan Kdyrkhan
5 (1)
A tool for on-chart strategy backtesting and performance analysis. A utility for developing, debugging, and testing custom trading ideas and indicator functions. An indicator designed to quickly test trading concepts and visualize the effectiveness of different input parameters. An all-in-one sandbox for testing everything from simple crossovers to complex, multi-condition trading systems.
Weis Wave with Alert MT5
Trade The Volume Waves Single Member P.C.
4.94 (17)
Rental/Lifetime Package Options and Privileges  Rent Monthly Six Months   Yearly/Lifetime Weis Wave with Speed with Alert+Speed Index x x x Manual  x x x Quick Set up Video x x x Blog x x x Lifetime Updates x x x Setup and Training Material x x Discord Access Channel "The SI traders"          x Rectangle Break Alert Tool      x How to trade with it:    http://www.tradethevolumewaves.com   ** If you purchase please contact me to setup your  : Training Room and  complete manual access.  Wei
Hello I Want to introduce The Forex Buy Sell Arrow Premium MT5 i recently release this premium indicator! its 1000% Non Repaint Indicator, It Work Perfectly Well,, i tested it day by day, Just mind blowing Result,  Including Powerful trend Algorithm! How It Work? well, it work market trend formula, when trend Bullish Or when trend Bearish,  Recommend Timeframe M30, H1 it work all timeframe, and all currency pair, 100% non repaint, How to take signal From Forex Buy Sell Arrow Premium Ind
Big Player Range
Thalles Nascimento De Carvalho
5 (3)
BigPlayerRange – Il miglior indicatore per MT5 BigPlayerRange è considerato il miglior indicatore per Mini Indice e Mini Dollaro su MetaTrader 5. Questo strumento essenziale evidenzia le zone strategiche di azione dei grandi player, offrendo un’analisi tecnica istituzionale di altissima precisione. Come usare BigPlayerRange: Questo indicatore mostra zone di acquisto (linea verde) e di vendita (linea rossa). Quando il prezzo chiude fuori da queste aree, è probabile un movimento di tendenz
Enigma 112
issam rahhal sabour
Enigma 112 Indicator - User Manual Enigma 112 Indicator Complete User Manual - Ultimate Trading Solution Introduction The Enigma 112 is a comprehensive multi-timeframe trading indicator that combines advanced technical analysis concepts including Tesla 3-6-9 Gates, Huddleston Theory, PO3 Dealing Ranges, and sophisticated risk management systems. Tesla 3-6-9 Gates Based on Nikola Tesla's vortex mathematics for precise support and resistance levels Huddleston Theory Volume-based market
VTrende Pro
Andrii Diachenko
5 (1)
VTrende Pro - MTF indicator for trend trading with a display panel for MT5 *** Videos can be translated into any language using subtitles (video language - Russian) Although the signals of the VTrende Pro indicator can be used as signals of a full-fledged trading system, it is recommended to use them in conjunction with the Bill Williams TS. VTrende Pro is an extended version of the VTrende indicator. Difference between Pro version and VTrende: - Time zones - Signal V - signal 1-2 waves -    S
L’indicatore analizza il volume da qualsiasi punto e calcola i livelli di esaurimento del mercato per quel volume. Linee principali di Meravith: Linea di esaurimento del volume rialzista – funge da obiettivo. Linea di esaurimento del volume ribassista – funge da obiettivo. Linea di tendenza – indica la tendenza del mercato. Cambia colore a seconda che il mercato sia rialzista o ribassista e funge da supporto di tendenza. Come utilizzarlo: fai doppio clic sulla linea verticale viola e spostala ne
ChartMaster Heikin Ashi with Pivot Indicator for MT5 Take your trading to the next level with ChartMaster Heikin Ashi with Pivot Indicator , a powerful tool that combines the clarity of Heikin Ashi candles with advanced pivot-point analysis. This indicator is designed for traders who want to identify market trends, reversals, and key support/resistance zones with precision. Key Features: Heikin Ashi Visualization – Smooths out market noise for cleaner trend identification. Automatic Pivot
The Second-Level Tick Candlestick Generator is a professional-grade MT5 indicator tool specifically designed for high-frequency trading and short-term scalping. It can convert raw tick data into highly customizable second-level candlestick charts in real-time, helping traders accurately capture micro-market fluctuations and optimize entry and exit timing. This tool provides clear chart displays, allowing you to more intuitively identify price action patterns and improve trading decision efficien
XCalper TFO
Aecio de Feo Flora Neto
This oscillator was developed exclusively by xCalper in 2015 based on moving averages calculations to indicate and try predicting oversold and overbought levels. The fast line (white, by default) oscillates basically between values -0.5 (oversold) and +0.5 (overbought). Whenever this line crosses upward value -0.5, it means an oversold price level. When it crosses downward value +0.5, it means an overbought price level. When fast line crosses value 0.0 and returns, it is a strong pull-back indic
The Expert Advisor and the video are attached in the Discussion tab . The robot applies only one order and strictly follows the signals to evaluate the indicator efficiency. Pan PrizMA CD Phase is an option based on the Pan PrizMA indicator. Details (in Russian). Averaging by a quadric-quartic polynomial increases the smoothness of lines, adds momentum and rhythm. Extrapolation by the sinusoid function near a constant allows adjusting the delay or lead of signals. The value of the phase - wave s
Классификатор силы тренда. Показания на истории не меняет. Изменяется классификация только незакрытого бара. По идее подобен полной системе ASCTrend, сигнальный модуль которой, точнее его аппроксимация в несколько "урезанном" виде, есть в свободном доступе, а также в терминале как сигнальный индикатор SilverTrend . Точной копией системы ASCTrend не является. Работает на всех инструментах и всех временных диапазонах. Индикатор использует несколько некоррелируемых между собой алгоритмов для класси
FFx Universal Strength Meter PRO is more than a basic strength meter. Instead of limiting the calculation to price, it can be based on any of the 19 integrated strength modes + 9 timeframes. With the FFx USM, you are able to define any period for any combination of timeframes. For example, you can set the dashboard for the last 10 candles for M15-H1-H4… Full flexibility! Very easy to interpret... It gives a great idea about which currency is weak and which is strong, so you can find the best pai
The FFx Universal MTF alerter shows on a single chart all the timeframes (M1 to Monthly) with their own status for the chosen indicator. 9 indicators mode (MACD-RSI-Stochastic-MA-ADX-Ichimoku-Candles-CCI-PSAR). Each can be applied multiple times on the same chart with different settings. Very easy to interpret. Confirm your BUY entries when most of the timeframes are showing green color. And confirm your SELL entries when most of the timeframes are showing red color. 2 Alert Options : input to s
The FFx Watcher PRO is a dashboard displaying on a single chart the current direction of up to 15 standard indicators and up to 21 timeframes. It has 2 different modes: Watcher mode: Multi Indicators User is able to select up to 15 indicators to be displayed User is able to select up to 21 timeframes to be displayed Watcher mode: Multi Pairs User is able to select any number of pairs/symbols User is able to select up to 21 timeframes to be displayed This mode uses one of the standard indicators
FFx Patterns Alerter gives trade suggestions with Entry, Target 1, Target 2 and StopLoss .... for any of the selected patterns (PinBar, Engulfing, InsideBar, OutsideBar) Below are the different options available: Multiple instances can be applied on the same chart to monitor different patterns Entry suggestion - pips to be added over the break for the entry 3 different options to calculate the SL - by pips, by ATR multiplier or at the pattern High/Low 3 different options to calculate the 2 TPs -
MetaTrader 4 version available here : https://www.mql5.com/en/market/product/24881 FFx Basket Scanner is a global tool scanning all pairs and all timeframes over up to five indicators among the 16 available. You will clearly see which currencies to avoid trading and which ones to focus on. Once a currency goes into an extreme zone (e.g. 20/80%), you can trade the whole basket with great confidence. Another way to use it is to look at two currencies (weak vs strong) to find the best single pairs
Currency Index Watcher is a simple and user-friendly tool for whoever wish to trade Forex using currencies indexes. Currency Index Watcher is configurable and usable directly from the panel. Indexes of 8 custom currencies EUR, USD, GBP, JPY, CHF, AUD, CAD, NZD (default) Any 3-chars symbol from your market watch could be used (BTC = bitcoin, RUB = ruble, CNH = yuan etc ...) : double click the symbol label  Ability to select which currencies and made-of pairs will be analyzed : check/uncheck wante
MetaTrader 4 version available here: https://www.mql5.com/en/market/product/25793 FFx Pivot SR Suite PRO is a complete suite for support and resistance levels. Support and Resistance are the most used levels in all kinds of trading. Can be used to find reversal trend, to set targets and stop, etc. The indicator is fully flexible directly from the chart 4 periods to choose for the calculation: 4Hours, Daily, Weekly and Monthly 4 formulas to choose for the calculation: Classic, Camarilla, Fibonac
Forex Relative Performance indicator This indicator calculates the relative strength of major currencies against the US dollar. The basic idea behind this indicator is "to buy strong currency and to sell weak currency". This indicator allows you to quickly identify the best forex pair to trade according to your trading style (Intraday, Scalping, Swing, or Long Term)
Pendiente de Precio
Cesar Juan Flores Navarro
Indicador en base a la pendiente de la linea de precio, dibuja una línea de color cuando sube a base de los precios que previamente has sido procesados o linealizados, y cuando baja la pendiente la linea linealizada toma otro color. En este caso se a considerado 6 lineas de diferentes procesos desde pendientes largas hacia las cortas, observándose que cuando coincidan las pendientes se produce un máximo o mínimo, lo que a simple vista nos permitirá hacer una COMPRA O VENTA.
WanaScalper
Isaac Wanasolo
1 (1)
A scalping indicator based on mathematical patterns, which on average gives signals with relatively small SL, and also occasionally helps to catch big moves in the markets (more information in the video) This indicator has three main types of notifications: The first type warns of a possible/upcoming signal on the next bar The second type indicates the presence of a ready signal to enter the market/open a position The third type is for SL and TP levels - you will be notified every time price re
Индикатор Coefficient Of Determination (COD) представляет собой значение коэффициента детерминации или квадрат коэффициента корреляции между зависимой переменной — ценой и объясняющей переменной — тиковым объемом. Что это дает нам на практике? COD отлично распознает кульминацию трендовых движений, что позволяет подбирать оптимальные точки и ловить развороты рынка. Как использовать индикатор: Наиболее популярная торговая стратегия строится совместно с трендовым индикатором Moving Average (MA), пе
Altri dall’autore
Canal H Pro
N'da Lemissa Kouame
Italiano – Canal H Pro Nome: Canal H Pro – Supporto, Resistenza e Breakout Descrizione breve: Indicatore premium con tre linee dinamiche (alta, bassa, media) e frecce automatiche BUY/SELL sui breakout. Ideale per strategie Breakout, Range e trend following. Descrizione completa: Rossa (Alta) → resistenza dinamica Blu (Bassa) → supporto dinamico Gialla (Media) → equilibrio e filtro di trend Segnali automatici BUY/SELL sul grafico Periodo e colori personalizzabili Compatibile con tutte le stra
NuageTrend Pro
N'da Lemissa Kouame
Nuage Trend Pro – Monitoraggio delle Tendenze & Segnali Kijun Nuage Trend Pro è un indicatore avanzato per MetaTrader 5 , progettato per identificare rapidamente le tendenze di mercato forti e individuare i punti di ingresso ottimali tramite i crossover della Kijun. Trasforma i tuoi grafici in mappe visive chiare , per operare con precisione e fiducia . Funzionalità principali Rilevamento automatico dei crossover Kijun : evidenzia immediatamente i momenti chiave in cui il prezzo attraversa
Weekly Levels Pro
N'da Lemissa Kouame
Italiano (Italien) – Weekly Levels Pro Weekly Levels Pro – Livelli Settimanali Chiave è un indicatore semplice ma potente per MetaTrader 5, progettato per mostrare automaticamente i quattro livelli di trading più importanti di ogni settimana: Massimo settimanale (Weekly High) → livello naturale di resistenza Minimo settimanale (Weekly Low) → livello naturale di supporto Apertura settimanale (Weekly Open) → punto di riferimento del trend Chiusura settimanale (Weekly Close) → indicatore di forz
Pin Bar Pro v1
N'da Lemissa Kouame
Pin Bar Pro v1.0 – Indicatore MQL5 Descrizione: Pin Bar Pro è un indicatore professionale per MetaTrader 5 che rileva automaticamente i Pin Bars , pattern di candele fondamentali per anticipare i cambi di trend. Freccia blu → segnale di acquisto Freccia rossa → segnale di vendita Funzionalità: Rilevamento automatico Pin Bars Frecce personalizzabili ( Arrow_Up_Code , Arrow_Down_Code ) Offset verticale regolabile ( Arrow_Offset_Pts ) Funziona su tutti i simboli e timeframe Parametri: Parametro De
ndicatore Monthly Levels + Pin Bar Pro Descrizione L’indicatore Monthly Levels + Pin Bar Pro combina i livelli chiave mensili (Massimo, Minimo, Apertura, Chiusura) con il rilevamento automatico dei pattern di inversione Price Action (Pin Bars) . Progettato per trader tecnici e istituzionali, aiuta a prevedere le zone di reazione del mercato e genera segnali chiari sul grafico. Caratteristiche principali Livelli mensili automatici : Massimo, Minimo, Apertura, Chiusura. Rilevamento Pin
Yearly Levels Pro
N'da Lemissa Kouame
Italiano (Italian) Versione: 1.0 Sviluppatore: KOUAME N'DA LEMISSA Piattaforma: MetaTrader 5 (MT5) Tipo: Indicatore tecnico / Livelli di prezzo annuali Descrizione: Yearly Levels Pro v1.0, sviluppato da KOUAME N'DA LEMISSA, è un indicatore potente per identificare rapidamente i livelli chiave annuali. Calcola automaticamente i prezzi Open, High, Low e Close e li visualizza sul grafico con linee orizzontali colorate. Funzionalità principali: High (Rosso), Low (Blu), Open (Verde), Close (Arancio
Italian Version (Italiano) Quarterly Levels Pro v1.0 – Avviso Commerciale Nome Prodotto: Quarterly Levels Pro v1.0 Sviluppatore: KOUAME N'DA LEMISSA Versione: 1.0 Descrizione: Quarterly Levels Pro , sviluppato da KOUAME N'DA LEMISSA , è un indicatore professionale per MetaTrader 5 che mostra automaticamente i livelli High, Low, Open e Close di un periodo trimestrale. Consente ai trader di visualizzare chiaramente le zone chiave di supporto e resistenza sul grafico, facilitando le decisioni d
Italiano (Italien) Descrizione Multi-Timeframe Levels Pro v1.0 disegna automaticamente sul grafico i livelli chiave Giornalieri, Mensili, Trimestrali e Annuali (Massimo, Minimo, Apertura, Chiusura). Perfetto per individuare supporti, resistenze e zone di breakout. Caratteristiche Visualizzazione automatica di Daily / Monthly / Quarterly / Yearly Colori distinti per High, Low, Open, Close Parametro Shift per analizzare periodi passati Funziona su tutti i mercati: Forex, Indici, Materie prime, Azi
Marubozu Pro MT5
N'da Lemissa Kouame
Commercial Description – Marubozu Pro (MT5) Description Marubozu Pro is a professional indicator for MetaTrader 5 that automatically detects Marubozu candles (bullish and bearish) directly on your chart. It helps traders identify strong market momentum where buyers or sellers take full control, by displaying clear visual arrows for buy and sell signals. This tool is designed to be simple, effective, and fast , perfect for manual trading or as a filter in automated strategies. Key Features
ETE Detector – Head & Shoulders Indicator Turn your charts into clear and actionable trading opportunities! About the Indicator The ETE Detector automatically identifies Head & Shoulders (H&S) and Inverse Head & Shoulders (IH&S) patterns — classic trend reversal formations. No more spending hours searching manually: your analysis becomes fast, accurate, and visual . What You Get Automatic detection of trend reversal patterns Colored arrows : green for buys (Inverse H&S), red for sell
Fusion Monthly Levels + PinBar + Marubozu Descrizione Questo indicatore unico combina tre potenti strumenti di analisi tecnica in uno solo: Livelli mensili (High, Low, Open, Close) – per identificare zone chiave di supporto e resistenza. Rilevamento PinBar – pattern di candela affidabile che segnala rifiuti di prezzo. Rilevamento Marubozu – candele di forte tendenza che indicano momentum direzionale. Grazie a questa fusione, ottieni uno strumento visivo, completo e reattivo per anticipare
ABCD Lemissa + Livelli Mensili + PinBar + Marubozu Descrizione Questo indicatore combina più strumenti potenti per fornire una visione completa del mercato: ABCD Lemissa – Rileva automaticamente le strutture ABCD con i punti A, B, C e D , evidenziando le zone di supporto/resistenza e mostrando frecce di acquisto/vendita. Livelli Mensili (Monthly Levels) – Mostra i livelli High, Low, Open e Close delle candele mensili per identificare le zone chiave. PinBar & Marubozu – Rileva automaticamente
Order Block Pro MT5
N'da Lemissa Kouame
Order Block Pro (MQL5) – Versione 1.0 Autore: KOUAME N'DA LEMISSA Piattaforma: MetaTrader 5 Descrizione: Order Block Pro è un indicatore avanzato progettato per rilevare automaticamente Order Block rialzisti e ribassisti sul tuo grafico. Analizzando candele di consolidamento seguite da candele impulsive forti, l’indicatore evidenzia le aree chiave dove il prezzo è destinato a muoversi rapidamente. Ideale per trader che vogliono: Identificare punti di ingresso e uscita precisi. Rilevare zone din
ETE Detector v4.0 (Head & Shoulders) Author: KOUAME N’DA LEMISSA Version: 4.0 Platform: MetaTrader 5 Indicator Type: Chart / Visual Trading Signals Overview The ETE Detector v4.0 is a technical indicator designed to automatically detect classic and inverse Head & Shoulders patterns (H&S) on MT5 charts. These patterns are widely used to anticipate trend reversals. With this tool, traders can: Detect sell signals (classic H&S) and buy signals (inverse H&S) with accuracy. Easily visualize patterns
Avis commercial – ETE DETECTOR POWER v5.0 (Head & Shoulders Pro) Détection automatique des motifs tête et épaules ETE DETECTOR POWER v5.0 est un outil professionnel conçu pour les traders qui souhaitent anticiper les retournements majeurs du marché en utilisant l'un des modèles graphiques les plus puissants : le Head & Shoulders (H&S) et sa variation inverse. Grâce à son système de gestion d'objets optimisé (MaxObjects) , l'indicateur reste fluide et lisible, même sur des graphiques chargés
Dynamique mensuelle des plages hautes et basses v1.0 Auteur : KOUAME N'DA LEMISSA Description : L' indicateur dynamique mensuel de fourchette haute et basse affiche les niveaux mensuels clés sur votre graphique grâce à des fonctionnalités avancées de suivi dynamique. Il permet aux traders de visualiser facilement les zones de support et de résistance mensuelles, ainsi que les zones où le prix tend à dépasser ou à tester ces niveaux, offrant ainsi des opportunités de trading précises. P
Monthly High & Low Dynamic Range + Liquidity Zones v1.2 Author: KOUAME N'DA LEMISSA Description: Transform your market analysis with this powerful indicator that combines: Key Monthly Levels: High, Low, Open, and Close to identify the most important support and resistance zones. Dynamic High/Low Range: Automatically tracks extreme price movements to detect significant market shifts. Liquidity Zones: Visual rectangles showing areas where liquidity is concentrated (Buy/Sell). The thickness and c
Italien (Italien / Italiano) Booster Trading Pro Autore: KOUAME N'DA LEMISSA Format: MetaTrader 5 Type: Indicateur technique multifonction Description Transformez votre analyse du marché avec Booster Trading Pro , un indicateur tout-en-un qui combine divers instruments clés : Livelli mensili chiave: massimo, minimo, apertura et chiusura pour identifier rapidement la zone de support et de résistance. Intervalle dynamique alto/basso : le moniteur contrôle les mouvements des prix de la sopra ou
StructureBlocksAuto + MensuelOU La puissance de la structure rencontre la précision mensuelle Description Fusion StructureBlocksAuto + MonthlyOR est un indicateur tout-en-un avancé combinant la détection de la structure du marché (swings automatiques, plus hauts/plus bas et blocs de structure) avec le système Monthly Open Range (MOR) . Il offre une combinaison professionnelle d'analyse de la structure institutionnelle et de niveaux clés mensuels pour vous aider à détecter les zones de tradi
Channel Ultima
N'da Lemissa Kouame
Channel Ultima – Indicateur Multi-Canal Dynamique Description courte Channel Ultima est un indicateur avancé qui trace automatiquement trois canaux dynamiques du marché. Il offre une lecture claire des zones de support, de résistance et d'équilibre , idéale pour les traders techniques et structurels. Présentation détaillée Channel Ultima détecte et affiche trois canaux indépendants associés sur les pivots majeurs et mineurs du marché. Chaque canal représente une zone de pression sur le p
Carte de liquidité institutionnelle Pro Voyez ce que voient les institutions — avant tout le monde Aperçu Institutional Liquidity Map Pro est un indicateur professionnel conçu pour cartographier les zones de liquidité institutionnelle à l'aide des niveaux mensuels les plus hauts et les plus bas . Il détecte automatiquement les zones de stop-hunt , les zones de retournement potentiel et les zones d'accumulation/distribution institutionnelles . L'indicateur suit dynamiquement jusqu'à trois ni
Filtro:
Nessuna recensione
Rispondi alla recensione