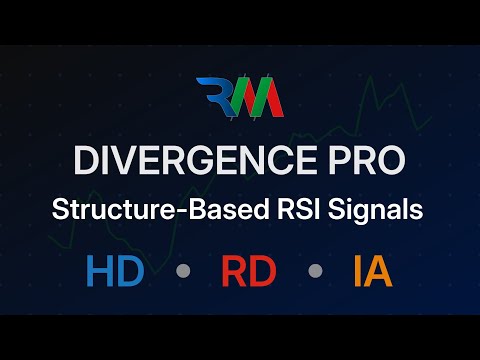
RM Divergence Pro
- Indicatori
- Versione: 1.6
- Aggiornato: 19 giugno 2026
- Attivazioni: 5

RM Divergence Pro - Advanced RSI Divergence and Inability Indicator,
It is a professional, non-repainting RSI divergence indicator based on real market structure.
It detects Regular Divergence, Hidden Divergence, Inability, and Potential Divergence using confirmed RSI swings, price behavior, and advanced filters for clean and reliable analysis.
==================================================
OVERVIEW
==================================================
RM Divergence Pro is an advanced RSI-based divergence engine focused on structural logic rather than noisy indicator signals.
Instead of relying on simple price-to-RSI comparison, it uses confirmed RSI swing highs and lows together with
price structure behavior to detect meaningful divergence, exhaustion, and failed continuation patterns.
This results in clean, stable, and professional-grade signals suitable for serious discretionary traders.
==================================================
KEY FEATURES & CAPABILITIES
==================================================
• Non-repainting logic after RSI swing confirmation
• Advanced RSI swing-based detection (not raw RSI values)
• Multiple signal types in one tool:
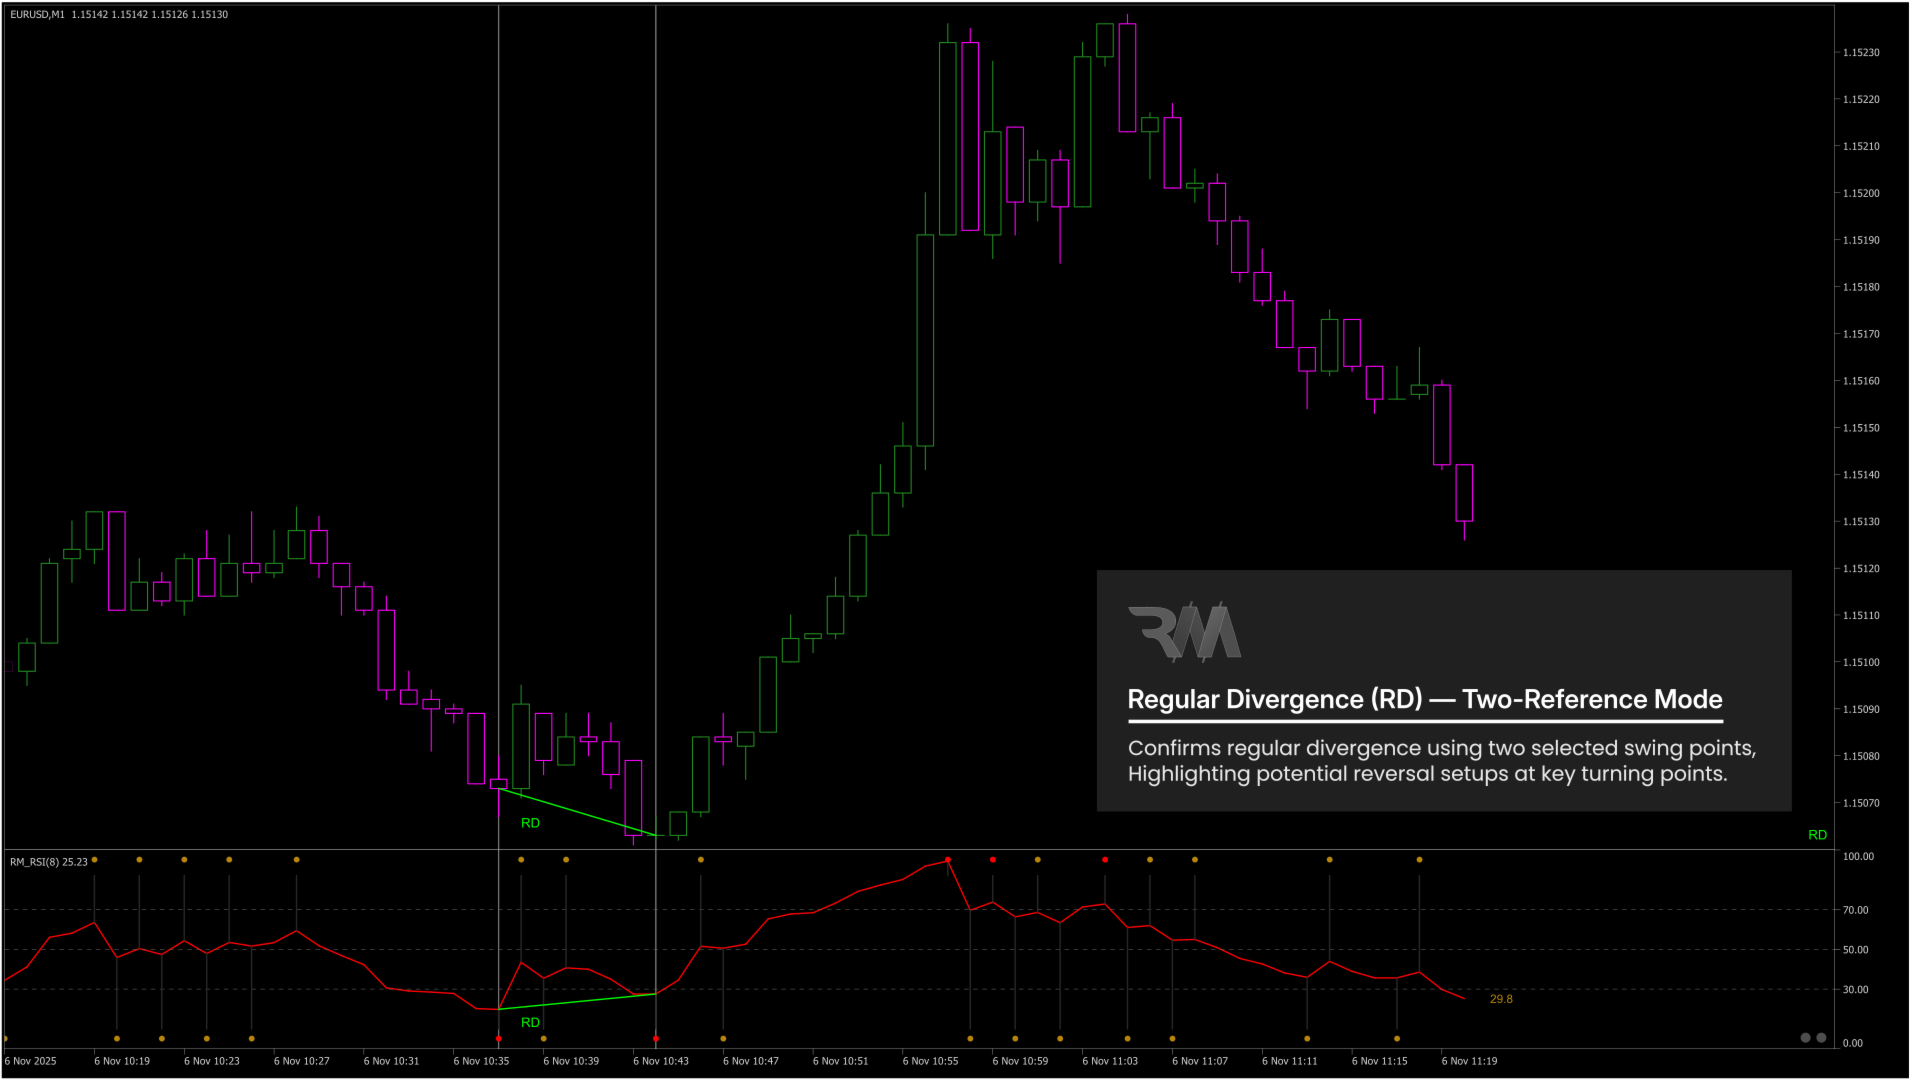
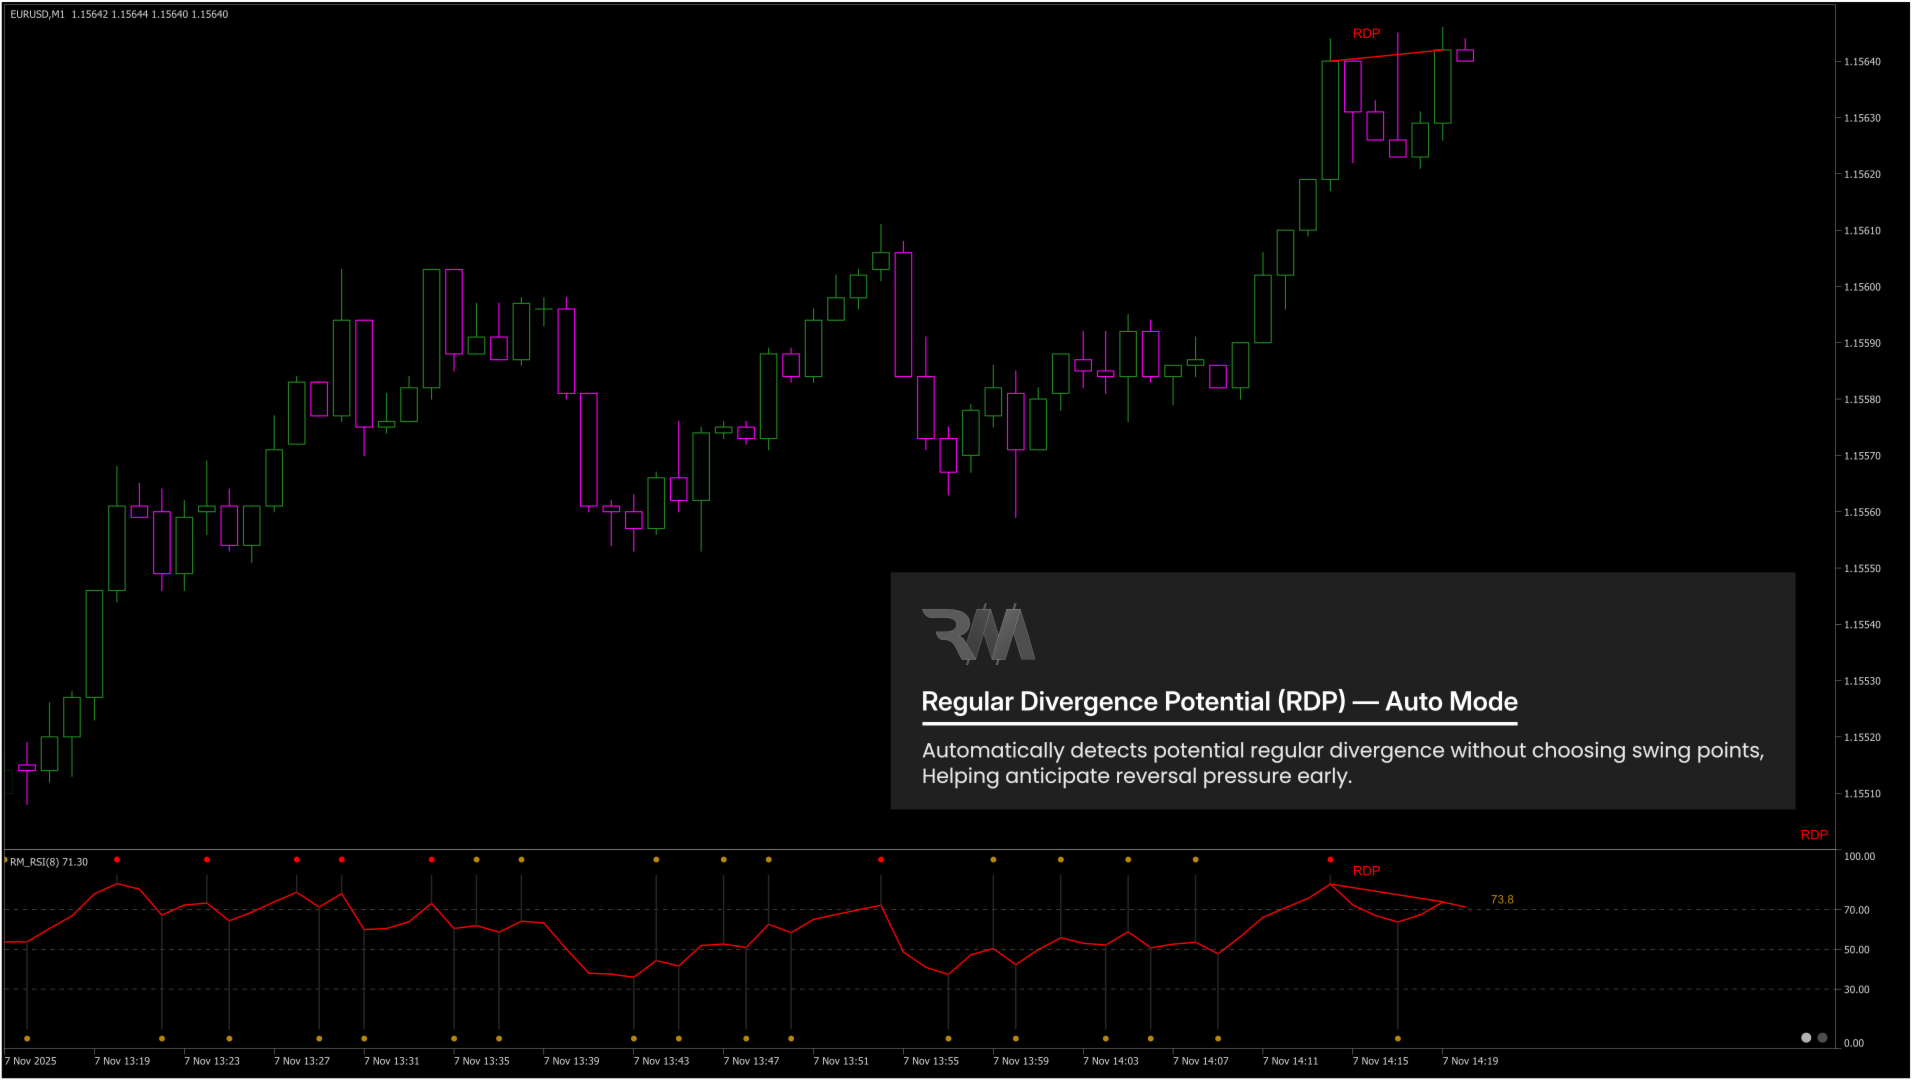
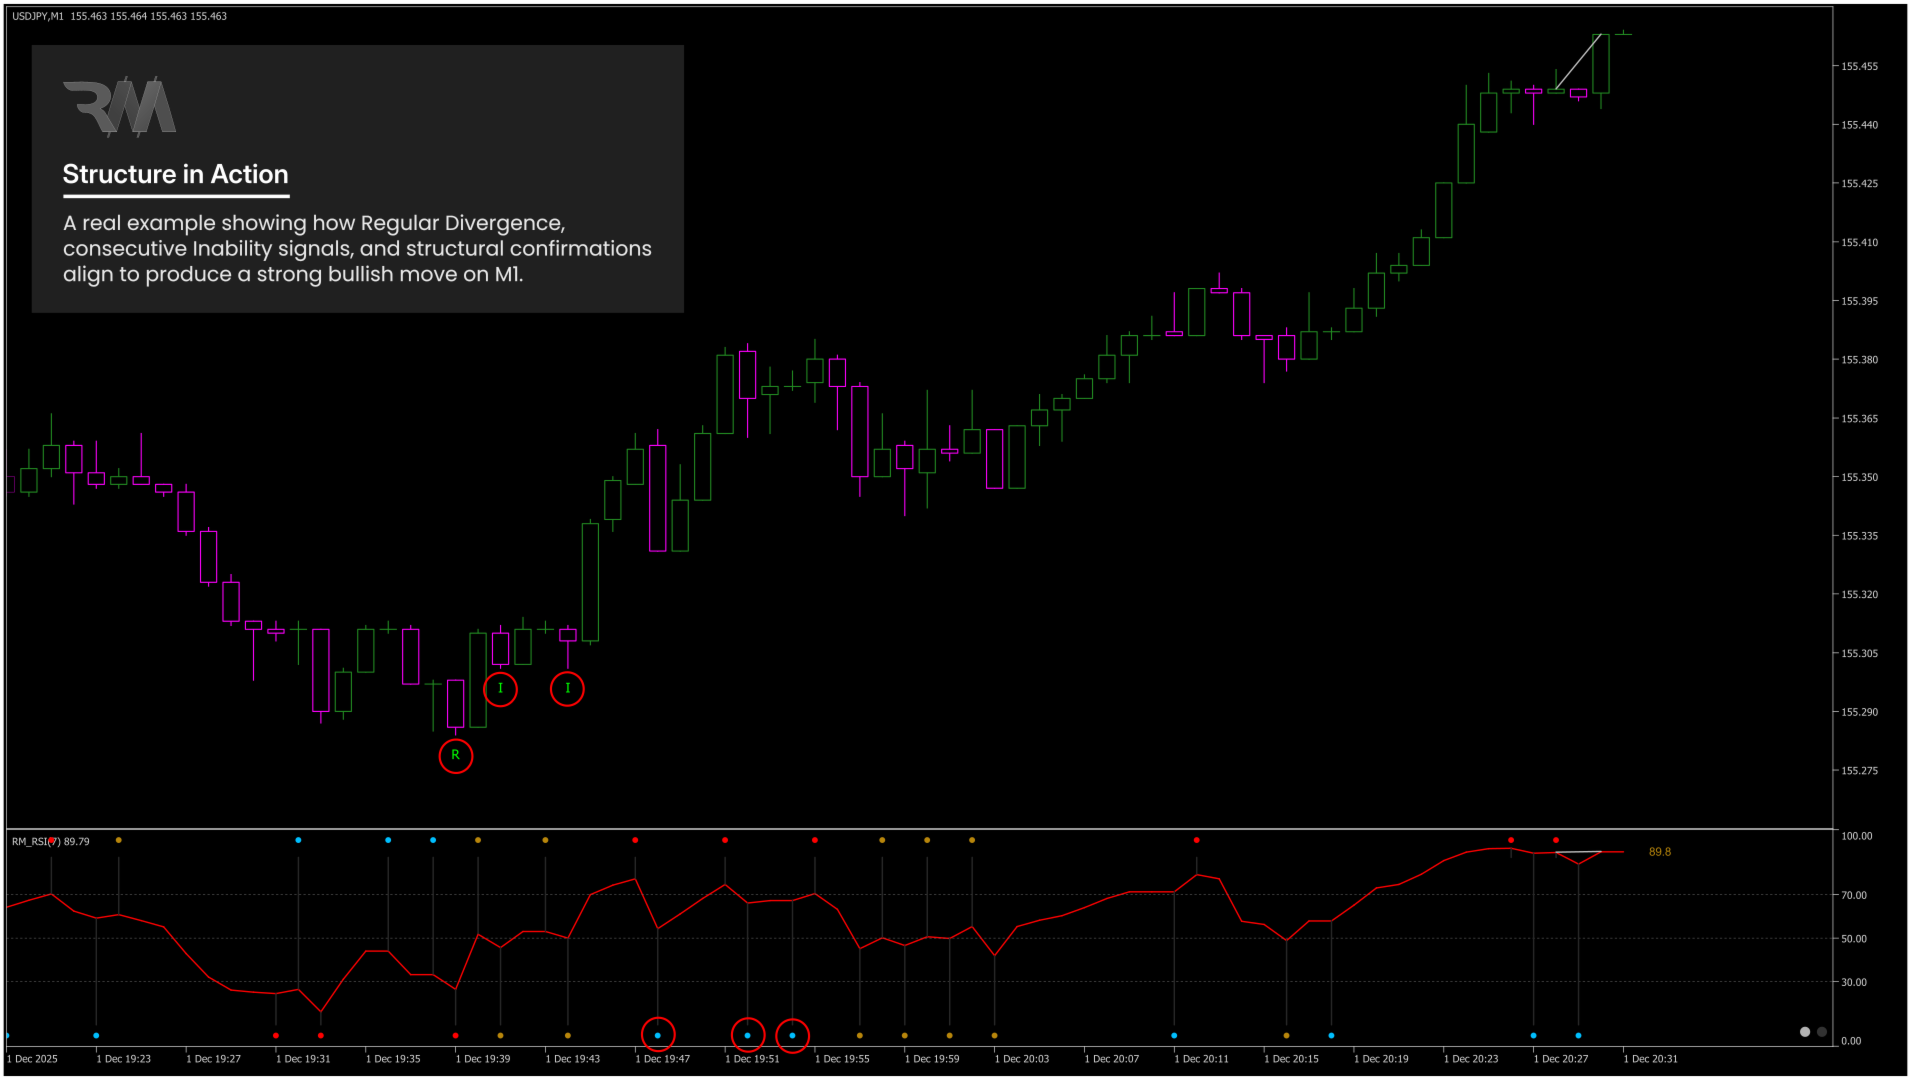
- Regular Divergence (RD)
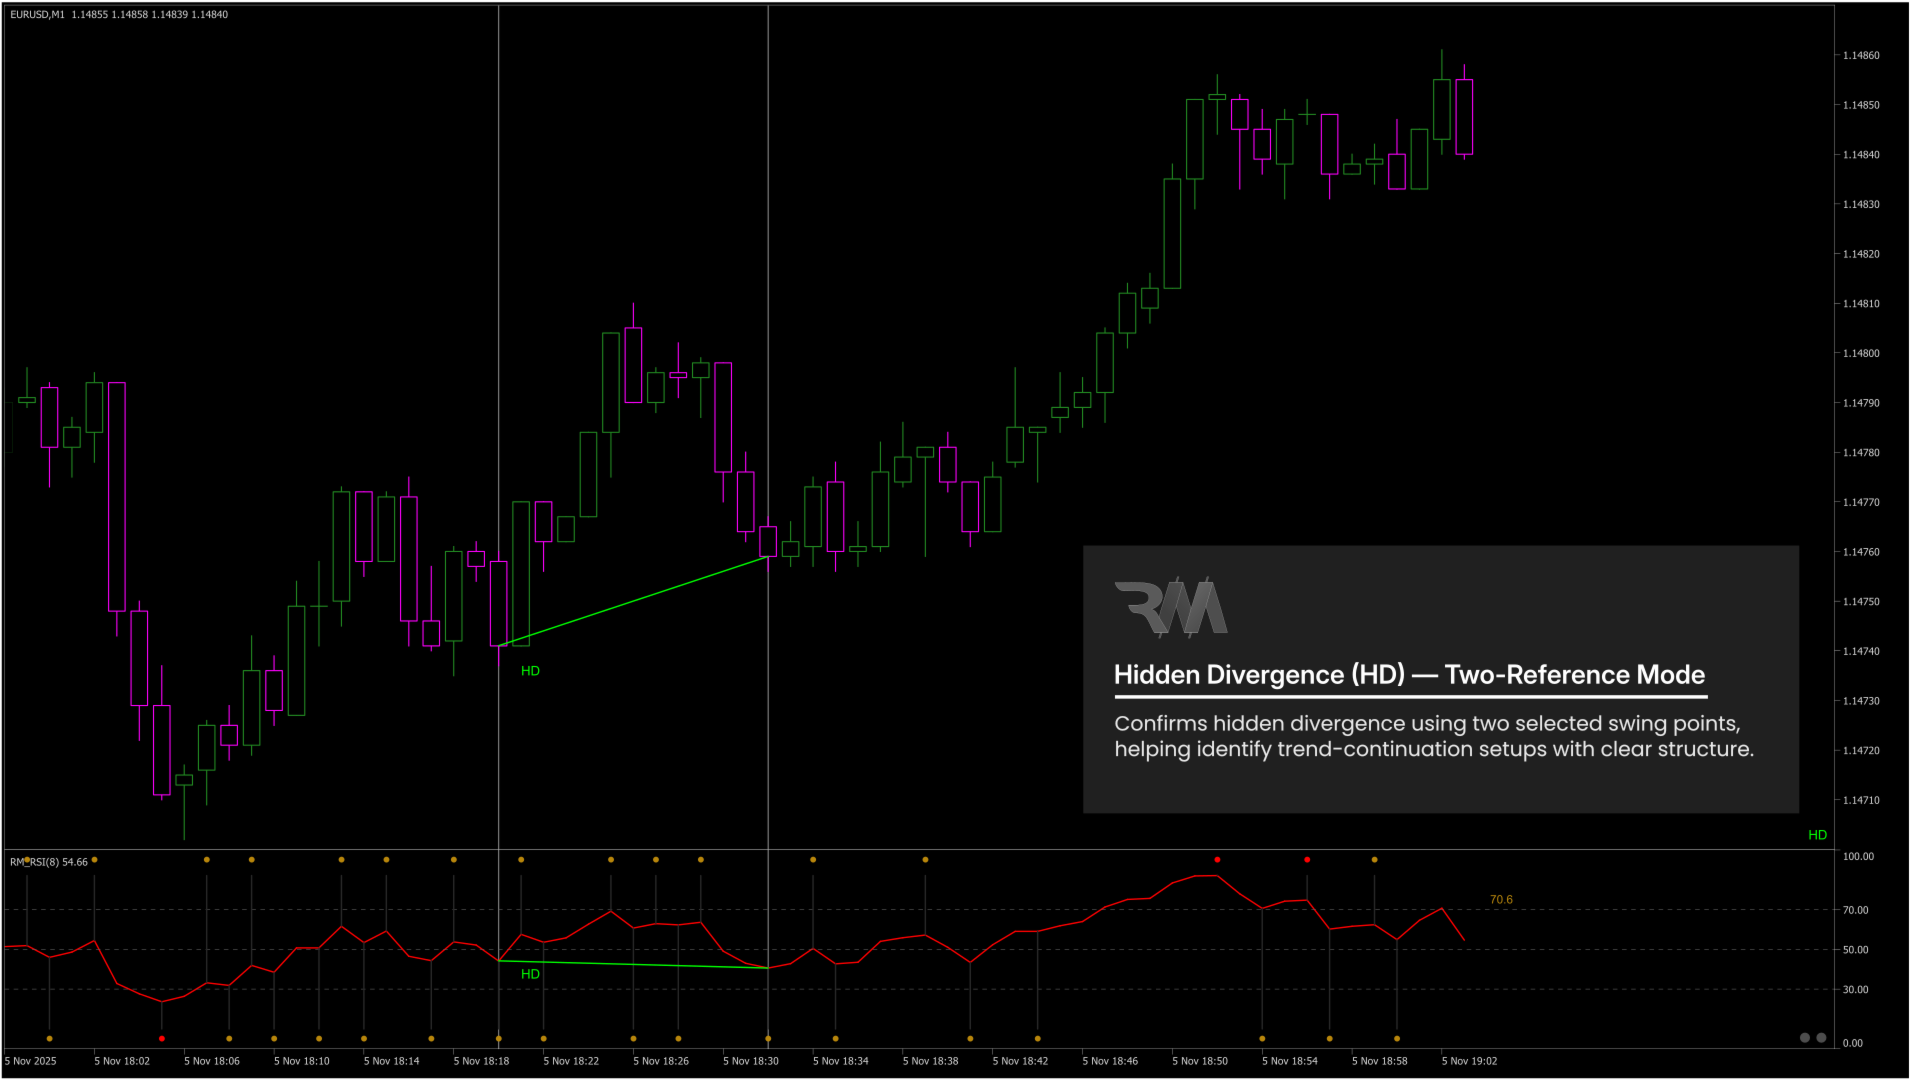
- Hidden Divergence (HD)
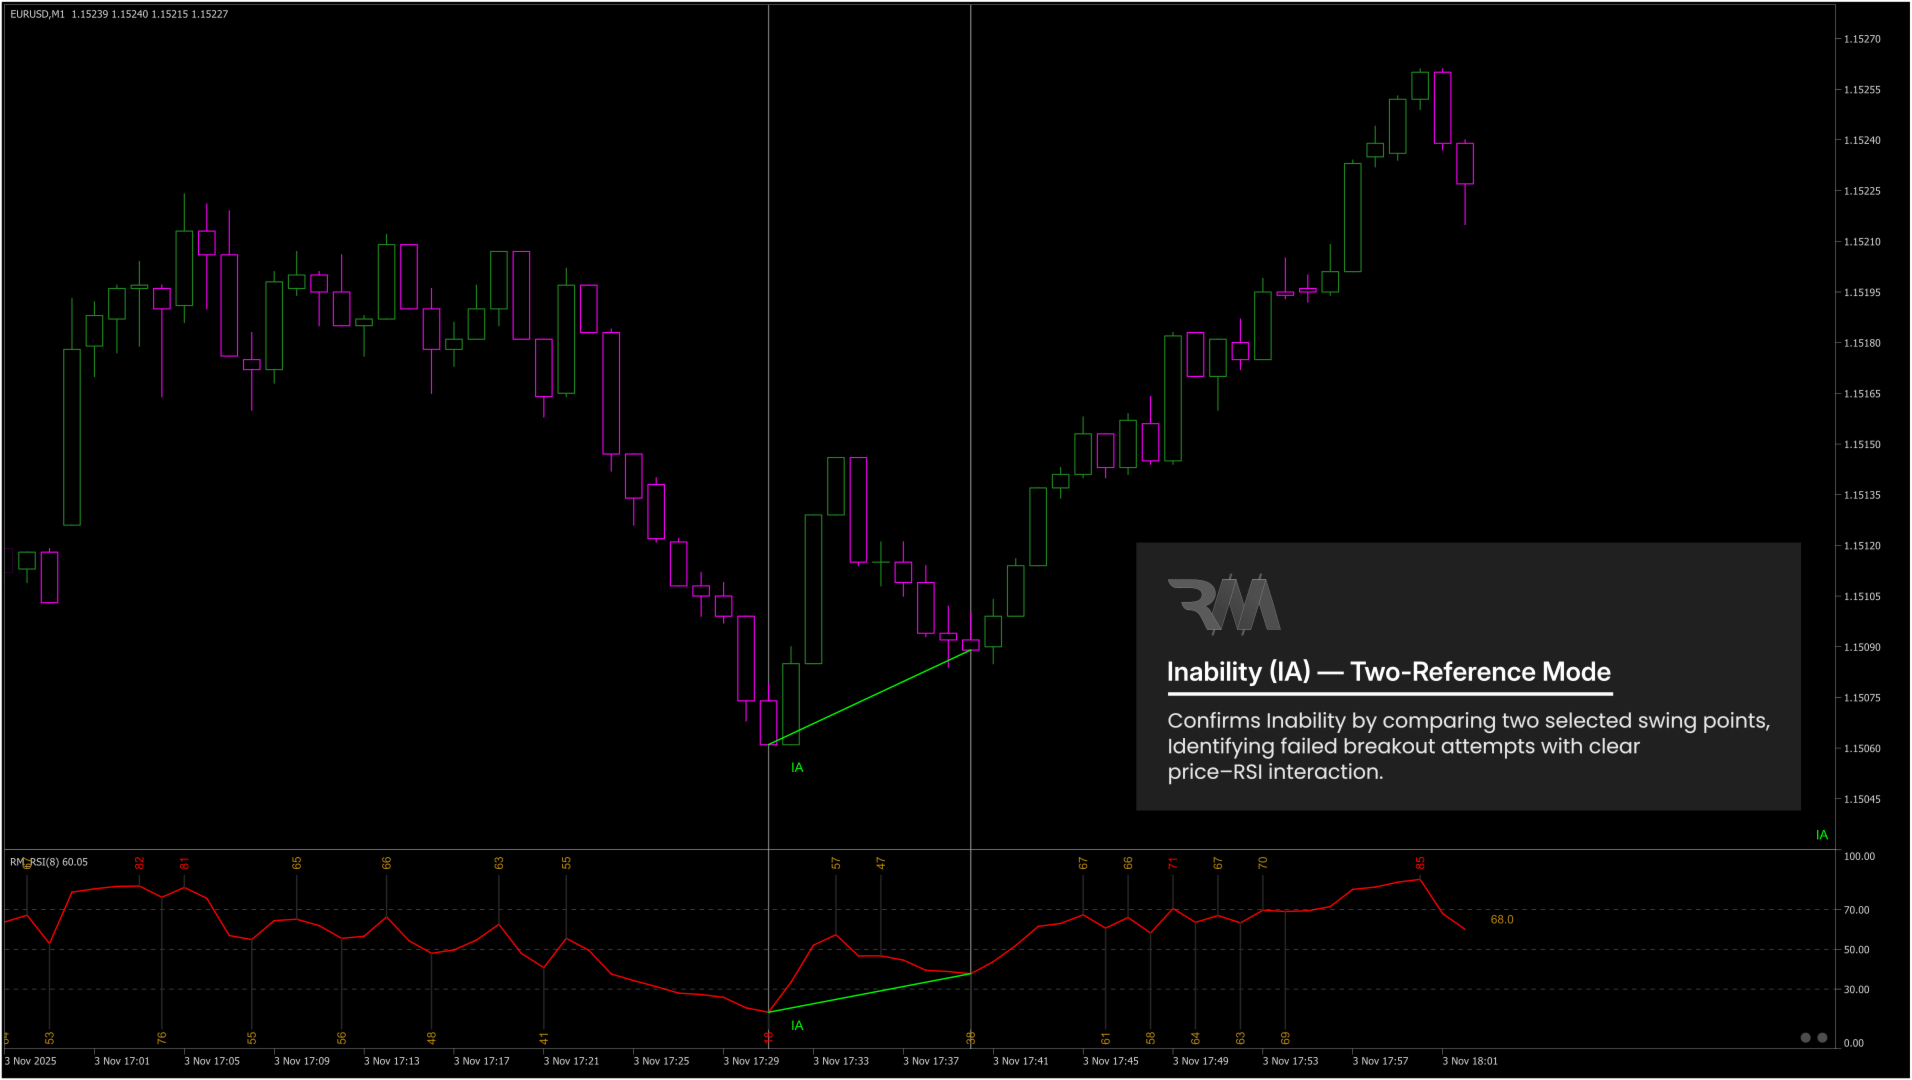
- Inability (IA)
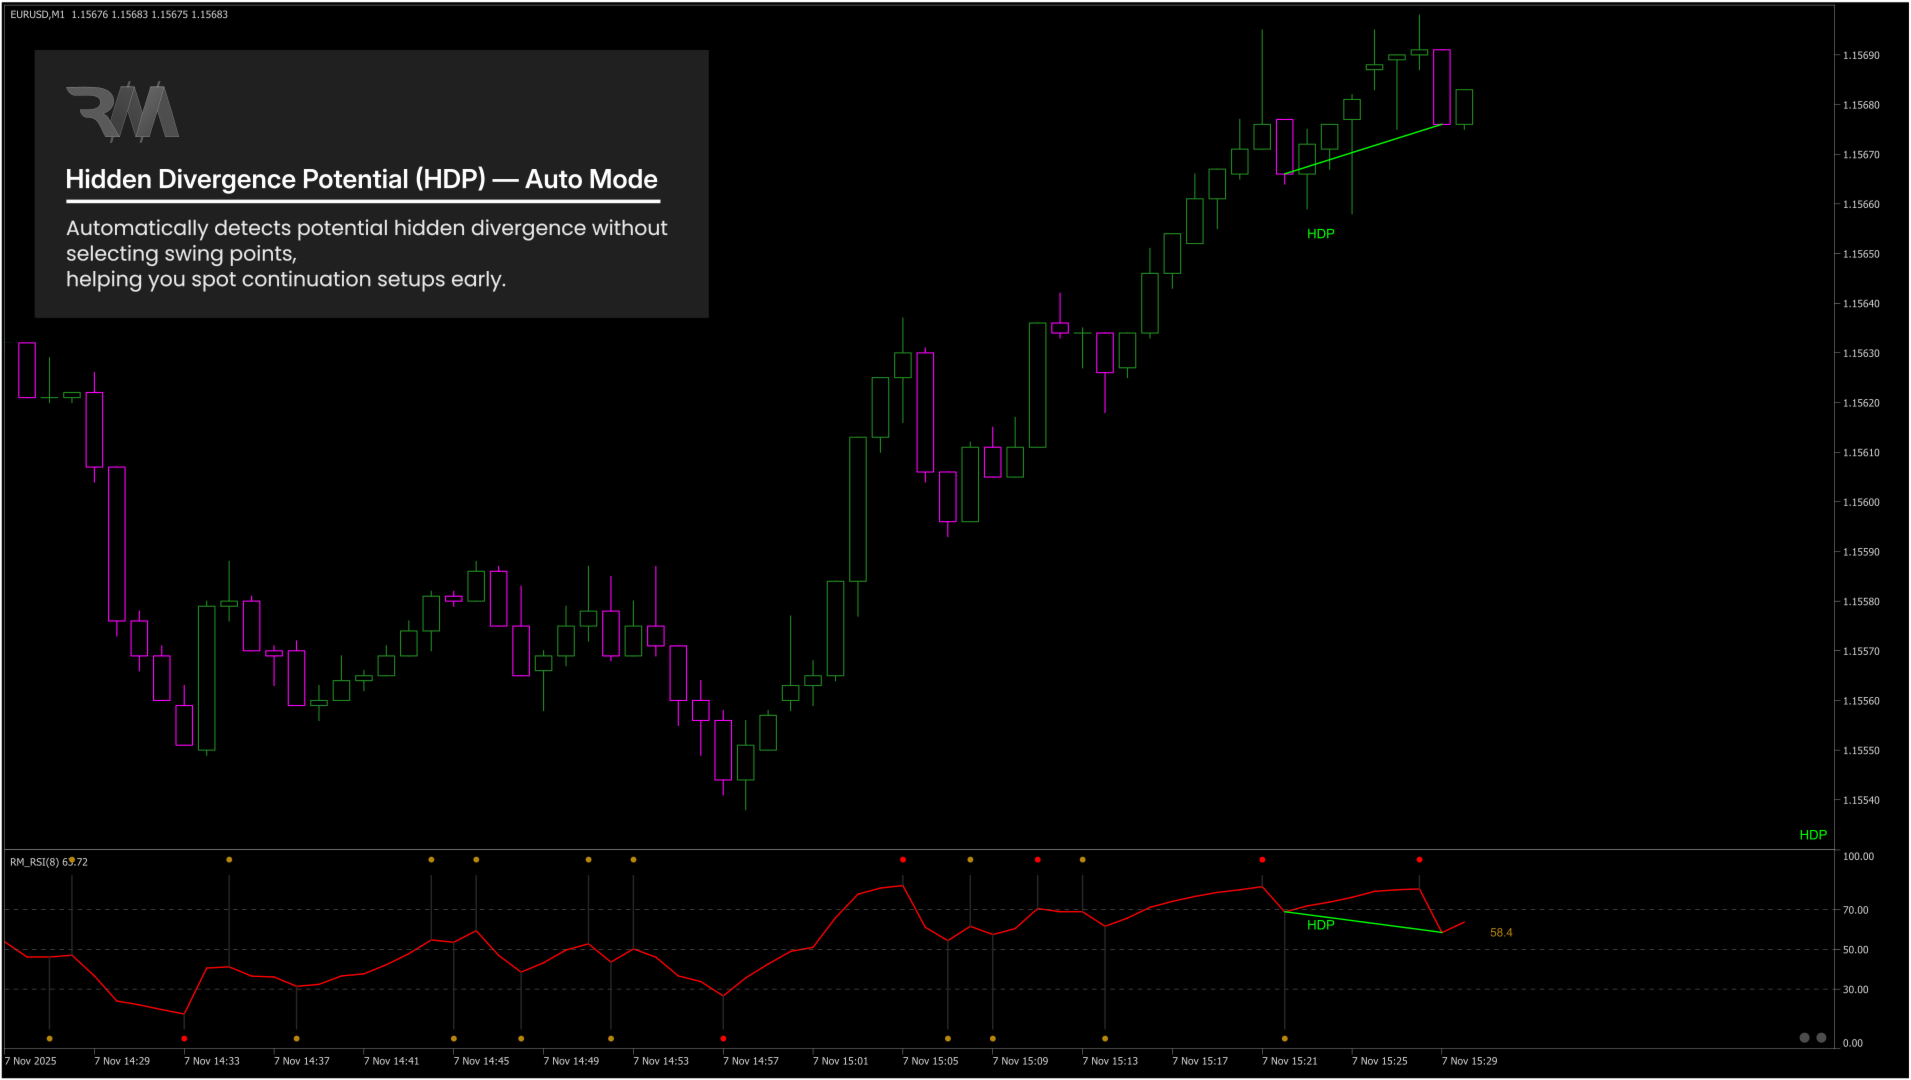
- Potential Divergence (P-DVG)
• True Inability (IA) detection for failed breakouts and breakdowns
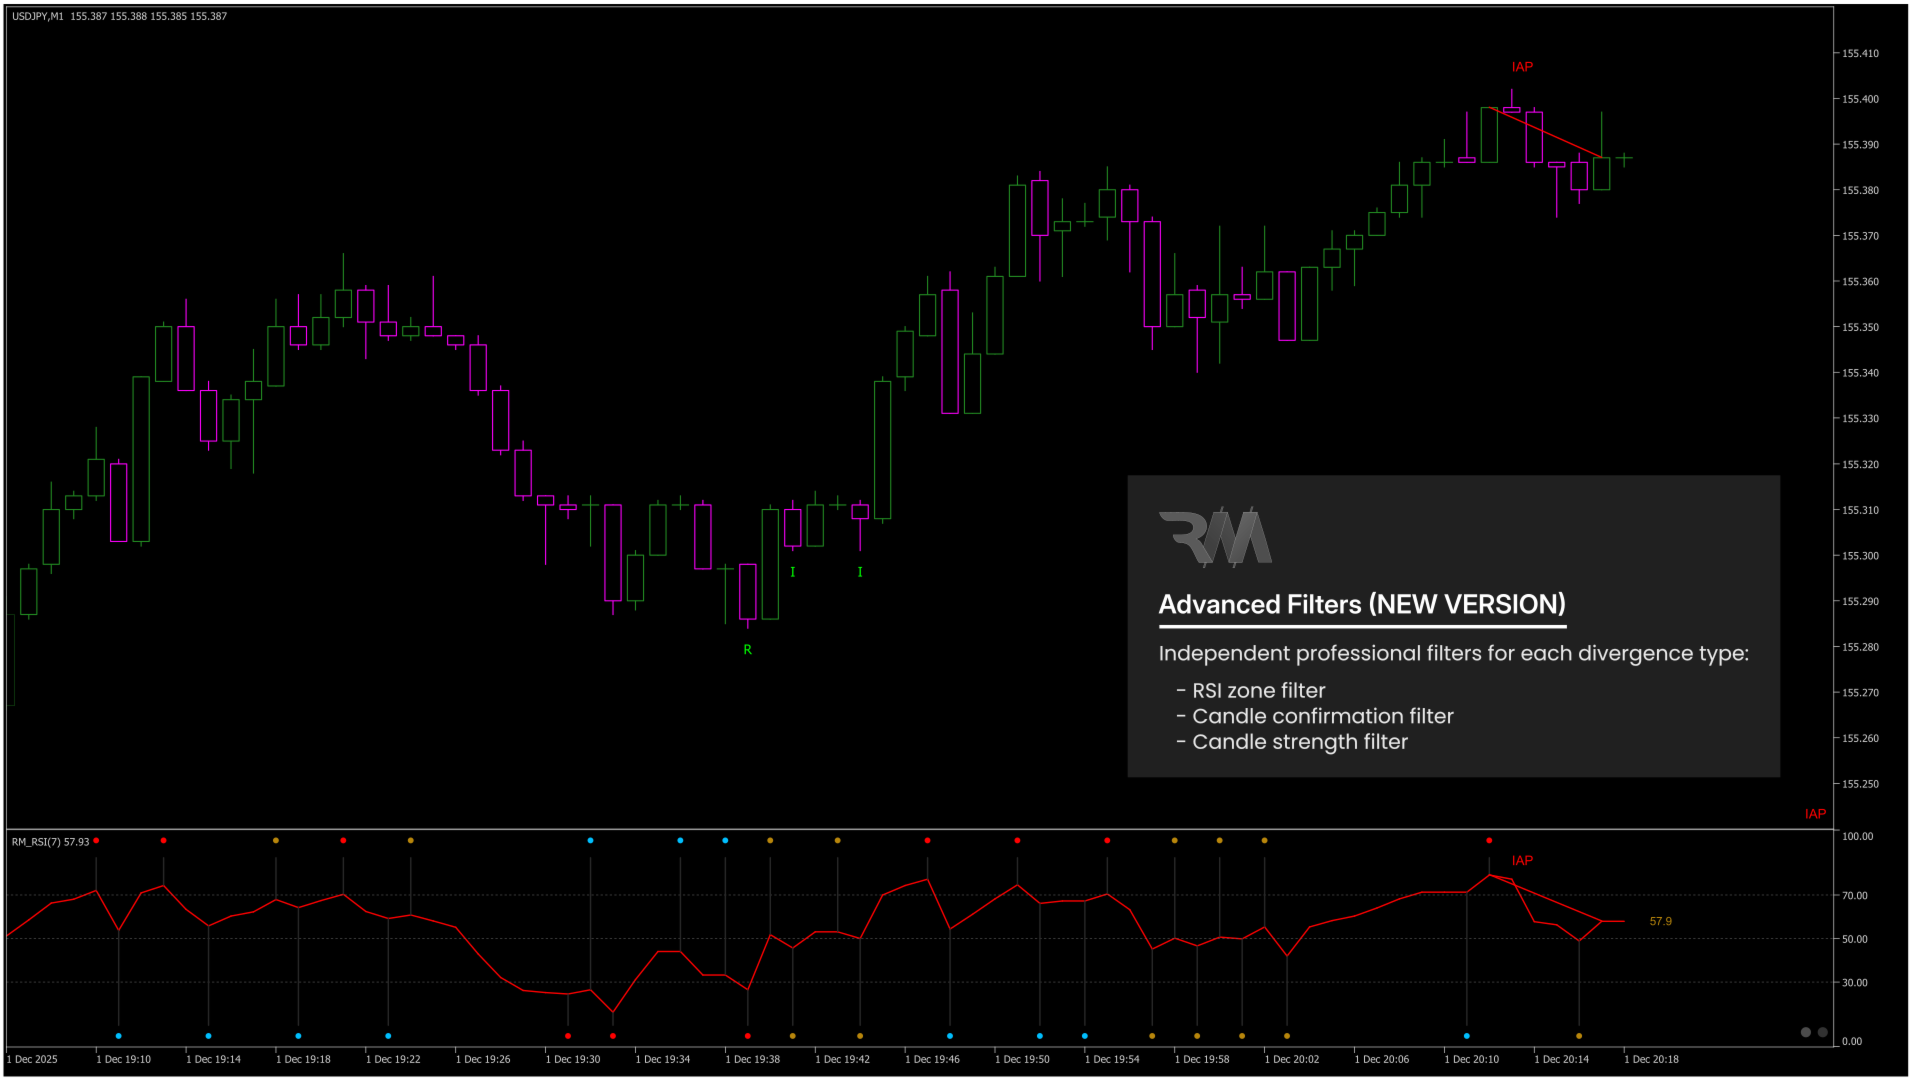
• Independent professional filters for each divergence type (NEW VERSION):
- RSI Zone Filter
- Candle Confirmation Filter
- Candle Strength Filter (0–100 close-location strength)
• Early detection with Potential Divergence modes
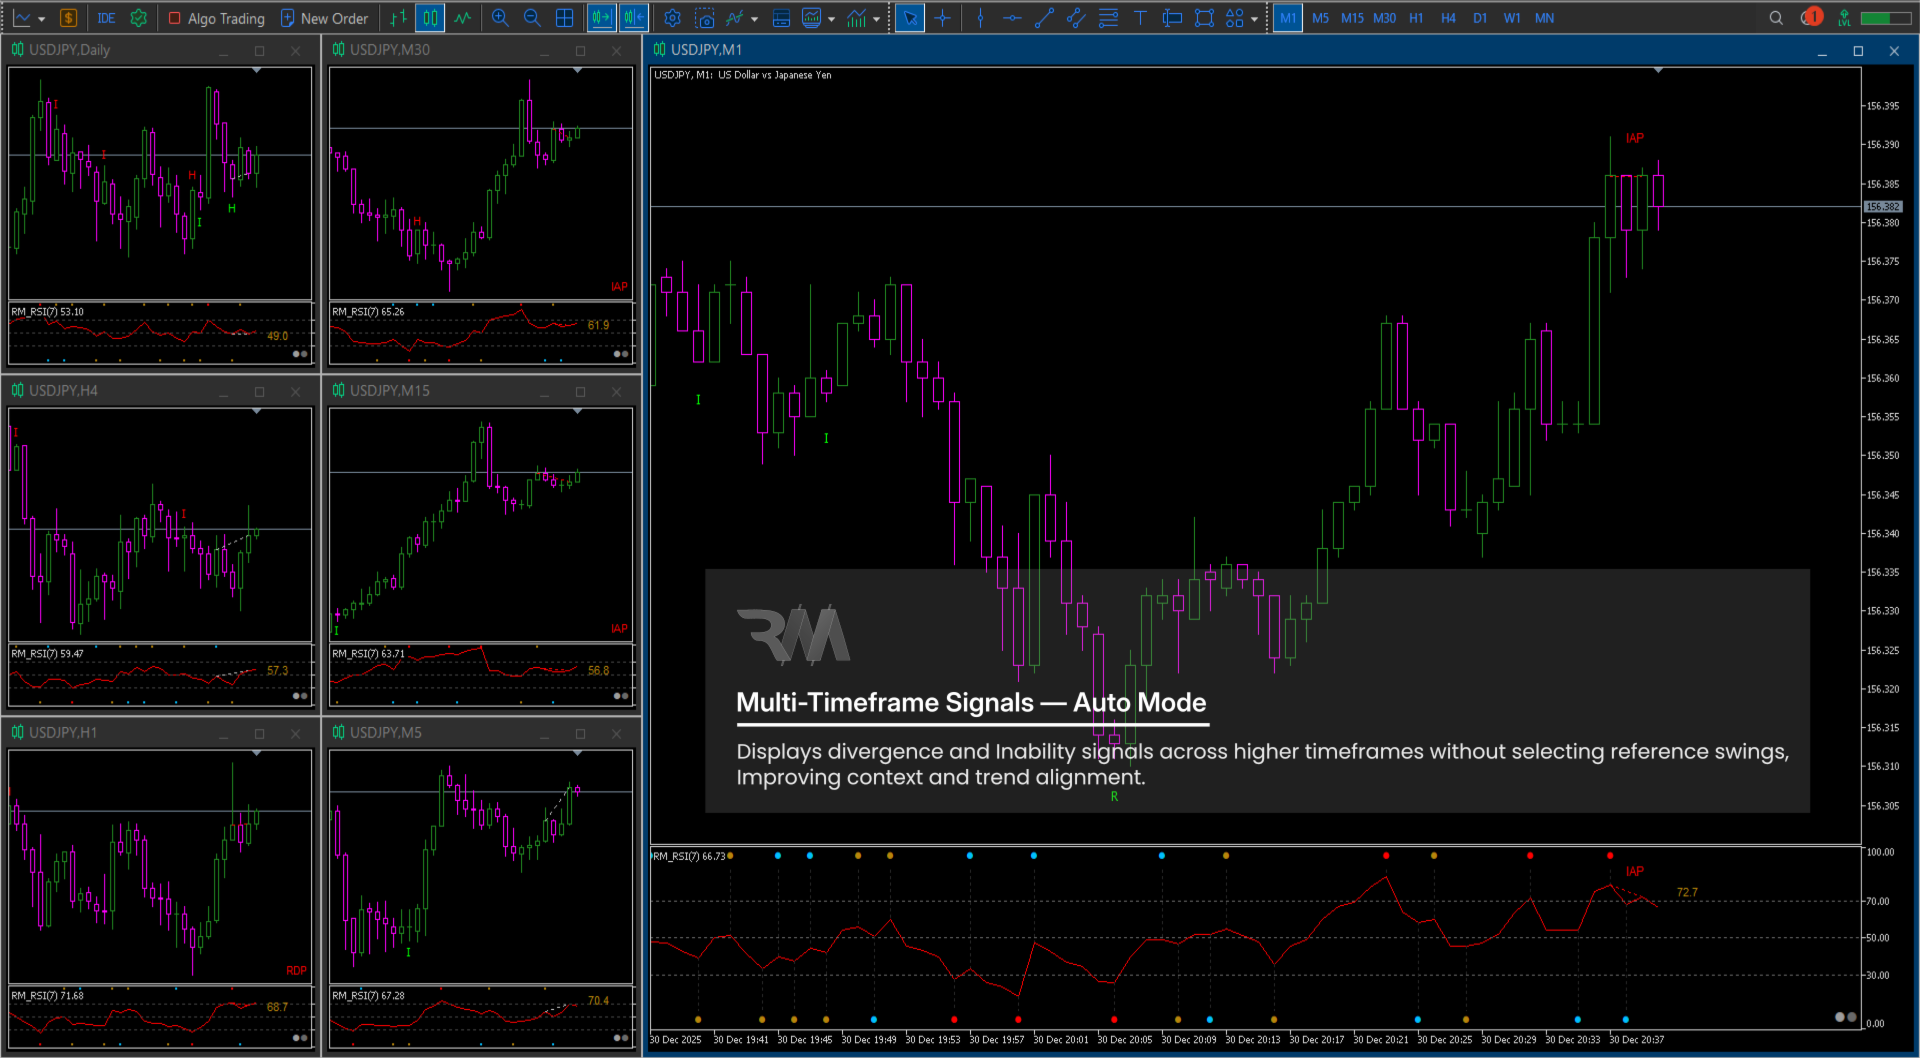
• Manual, reference-based, and fully automatic analysis modes
• Clean and clear visual structure on price and RSI charts
• Full control over colors, labels, fonts, and display modes
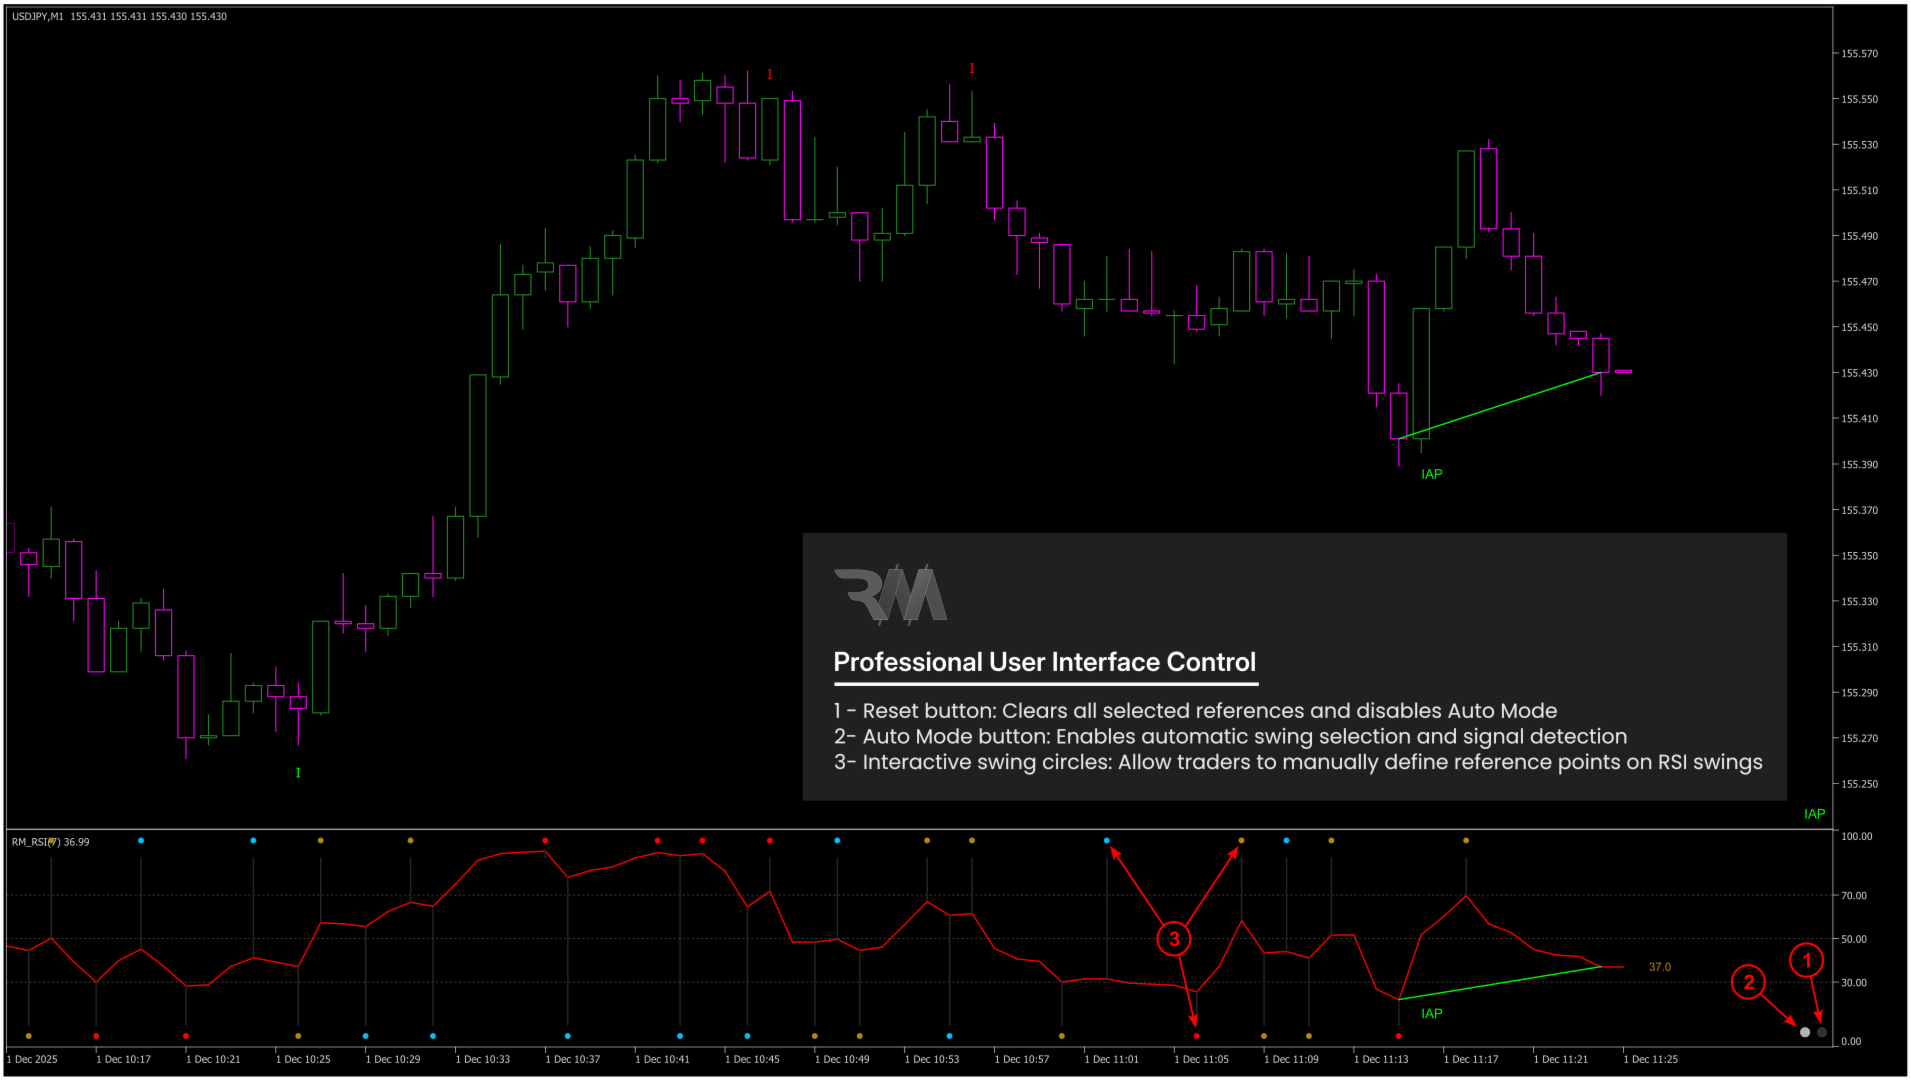
• Built-in Reset button for instant interaction control
• Built-in Auto button for instant interaction control
• Optimized performance for fast-moving markets (e.g. XAUUSD)
• Works on all symbols and all timeframes
• Single-instance protection per chart for maximum stability
==================================================
SUPPORTED SIGNAL TYPES
==================================================
1. Regular Divergence (RD)
Identifies potential trend exhaustion and reversals.
2. Hidden Divergence (HD)
Identifies trend continuation after pullbacks or corrections. (Mostly used in referenced mode)
Identifies failed breakouts or breakdowns caused by structural weakness. (Mostly used in Auto mode)
3. Inability (IA)
Identifies failed breakouts or breakdowns caused by structural weakness.
4. Potential Divergence (P-DVG)
Provides early warning signals before full confirmation.
==================================================
HOW TO USE (PRACTICAL GUIDE)
==================================================
1. Attach RM Divergence Pro to the chart.
2. Observe RSI swing formation in the RSI window.
3. Choose your analysis mode:
Mode 1 – Manual Divergence / IA (Two-Swing Mode)
• Click an older RSI swing.
• Click a newer RSI swing.
• The indicator classifies RD, HD, or IA automatically.
Mode 2 – Potential Divergence / IA (With Reference)
• Click the Auto button.
• Click a previous RSI swing.
• The indicator detects early-forming RD, HD, or IA.
Mode 3 – Potential Divergence / IA (Auto Mode)
• Click only the Auto button.
• The indicator automatically selects the most relevant swing.
4. Use the Reset Button to:
• Clear all manual selections.
• Disable full automatic mode instantly.
==================================================
HOW TO APPLY IN TRADING
==================================================
• Use Regular Divergence (RD) near potential trend exhaustion zones.
• Use Hidden Divergence (HD) during pullbacks in strong trends.
• Use Inability (IA) near key support and resistance levels to identify failed continuation attempts.
• Always confirm signals within market structure and risk management rules.
==================================================
IMPORTANT – DEMO VERSION NOTES (STRATEGY TESTER)
==================================================
The demo version works only inside the Strategy Tester.
Strategy Tester limitations (not indicator limitations):
• Slower object clicking
• Minor redraw delays
• Reduced UI responsiveness
Important:
To see the result of any click or interaction in the Strategy Tester, at least one price tick must be generated.
If the Strategy Tester is paused:
• Press the F12 key after each click to generate a single tick.
• The indicator will then update correctly.
On live charts:
• Interaction is instant
• Drawing is smooth and fully real-time
==================================================
INPUT PARAMETERS
==================================================
RSI — Core Settings
• RSI Period
Defines the calculation period of the RSI.
• Applied Price
Selects the price source used for RSI calculation
(Close, Open, High, Low, etc.).
--------------------------------------------------
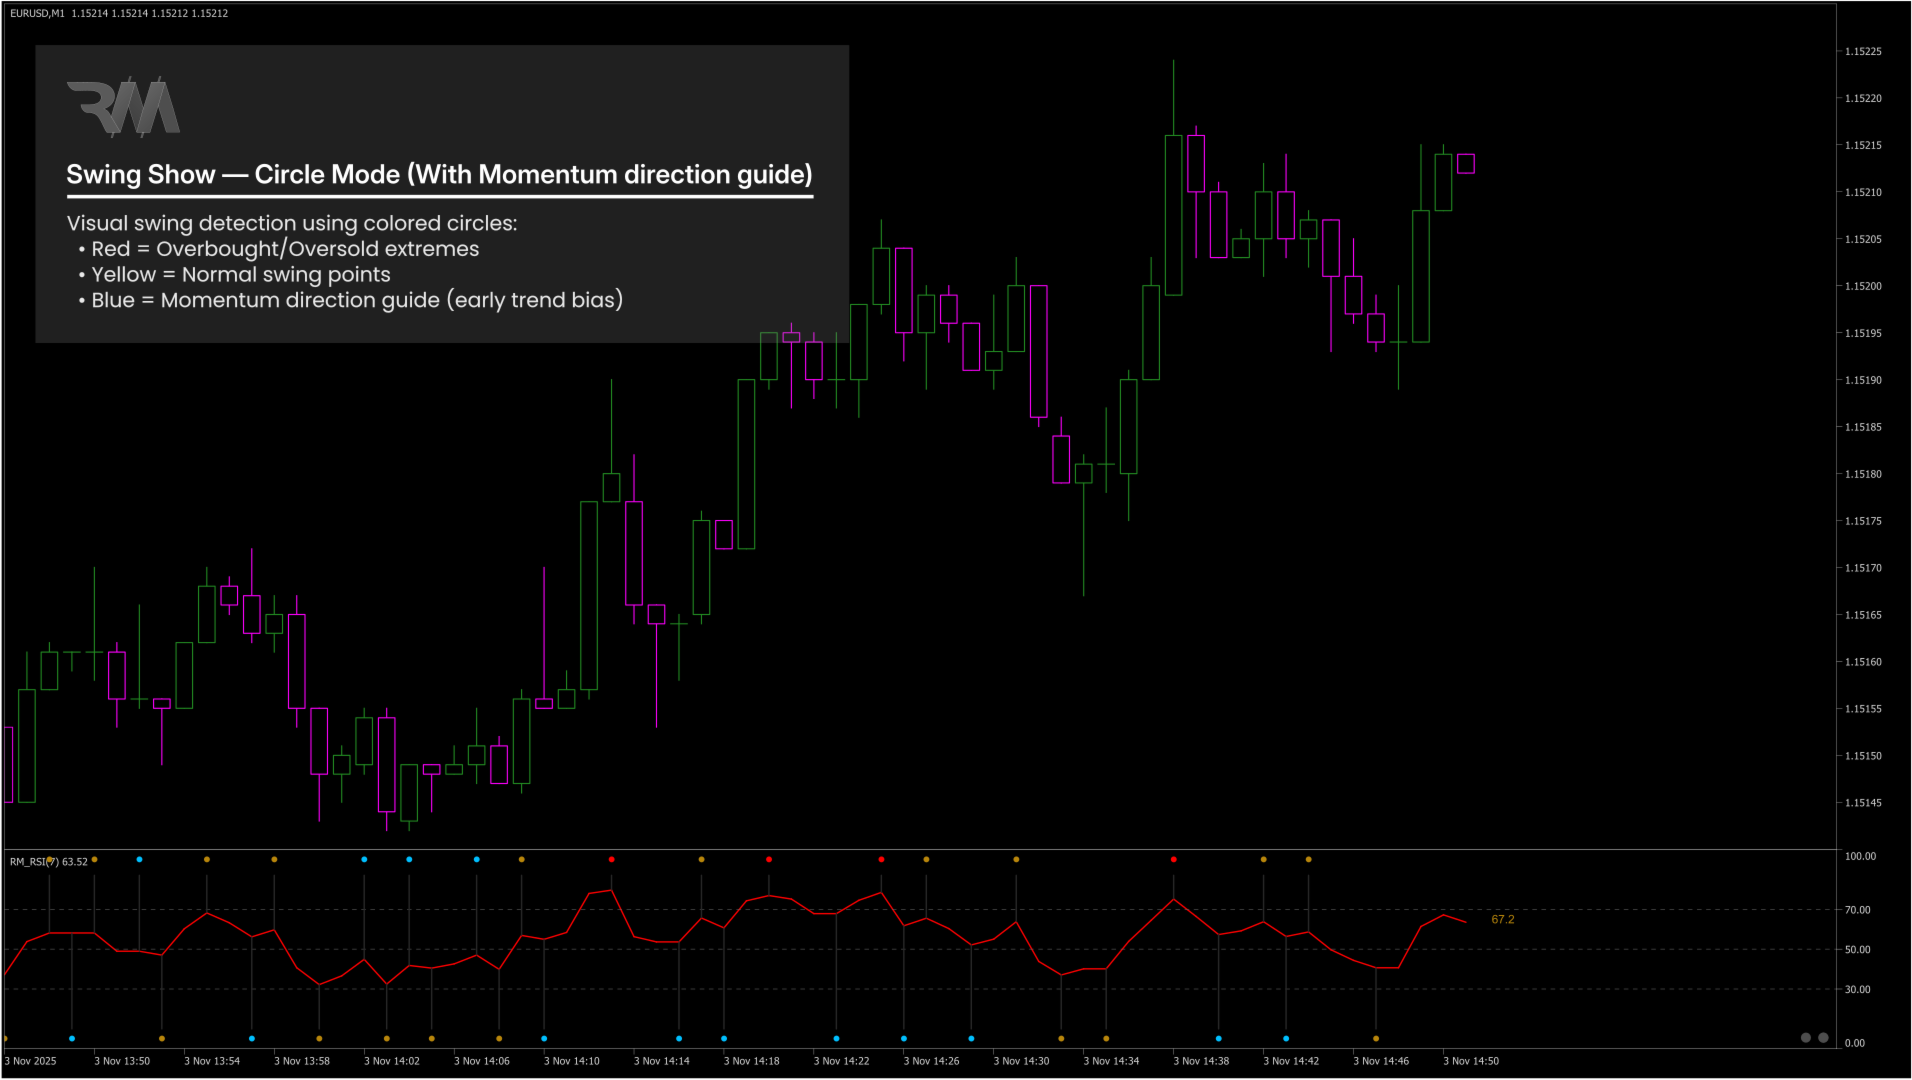
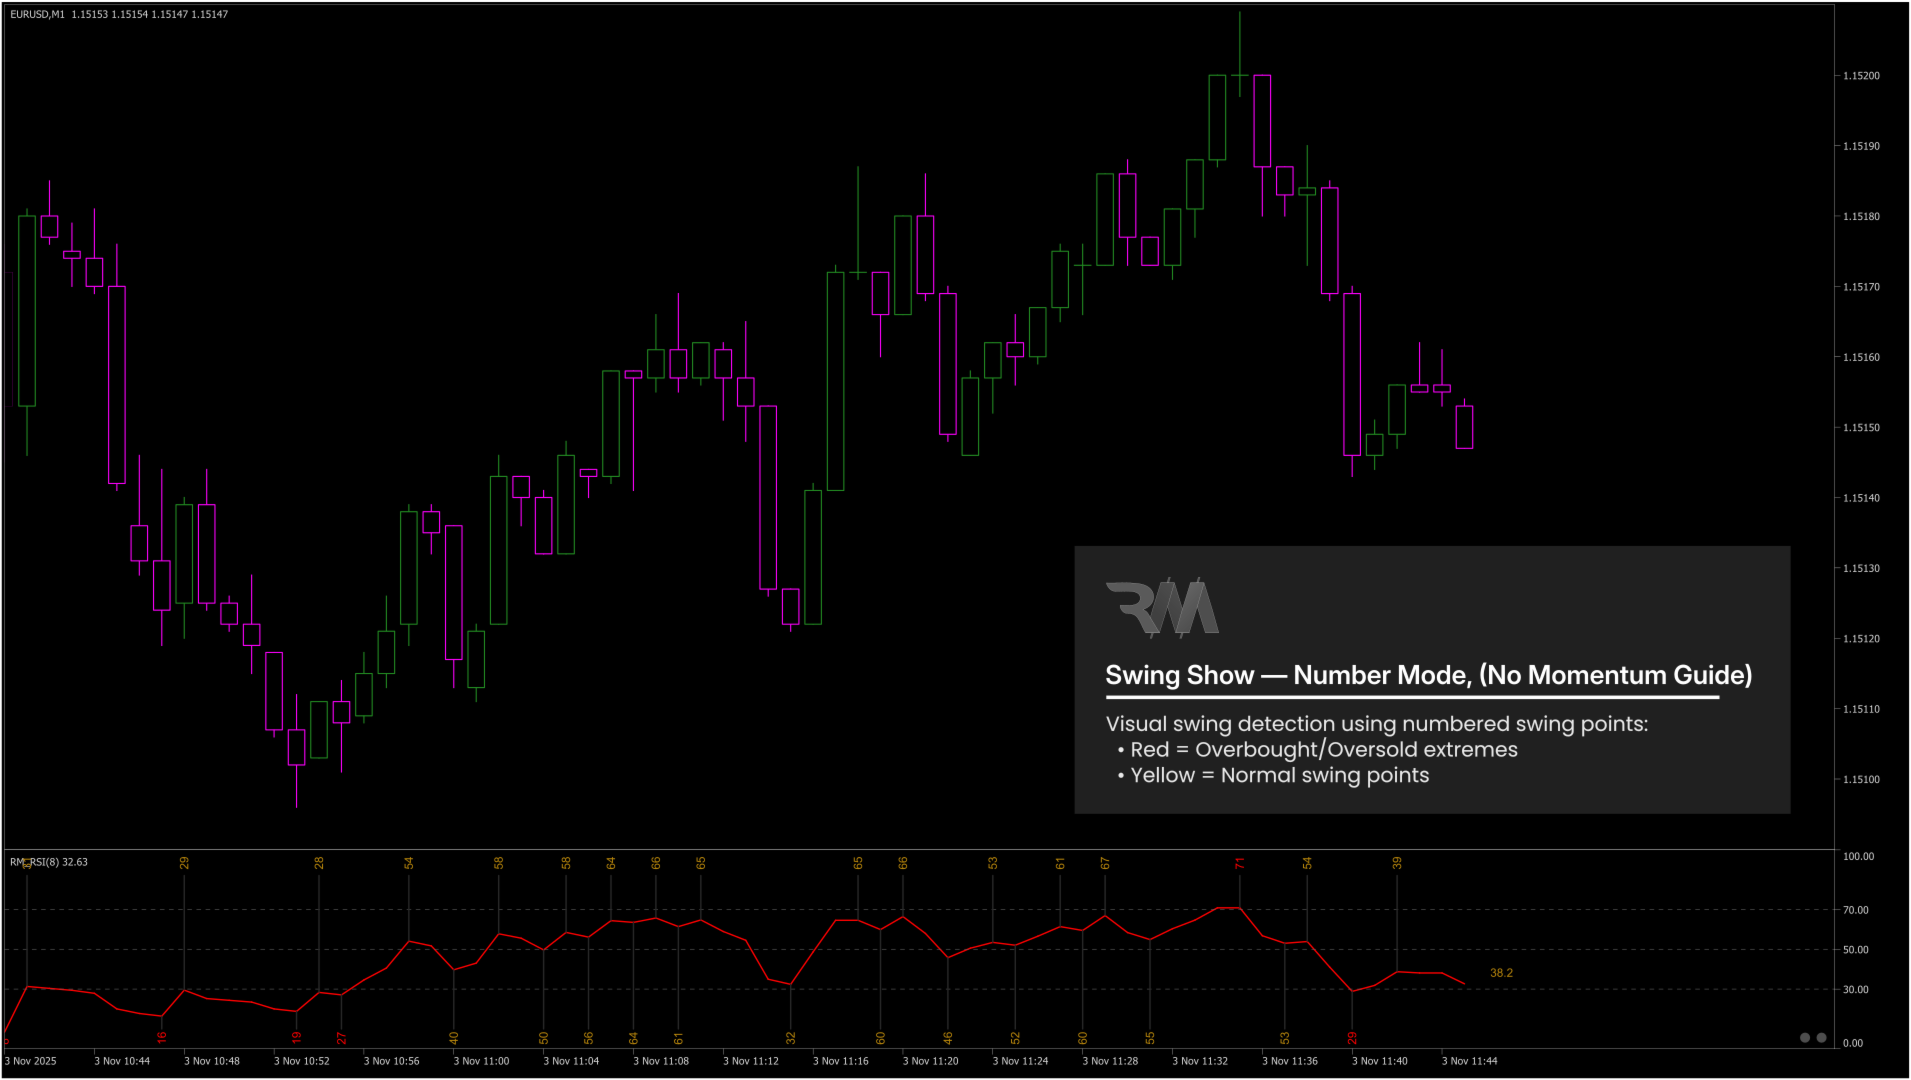
RSI — Swings & Markers
• Number of Swings
Sets how many confirmed RSI swings are calculated and analyzed.
• Swing Display Mode
Displays RSI swings as numeric values or colored circles.
• Font / Marker Size
Controls the size of swing markers and values.
• Swing Price Source
Uses Close price or High/Low extremes for swing comparison.
--------------------------------------------------
Divergence — Labels & Display Mode
• Filter Signals (Master Switch)
Enables or disables all filters.
• History Display (Master Switch)
Enables or disables historical divergence letters (R / H / I).
• History Font
Font used for historical signal letters.
• Divergence Label Mode
Controls where divergence labels are displayed
(main chart, RSI window, fixed corner label, or combinations).
• Fixed Label Corner
Selects the corner position of the fixed divergence label.
• Divergence Label Font Size
Adjusts the font size of divergence labels.
--------------------------------------------------
Regular Divergence (RD) — Filters & Display
• RD: Enable signals (live/potential/history)
Enables Regular Divergence signals.
• RD: Show history letter (R)
Shows historical RD signals (R).
• RD: Use RSI zone filter validation
Validates RD signals based on RSI location.
• RD: Use confirmation candle (Engulf) filter
Requires confirmation candle behavior for RD.
• RD: Use candle strength filter
Filters RD signals based on close-location strength (0–100).
• RD Zone filter: Bullish valid if RSI <=
Maximum RSI for the second swing
• RD Zone filter: Bearish valid if RSI >=
Minimum RSI for the second swing
• RD Engulf filter: Engulf type
Selects how the confirmation candle is evaluated
(Close vs Open or Close vs High/Low).
• RD Candle strength: 0 .. 100
Candle close location compared to high/low
• RD: Bullish signal color
• RD: Bearish signal color
--------------------------------------------------
Hidden Divergence (HD) — Filters & Display
• HD: Enable signals (live/potential/history)
Enables Regular Divergence signals.
• HD: Show history letter (R)
Shows historical HD signals (R).
• HD: Use RSI zone filter validation
Validates HD signals based on RSI location.
• HD: Use confirmation candle (Engulf) filter
Requires confirmation candle behavior for HD.
• HD: Use candle strength filter
Filters HD signals based on close-location strength (0–100).
• HD Zone filter: Bullish valid if RSI <=
Maximum RSI for the second swing
• HD Zone filter: Bearish valid if RSI >=
Minimum RSI for the second swing
• HD Engulf filter: Engulf type
Selects how the confirmation candle is evaluated
(Close vs Open or Close vs High/Low).
• HD Candle strength: 0 .. 100
Candle close location compared to high/low
• HD: Bullish signal color
• HD: Bearish signal color
--------------------------------------------------
Inability (IA) — Filters & Display
• IA: Enable signals (live/potential/history)
Enables Regular Divergence signals.
• IA: Show history letter (R)
Shows historical IA signals (R).
• IA: Use RSI zone filter validation
Validates IA signals based on RSI location.
• IA: Use confirmation candle (Engulf) filter
Requires confirmation candle behavior for IA.
• IA: Use candle strength filter
Filters IA signals based on close-location strength (0–100).
• IA Zone filter: Bullish valid if RSI <=
Maximum RSI for the second swing
• IA Zone filter: Bearish valid if RSI >=
Minimum RSI for the second swing
• IA Engulf filter: Engulf type
Selects how the confirmation candle is evaluated
(Close vs Open or Close vs High/Low).
• IA Candle strength: 0 .. 100
Candle close location compared to high/low
• IA: Bullish signal color
• IA: Bearish signal color
--------------------------------------------------
Divergence — Line Colors & Style
• Color by Divergence Type
Automatically colors lines based on RD / HD / IA.
• Price & RSI Line Colors
Sets divergence line colors on price and RSI charts.
• Label Color by Divergence
Automatically colors labels based on divergence type.
--------------------------------------------------
Style — General Colors
• Swing & Vertical Line Colors
Controls swing and guide line colors.
• Swing Text Colors
Separate colors for normal, extreme, and trend-guide swings.
• Last RSI Text Color
Color of the live RSI value label.
• Divergence Label Text Color
Default label color when not color-by-type.
--------------------------------------------------
UI — Reset & Auto Button
• Reset & Auto Button Color
Sets the Reset & Auto button color.
• Reset & Auto Button Size
Adjusts the size of the Reset & Auto button.
--------------------------------------------------
All input parameters are designed for visual clarity and full user control
without affecting the core divergence logic.
==================================================
FINAL NOTE
==================================================
RM Divergence Pro is not a signal-spam indicator.
It is a structure-driven analytical tool designed to help traders
read the market correctly rather than chase indicator noise.