 MetaTrader 5
 Experts
 Indicateurs
 Bibliothèque
 Utilitaires
 Widgets
 Règles
Regardez les tutoriels vidéo de Market sur YouTube
Comment acheter un robot de trading ou un indicateur
Exécutez votre EA sur
hébergement virtuel
hébergement virtuel
Test un indicateur/robot de trading avant d'acheter
Vous voulez gagner de l'argent sur Market ?
Comment présenter un produit pour qu'il se vende bien
Indicateurs techniques pour MetaTrader 5 - 159
 Les signaux provenant des indicateurs techniques jouent un rôle crucial dans l'ouverture et la clôture des transactions sur les marchés boursiers et les marchés forex. L'essence des indicateurs est une transformation mathématique du prix d'un symbole financier visant à prévoir les changements de prix futurs. Testez les indicateurs techniques pour mieux prédire le comportement du marché et en tirer profit.

OrderFlow Pro - Institutional Order Flow Detector Professional Order Flow Analysis for MT5 OrderFlow Pro is an advanced technical indicator designed to detect and analyze institutional order flow in real-time. The indicator provides traders with comprehensive insights into market dynamics by identifying buying and selling pressure, volume imbalances, absorption zones, trapped traders, and delta divergences. KEY FEATURES Order Flow Detection: Real-time buy and sell pressure calculation with perce

MA MTF Fijo: Smooth Curves, Clean Charts
Eliminates the visual "steps" of multi-timeframe moving averages.
Fixed MA MTF: It offers a smooth and professional line of any higher timeframe directly on your current chart.
Key Points:
No Steps: Real and smooth curve between candles (Goodbye to rough straight lines). High Performance: Optimized code; does not slow down your MetaTrader 5. Maximum Versatility: Supports all 21 timeframes and all methods (SMA, EMA, SMMA, LWMA). Multi-Market: Ideal fo

Swing and Liquidity Sweep Finder is a powerful tool designed to automatically detect swing points and liquidity sweeps on your chart.
It helps traders identify where the market is likely to grab liquidity before reversing, showing both internal and external liquidity zones with high accuracy.
This indicator is ideal for ICT and Smart Money Concept traders who rely on swing structure and liquidity manipulation for their entries and exits.
Our Team Services: If you are want to see our products cl

Composite MA Indicator - Comprehensive Guide Description:
The Composite MA indicator is a sophisticated multi-timeframe trend analysis tool that calculates the average value of multiple moving averages across a user-defined period range. It provides comprehensive market trend visualization through both a color-coded composite moving average line on the chart and an Excel-style panel displaying trend direction across 21 different timeframes. The indicator uses canvas technology for smooth GUI r

Magic History is a detailed trade visualization indicator designed to bring the full story of your trading activity directly onto the chart. If you’re a developer or trader who uses magic numbers, this is made for you. Smart pagination - never lose track of your trades again. Pagination means dividing content into separate pages instead of showing everything all at once.
In the context of your Magic History indicator:
Pagination is a system that lets you view your trades in sections (pages) — f
Advanced ZigZag Histogram with Divergence Detection and Order Flow Simulation ZigDeltaSwingPro is a comprehensive technical analysis indicator for MetaTrader 5, built on the classic ZigZag algorithm and enhanced with modern features such as divergence detection, dynamic histogram visualization, swing pattern recognition, and simulated order flow insights. Designed for scalpers and swing traders alike, it leverages MT5’s internal tick volume to deliver actionable signals—no external data feeds r
Trade Like a Serpent — Calm, Precise, Lethal. The Serpent Strategy equips you with a visual edge — clarity in confusion, precision in volatility, and confidence in timing.
Let your trades strike like a serpent — swift, silent, and accurate. Overview The Serpent Strategy is a powerful custom-built MetaTrader 5 indicator designed to identify high-probability trade zones using a unique combination of market volatility, trend direction, and momentum confirmation.
It visualizes price action in th
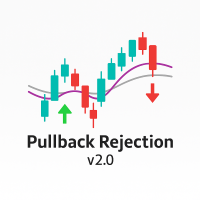
Overview Pullback Rejection v2.0 is a professional-grade visual indicator that spots continuation setups after pullbacks using Heiken Ashi logic and multi-EMA trend bias.
It is designed for scalpers and intraday traders who want clean, rule-based BUY and SELL signals aligned with trend direction only — no repainting, no noise, no counter-trend traps. Trading Concept The indicator combines EMA 7, EMA 50, and EMA 200 to define directional bias: Bias Condition Trades Allowed Bullish EMA7 > EMA200

Capturez les Retournements Avant qu'ils ne se Produisent Ce que Cet Indicateur NE Fait PAS Ce n'est pas un générateur de signaux d'achat/vente. Il ne vous dit pas automatiquement quand entrer ou sortir des transactions. Ce que Cet Indicateur Fait Early Reversal Detector identifie les changements dans le comportement des prix pour déterminer avec précision les points d'entrée optimaux. Comment Ça Marche L'indicateur crée des bougies dans un panneau séparé qui ressemblent aux bougies de prix sur v

ICT Unicorn Hunter – Multi-Timeframe Smart Setup Detector IMPORTANT: This is a Multi-Timeframe Scanner, looking for 'Unicorn' setups. A Unicorn in this definition is a liquidity sweep, market structure shift and creation of a Fair Value Gap overlapping with the last opposite-close candle before the liquidity sweep (breaker). This scanner does NOT provide visualisation of the Unicorn on the chart.
For visualisation, use the Unicorn Tracker indicator, which is designed to work with the Unicorn

# Bougies de Rallye, de Chute et de Base - Reconnaissance de Figures Professionnelle
## Présentation
L'indicateur Bougies de Rallye, de Chute et de Base est un système professionnel d'identification de figures de chandeliers conçu pour aider les traders à repérer les zones d'offre et de demande à forte probabilité. Cet indicateur identifie et met automatiquement en évidence trois types de chandeliers essentiels qui constituent la base des stratégies de trading institutionnelles : les bougies

Blogs MQL5 = https://www.mql5.com/en/blogs/post/776162 Version MT4 = https://www.mql5.com/en/market/product/188797 Version MT5 = https://www.mql5.com/en/market/product/154022
CONTRARIAN ZONES [tambangEA] est un indicateur professionnel de zones de marché conçu pour identifier les zones potentielles de retournement en combinant la structure des « swings » (oscillations), les conditions de momentum, la volatilité, le comportement des volumes, les caractéristiques de rejet et l'historique des int

Indicateur Institutionnel de Compression de Liquidité Cet indicateur mesure en temps réel le resserrement de la liquidité à l’aide de la largeur normalisée des Bandes de Bollinger, du volume et du spread moyen, afin d’identifier les phases de compression avant les mouvements de prix importants. Affichage :
Fenêtre séparée de style professionnel, avec un histogramme “Compression Score” et une ligne de seuil (“Threshold”). Caractéristiques Clés Détection précoce : Repère les zones de contraction
Signal Histogram — c'est un indicateur technique fiable pour la plateforme MetaTrader 5, destiné à déterminer visuellement la tendance actuelle en comparant le prix de clôture avec la moyenne mobile. L'indicateur affiche un histogramme dans une fenêtre séparée : les barres vertes indiquent que le prix est supérieur à la moyenne, tandis que les barres rouges indiquent que le prix est inférieur ou égal à la moyenne. Cette approche permet d'évaluer rapidement la direction de la tendance et d'ident
Fibo AUTO Pro: Redefining Fibonacci Analysis - Smarter, More Intuitive, More Efficient Product Overview
Fibo AUTO Pro is a professional-level technical analysis indicator designed specifically for modern traders. Based on the classic Fibonacci retracement theory, it has been comprehensively enhanced with intelligence to address the pain points of traditional drawing tools in terms of efficiency, visualization, and accuracy. Fibo AUTO Pro is not merely a line-drawing tool; it is your intellige
Mean Reversion Probability – Indicateur de Retournement Statistique Description courte
Indicateur institutionnel qui calcule la probabilité statistique de retour vers la moyenne mobile 200, à partir de l’analyse des sur-extensions historiques. Il identifie les zones de fatigue du marché avec une précision quantitative. Fonctionnalités principales
Analyse statistique avancée – Base de données de plus de 500 extensions historiques pour calculer des probabilités réelles
Score de probabilité (0–99

ARB est un indicateur conçu pour identifier les opportunités de breakout à haute probabilité grâce à un système de canaux ATR adaptatifs et un scoring multi-facteurs précis (0 à 100).
Il combine volatilité, volume, momentum et tendance multi-timeframe pour offrir des signaux filtrés, visuels et exploitables en temps réel. PRINCIPES DE FONCTIONNEMENT L’indicateur repose sur le concept d’ Adaptive Range Breakout (ARB) , une approche moderne du trading de cassures qui ajuste automatiquement ses seu
Enhance your trading strategy with this indicator from tr1cky.com This indicates buying and selling strength. Look for correlation on multiple timeframes for best indication and confidence in your trade. This indicator is simply RSI-MFI for buying and MFI-RSI for selling and is used in the successful expert advisors by tr1cky,com that just use this indicator for execution.

Hi Traders,
On purchase this tool we will give lifetime free updates for this tool
you can contact me how to use this tool better or your suggestion for improvement
This tool will work on any accounts
Where When Enter Exit – Trade Plotter helps traders easily see, track, and review their sell trades directly on the chart.
It clearly shows where you entered, when you exited, and why , so you can quickly learn from every trade. Key Features Auto Plot Entries & Exits –
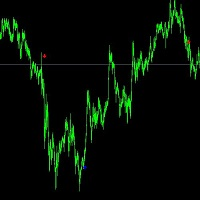
The 5-minute trend buying point reference for gold has an accuracy rate of 90%. All signals are not redrawn, Parameters need to be adjusted for different varieties and periods. The default value for gold trading is the 5-minute period. You can carefully study what direction guidance is suitable for you. We hope you can make money and it is worth referring to for professionals and novice traders. Stop loss is at the end of the line, real-time signal. Welcome to use it. If you have any question

Hidden Trend Channel Project 17 Tool
SPECIAL NOVEMBER SALE is now finished. Price goes back to normal.
This is an Automated Tool for Multi Timeframe Trend Channel Analysis Visualization with Intelligent Range Market, Trending Market, Reversal, Breakout Detection. It draws multiple Trend Channels with multiple sub-trendlines levels inside the channel for perfectly give you the trader, the crystal clear Trend channels where price trend direction is moving.
This tool is accurately useful for T
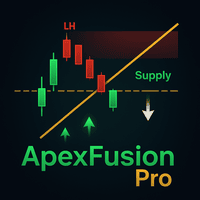
Reach the apex of precision trading with ApexFusion Pro — a next-generation indicator that fuses RSI divergence , diagonal support & resistance trendlines , Order Blocks , and Fair Value Gaps (FVG) into one visual system. Built for professional traders, it reveals the hidden balance between momentum and liquidity , showing where institutions accumulate, where reversals form, and where the true market flow begins. Key Features: Detects RSI divergences (bullish & bearish) with visual signals Dr
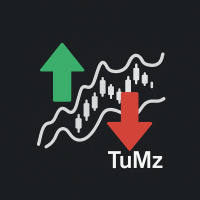
TuMz TrendSignal – Your Reliable Trading Compass in Volatile Markets Tired of noisy indicators that give false signals? Meet TuMz TrendSignal — a clean, non-repainting, ATR-based trend indicator built for serious MT5 traders. Using a smart combination of mid-price (HL/2) and adaptive ATR bands , TuMz TrendSignal dynamically draws: Green trend line during uptrends Red trend line during downtrends Dotted support/resistance zones that adjust to market volatility Clear buy/sell arrows at tr

CVD (Cumulative Volume Delta) for MT5 CVD (Cumulative Volume Delta) for MT5 Simple, fast CVD for volume and order flow trading. It tracks net buying vs selling pressure and plots CVD as candles. The Data Window also shows tick count per candle. What it does Accumulates volume delta from ticks or a chosen timeframe Optional reset: No Reset, Current Chart Period, or a specific timeframe Works on any symbol and timeframe How it’s calculated Tick-based: each incoming tick is labeled as buyer- or sel

- What does this do?
This indicator draws the standard session boxes used in Steve Mauro's BTMM (Beat the Market Maker) method:
• Asian session boxes
• Brinks boxes: London and New York session changeover boxes
• New York session boxes
• Stop-hunt boxes
- Is this for me?
If you use the BTMM trading system and you are on MetaTrader5, this is for you.
• The one provided by Steve Mauro was for MetaTrader4. This is its first MetaTrader5 adaptation. You cannot find this anyw
Indicateur de lignes de session bancaires
Les lignes de session bancaires mettent automatiquement en évidence les moments de la journée où les prix fluctuent. Cet outil aide les traders avertis à identifier et suivre clairement les principales sessions de négociation institutionnelles (Asie, Londres et New York) grâce à des lignes de session entièrement personnalisables.
Conçu pour les traders qui recherchent clarté et précision dans le suivi des cycles de volatilité.
Pourquoi les lignes de
Shadow Pulse Brève description Shadow Pulse est un indicateur professionnel pour identifier les points de retournement basé sur la méthode de retour à la moyenne. Il génère des signaux d'achat et de vente très précis en utilisant un système de filtrage intelligent à plusieurs niveaux. Stratégie de trading L'indicateur est conçu pour fonctionner sur toutes les périodes de M1 à H4 et affiche des résultats exceptionnels lors du scalping de l'or (XAUUSD). Il peut être appliqué efficacement tant pour

Find potential stop-run zones before price gets there. Bank Levels Tracker highlights potential liquidity levels around obvious swing highs and lows, where retail stop losses may cluster. These areas can become important stop-run zones, often watched by Smart Money Concepts traders for possible liquidity grabs, fakeouts, and reversal setups. Instead of manually marking the same highs and lows over and over again, Bank Levels Tracker plots the levels in advance and sends an instant alert when pr
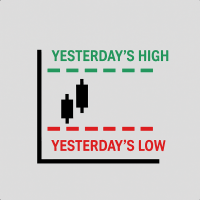
- What does this do?
This indicator draws previous day's high and low as blue tracers on the chart. It is used in Steve Mauro's BTMM (Beat the Market Maker) method.
- What improvement does this indicator offer?
The original version provided by Steve Mauro was for MetaTrader4. This is the first adaptation for MetaTrader5.
Highly optimized for computing resources. It does not affect your computer's performance at all.
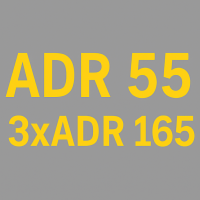
- What does this do?
This indicator show the ADR and 3xADR on the chart. It is used in Steve Mauro's BTMM (Beat the Market Maker) method.
It also mark the ADR High and ADR Low as vertical line segments.
- What improvement does this indicator offer?
The original version provided by Steve Mauro was for MetaTrader4. This is the first adaptation for MetaTrader5.
Highly optimized for computing resources. It does not affect your computer's performance at all.

Indicateur MT5 d’aide à la décision qui visualise la structure du marché avec deux éléments complémentaires: des zones adaptatives de support/résistance et un canal de tendance calculé par régression. Les zones s’ajustent à la volatilité (ATR) et ne s’impriment qu’après validation d’un pivot pour réduire le bruit. Le canal “meilleur ajustement” montre la pente dominante et des limites parallèles basées sur l’écart moyen, tandis que des canaux alternatifs (optionnels) apportent une lecture de co

Super-Accurate ADR Scalping Machine for MT5
The 200 FREE download promotion has ended. The price has now been updated. Thank you, everyone! Checkout many example setups here, Happening Every Day : https://www.mql5.com/en/market/product/154469/comments
Love it? Hate it? Let me know in a review! Feature requests and ideas for new tools are highly appreciated. :) What It Does:
The ADR Lines Indicator automatically calculates the Average Daily Range (ADR) and plots dynamic support and resis

PICO RSI KF — RSI with Kalman Filtering The PICO RSI KF indicator was designed especially for scalpers and day traders who need to make fast and confident trading decisions .
It applies a 1D Kalman Filter to a volume-weighted RSI , creating a smooth and responsive signal that highlights the true turning points in market momentum. Unlike traditional oscillators, PICO RSI KF is not meant to act alone.
It is a complementary tool , ideal for confirming signals from other systems or strategies such a

Overview
The Ultimate RSI Indicator for MT5 is an advanced oscillator designed to provide a more adaptive and dynamic interpretation of market momentum compared to the traditional RSI. It incorporates range normalization, adaptive smoothing, and flexible averaging methods to enhance responsiveness and reduce lag. How It Works
Unlike the standard RSI, which only measures relative price strength, the Ultimate RSI dynamically adjusts to recent price range expansions and contractions. It calculate
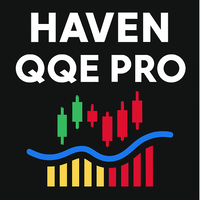
Haven QQE PRO - Votre Guide Visuel des Tendances sur Toutes les Unités de Temps Découvrez le Haven QQE PRO – un outil pratique basé sur l'algorithme QQE, conçu pour résoudre la tâche principale d'un trader : identifier rapidement la tendance actuelle et trader dans sa direction. L'indicateur analyse les données de plusieurs unités de temps simultanément et montre clairement qui domine le marché — les acheteurs ou les vendeurs. Autres produits -> ICI . Oubliez la nécessité de basculer entre
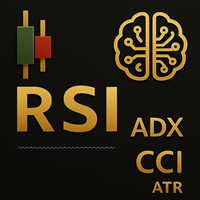
This RSI, ADX, MA, ATR, CCI MTF Dashboard v1 – Professional Multi-Timeframe Consensus ========================================================================
Professional-grade Multi-Timeframe (MTF) Dashboard with Intelligent Weighted Consensus A powerful, clean, and CPU-optimized visual tool that combines RSI, ADX, EMA, ATR, and CCI across up to 6 timeframes (W1 to M5) with a dynamic consensus engine.
Key Features: • Real MTF analysis using native iRSI, iADX, iMA, iATR, iCCI – no repaint
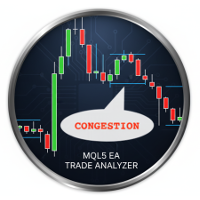
Accumulation zone indicator that identifies congestion caused by a large initial candle containing, between its high and low, the close of at least four subsequent candles. This indicator allows you to identify accumulation zones that can generate market price accelerations. Useful for analyzing historical data (you can freely configure the number of historical candles to analyze and the number of candles forming the congestion) and building your own trading strategy.

Indicator Name: BreakingConfirmedLevel
Type: Professional indicator for detecting confirmed breakouts of strong price levels Description:
The BreakingConfirmedLevel indicator is an advanced tool designed to detect confirmed breakouts of strong price levels in the market. It relies on precise price action analysis and multi-layer confirmation logic before generating any signal. This ensures highly accurate entry points after a real breakout, minimizing false signals and increasing consistency in

Trend Regularity Adaptive Moving Average Indicator for MT5
TRAMA Indicator for MT5 Overview
The Trend Regularity Adaptive Moving Average (TRAMA) is an intelligent adaptive moving average that dynamically adjusts its sensitivity based on market structure and trend consistency. Unlike standard moving averages, TRAMA reacts to how frequently new highs or lows are formed within a defined period, providing an adaptive balance between trend-following precision and range stability. How It Works
TRAM
The Trend Force indicator is a professional analytical tool designed to accurately measure the strength of the overall market trend . It works on all currency pairs and timeframes , and is especially effective in highlighting strong and stable trends that traders can confidently act upon. Trend Force utilizes an advanced algorithm to gauge market momentum, clearly indicating the strength of bullish or bearish trends. This makes it easy to make informed trading decisions, either by relying on it
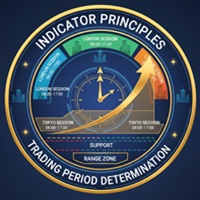
RangeZone Indicator General Overview: Global Exchange Trading from East to West World financial markets operate on the principle of continuous trading sessions, where activity moves with the sun from one financial center to another. Understanding this dynamic is key to successful trading! How Trading Moves Around the World: Asian Session (Sydney, Tokyo): Opens first, sets the tone for daily volatility Japanese yen, Australian dollar, Asian indices Often forms key support/resistance level

This system is very useful for trading because it solves several classic problems: 1. Objectivity & Precision Benefit: It eliminates the trader's personal bias. Every trader might draw a trendline slightly differently, but this indicator uses a precise mathematical logic (Fractals) to find the pivot points. The resulting lines are objective and consistent every time. 2. ️ Dynamic Updates Benefit: Your chart is always current. As soon as a new pivot is confirmed, the new trendline is drawn au

SMC Indicator for MT5 – Trade Like Institutions Unlock the power of institutional trading with the Smart Money Concepts (SMC) Indicator for MetaTrader 5 . Designed for traders who want to go beyond retail strategies, this advanced tool helps you identify market structure shifts, order blocks, liquidity zones, and fair value gaps with precision and clarity. Key Features: Automatic Market Structure Detection : Instantly spot Breaks of Structure (BOS), CHoCH, and trend shifts. Multi-Timeframe

Trendlines with Breaks Overview The Trendlines with Breaks indicator automatically detects and plots pivot-based trendlines, dynamically adjusting their slope and steepness to highlight significant breakout events. Designed for traders who rely on price action and market structure , this tool provides an automated, real-time way to track evolving momentum and breakout confirmations . How It Works The indicator identifies swing highs and swing lows , connecting them to form adaptive trendlines ba

Super Trend Entry Signal Indicator is a powerful trading tool designed to identify precise entry points based on market volatility. Using the Average True Range (ATR) as its core, this indicator dynamically adjusts to current market conditions — helping traders spot potential breakout or reversal opportunities with confidence. Key Features: - Volatility-Based Entries: Calculates entry zones using real-time ATR values for adaptive precision. - Multi-Timeframe Support: Works seamlessly on any time

The indicator is stable on noise fluctuations in price and quickly reacts to the trend. It is based on an algorithm from a system of hyperbolic functions that allows you to aggressively smooth the flat with minimal lag on the trend. It can be applied directly to the price chart, to itself, or to other indicators in order to eliminate false signals. The main purpose of the indicator is to smooth out small sawtooth price movements as much as possible. The higher the Hyperbolic parameter, the stron

BVCandleView est un indicateur innovant qui offre aux traders discrétionnaires un avantage visuel en arrondissant les données de prix. Combiné à un service gratuit de création de symboles personnalisés, il permet d’afficher dans MetaTrader 5 des graphiques en ticks inspirés de la méthode Bob Volman. Des chandeliers arrondis et colorés rendent chaque mouvement de tick immédiatement perceptible. Manuel rapide Installation Copiez BVCandleView.mq5 dans MQL5/Indicators . Redémarrez MetaTrade
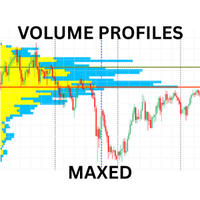
Advanced Volume Profile Indicator for MT5
Transform your trading with professional-grade volume analysis. This comprehensive volume profile indicator delivers institutional-quality market insights with multiple profile types, advanced alert system, and customizable display options. KEY FEATURES Multiple Profile Types Visible Range Profile: Analyzes volume within the current chart window Fixed Range Profile: Custom date range analysis with visual markers Session Profile: Automatic daily/week

Le Price Compass est un outil d'analyse technique puissant, conçu pour fonctionner comme votre système de navigation de tendance sur les marchés financiers. Il évalue la pression directionnelle moyenne du marché, filtrant efficacement le bruit à court terme pour identifier le mouvement dominant avec clarté. L'indicateur quantifie l'écart entre le prix actuel et sa "moyenne centrale", fournissant un signal précis de l'orientation du marché (Haussière, Baissière ou Neutre). Interprétation (Les tro

Here our more valuable tools
SMC Trend Trading , Easy SMC Trading , Institutional SMC Architect Volume Analysis Tools , Volume flow Profile , Market volume profile , FVG with Volume , Liquidity Heatmap Profile , Volume Spread Analysis
The Fractals_Price indicator is a technical analysis tool that identifies fractal patterns on price charts. Fractals are recurring patterns that signal potential trend reversals or continuation points. This indicator marks both upward and downward

Cet indicateur est principalement utilisé pour le scalping sur XAUUSD. Il indique les prix d’ouverture, de plus bas et de plus haut pour : Le jour actuel Le jour précédent La semaine actuelle La semaine précédente Le mois actuel Le mois précédent Sur la base de ces niveaux de prix, vous pouvez identifier les niveaux sur lesquels le prix est susceptible de réagir. Si vous avez des questions ou des demandes, n’hésitez pas à me contacter via le chat. Merci et passez une excellente journée !

IMPORTANT! After your purchase, please contact me. Overview: Trade Vision Panel is a premium, lightweight trading dashboard for MetaTrader 5 designed to display your key trading information directly on the chart.
It combines performance analytics, open-position monitoring, and a real-time news filter — all in one smart, elegant interface.
Perfect for traders who want to see everything

️ Power Moving Average Signals Présentation : Power Moving Average Signals est une stratégie de trading basée sur la tendance, utilisant le croisement de deux moyennes mobiles — une rapide et une lente — pour générer des signaux clairs de vente et d’achat : Signal d’achat : lorsque la moyenne mobile rapide croise la lente vers le haut Signal de vente : lorsque la moyenne mobile rapide croise la lente vers le bas Optimisée pour les paires de devises : Cette stratégie fonctionne particu

Comprehensive Multi-Timeframe Volume-Based Support and Resistance Indicator Overview VolumePoint Pro is a complete analytical tool built around the concept of Point of Control (POC) — the price level where the highest traded volume occurred during a specific session or period.
By tracking and displaying these price nodes over multiple timeframes, the indicator allows traders to clearly identify zones of high market participation, which often act as powerful support and resistance levels. The ind
Buy Sell Swing Indicator Adaptive Swing High/Low Detector Buy Sell Swing Indicator is a dynamic swing detection indicator designed to automatically adapt to different timeframes and market conditions. It identifies key swing highs and lows with precision, helping traders analyze market structure and potential turning points without manual adjustment. The indicator removes the need for constant parameter tuning by automatically optimizing its sensitivity based on the active chart timeframe. Core
DUAL-ENGINE ANALYSIS SYSTEM: Average Tick Size Indicator : Measures bid movement strength across 6 customizable lookback periods (36, 96, 369, 500, 1000, 2000 ticks) Multi Timeframe Tick Analyzer : Calculates buy/sell pressure percentages across 6 different timeframes (100.200,300,400,500,600 ticks) REAL-TIME SIGNAL GENERATION: Combined Buy/Sell Alerts : Only triggers when BOTH analytical engines confirm the same direction Visual Arrow Signals : Clear green up arrows for buy signals, red down

Dynamic Dollar Value Indicator - Know Your Risk Before You Trade! Stop guessing and start knowing exactly what every price move means in real dollar terms! The Dynamic Dollar Value Indicator is an essential tool for professional traders who want instant visibility into the monetary value of price movements for any trading instrument. KEY FEATURES: REAL-TIME DOLLAR CALCULATIONS: Instantly displays the dollar value of 1% price moves for any symbol Automatically adapts to Forex, Stocks, In
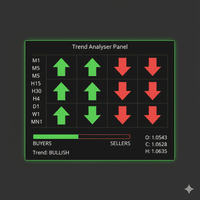
The Trend Analysis Dashboard is a powerful, all-in-one technical analysis tool designed for traders who need a clear, consolidated view of market momentum across multiple timeframes. Instead of cluttering your chart with numerous separate indicators, this tool aggregates signals from four key oscillators (Stochastic, RSI, and dual CCI) into a single, easy-to-read panel. It calculates the directional bias (Buy, Sell, or Neutral) for each enabled timeframe and provides a visual summary of over

Indicateur AI Forecasts pour MT5 :
Système de Prédiction Future avec Intelligence Artificielle et Apprentissage Profond (IA + ML)
_ Principales Caractéristiques : Vision future jusqu'à 20 bougies basée sur l'analyse dynamique des données Convient au trading scalping Graphiques de prédiction multicolores reflétant les niveaux de confiance avec compteur de pips blanc à côté du statut Achat/Vente actuel Zones de probabilité montrant les trajectoires de prix attendues avec marge de changement de p

Voici la traduction en français, en conservant le format exact et en incluant les termes anglais entre parenthèses comme demandé : L'Indicateur de Positions d'Entrée Moyennes (The Average Entry Positions Indicator) L'Indicateur de Positions d'Entrée Moyennes (The Average Entry Positions Indicator) fournit aux traders une représentation visuelle claire de leurs prix moyens d'entrée d'achat et de vente (average buy and sell entry prices) sur le graphique. Cet outil puissant calcule et affiche déso

️ Ichimoku Kinko Hyo System Un outil intelligent pour une analyse de marché précise et efficace Cet indicateur repose sur le système éprouvé Ichimoku Kinko Hyo , offrant une vision complète de la structure du marché, de sa dynamique et des mouvements potentiels du prix. Il est conçu pour permettre aux traders de prendre des décisions rapides grâce à des signaux visuels clairs. Caractéristiques principales : Haute précision grâce à une analyse avancée du marché sur plusieurs unités de
≤§≥ The red magic channel Trend Indicator displays relevant highs and lows.
This allows you to easily spot reversals and trend continuation moves.
≤§≥ All red magic channel products come with a pdf manual in English.
Here is the link for the Trend Indicator : https://drive.google.com/file/d/1tPoyo7EUJghH5I8fQARzbqXYh_UOn67V/view?usp=sharing
≤§≥ If you encounter any issues with the Trend Indicator, contact us at redmagicchannel@gmail.com

≤§≥ The red magic channel Order Blocks Indicator scans the chart for order blocks using several filters
and displays horizontal lines at the high and low prices of the order block candle.
≤§≥ All red magic channel products come with a pdf manual in English.
Here is the link for the Order Blocks Indicator : https://drive.google.com/file/d/1tPoyo7EUJghH5I8fQARzbqXYh_UOn67V/view?usp=sharing
≤§≥ If you encounter any issues with the Order Blocks Indicator, contact us at redmagicchanne

≤§≥ The red magic channel Position Manager Indicator helps you build a trading plan from scratch
and shows all the parameters directly on the chart.
≤§≥ All red magic channel products come with a pdf manual in English.
Here is the link for the Position Manager Indicator : https://drive.google.com/file/d/1tPoyo7EUJghH5I8fQARzbqXYh_UOn67V/view?usp=sharing
≤§≥ If you encounter any issues with the Position Manager Indicator, contact us at redmagicchannel@gmail.com
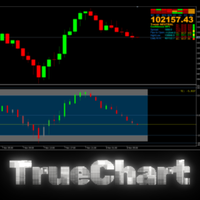
Proprietary Signal Amplification Technology
Unlike conventional indicators that merely display data, TrueChart employs advanced signal amplification that emphasizes only high-probability trading opportunities. The system automatically filters out market noise and amplifies genuine signals through multiple confirmation layers, ensuring you only see what truly matters. Revolutionary Multi-Dimensional Confirmation System
Most indicators operate in a single dimension. Our technology simultaneously

Product Description ZigZag Pro ATR - Smart Swing Detection That Adapts to Market Volatility Tired of standard ZigZag indicators that work only in specific market conditions? ZigZag Pro ATR is the professional solution. This advanced swing detection tool automatically adapts to changing volatility using ATR (Average True Range), giving you cleaner signals and a clearer view of the true market structure. Stop constantly adjusting parameters manually. Our indicator intelligently filters out mar
DS Auto Thousand Grid (Universel) Détecte automatiquement les niveaux de prix psychologiques et institutionnels clés du marché. Description DS Auto Thousand Grid (Universel) identifie et affiche automatiquement sur le graphique les niveaux de prix en milliers , c’est-à-dire les zones où les grands acteurs institutionnels interviennent le plus (ex. : 127000, 91000, 150000, 1.16000, etc.). Ces zones agissent comme de véritables barrières psychologiques et institutionnelles , où les banques, les
Le panneau Quick Draw vous permet de dessiner instantanément des objets de trading personnalisés (zones et lignes de tendance) en un seul clic, depuis un panneau fixe discrètement intégré dans un coin de votre graphique.
Plus besoin de chercher dans les barres d'outils ou les menus : un clic, un objet, et c'est fait ! Couleurs, épaisseur et style des lignes entièrement personnalisables.
Idéal pour :
Les traders institutionnels / adeptes du concept Smart Money (SMC) / traders basés sur l'offr

Clever Parabolic RSI Un oscillateur intelligent combinant Parabolic SAR et RSI pour des signaux de marché précis Cet oscillateur fusionne la puissance de deux indicateurs techniques populaires — Parabolic SAR et RSI — pour créer un système intelligent qui affiche clairement l’ état du marché , la force de la tendance et fournit des signaux d’achat ou de vente fiables . Fonctionnement : Un point carré vert indique le début d’une tendance haussière Un point carré rouge signale le débu

SMC Market Blueprint Institutional Market Structure Analyzer Based on Smart Money and ICT Concepts Overview SMC Market Blueprint is a comprehensive institutional-grade indicator designed to decode the true structure of the market using Smart Money Concepts (SMC) and ICT (Inner Circle Trader) methodology. It maps the internal market framework — identifying structure shifts, liquidity zones, and order flow transitions across multiple timeframes — giving traders a clear blueprint of how institution
Découvrez comment acheter un robot de trading sur le MetaTrader Market, le magasin d'applications de la plateforme MetaTrader.
e système de paiement de MQL5.community prend en charge les transactions via PayPal, les cartes bancaires et les systèmes de paiement populaires. Nous vous recommandons vivement de tester le robot de trading avant de l'acheter, pour une meilleure expérience client.

Vous manquez des opportunités de trading :
- Applications de trading gratuites
- Plus de 8 000 signaux à copier
- Actualités économiques pour explorer les marchés financiers
Inscription
Se connecter
Vous acceptez la politique du site Web et les conditions d'utilisation
Si vous n'avez pas de compte, veuillez vous inscrire