 MetaTrader 5
 Experts
 지표
 라이브러리
 유틸리티
 위젯
 규칙
MetaTrader 5용 기술 지표 - 159
 기술 지표의 시그널은 주식 및 외환 시장에서 거래를 개시 및 종료하는 데 중요한 역할을 합니다. 지표의 본질은 미래의 가격 변화를 예측하기 위한 금융 시그널 값의 수학적 변형입니다.
기술 지표를 테스트하여 시장 행동과 그로 인한 이익을 더 잘 예측할 수 있습니다.

• Please test the product in the Strategy Tester before purchasing to understand how it works.
• If you face any issues, contact me via private message—I’m always available to help.
• After purchase, send me a screenshot of your order to receive a FREE EA as a gift. Visual Panther: Your Ultimate Trend Trading Companion Unlock the full potential of your trading with the Visual Panther, a meticulously engineered trend-following indicator for MetaTrader 5. Designed for traders who demand clari

Visual Cobra Momentum Wave: Ride the Trend with Unmatched Clarity Unlock the true direction of the market and trade with newfound confidence. The Visual Cobra Momentum Wave is a professional-grade trend analysis tool designed to eliminate the noise and confusion of volatile markets. Instead of relying on lagging or conflicting signals, this indicator provides a single, clear visual guide, allowing you to identify and ride strong trends from their inception to their conclusion. For just $30, you
Super Trend Scalper v1.0 Overview The Super Trend Scalper is an advanced technical indicator designed specifically for scalping in the synthetic index Deriv market. It combines the power of three renowned technical indicators—SuperTrend, RSI, and MACD—to provide accurate and timely trading signals, ideal for traders looking to take advantage of short-term price movements with a high probability of success.
Technical Methodology Main Components 1. Adaptive SuperTrend
Uses the Average True Rang
Volatility 75 Trend - Specialized Technical Indicator Overview The Volatility 75 Trend is an advanced technical indicator designed specifically for trading synthetic indices, particularly the Volatility 75 (V75). This indicator combines multiple technical analysis tools to provide accurate trend signals and timely alerts in highly volatile markets.
Key Features 1. Adaptive Trend Algorithm Uses the Average True Range (ATR) as a basis for calculating dynamic support and resistance levels Impleme

BIAS Detector Indicator (MT5) Description The BIAS Detector Indicator is a custom tool for MetaTrader 5 designed to provide traders with a quick visual market bias based on the relationship between: AI simplified detector Hull and Moving Average computation based on multiple Average confluence for market trend. It simplifies trend direction analysis by displaying a BIAS Signal (Buy/Sell) directly on the chart in a small panel. The indicator shows “BIAS BUY” and “BIAS SELL” in yellow tex

신경망 지표 학습 기능이 내장되어 있습니다. 이 시스템은 다단계 맞춤형 퍼셉트론과 고급 학습 설정을 통해 미래 가격 변동을 예측하는 진정한 자율형 인공지능 시스템입니다 . 모든 금융 종목에 대해 지표를 직접 학습시킬 수 있으며, 머신러닝에 대한 특별한 지식은 필요하지 않습니다. 필요한 모든 것이 이 도구에 수집되어 있으며, 자동 모드와 사전 설정을 통해 편리하게 구현됩니다. 주요 업데이트 버전 2.0-2.5 가 출시되었습니다. 고급 입력 기능:지표에 대한 지원이 추가되었습니다. 이제 더 깊은 시장 분석을 위해 원시 가격 데이터를 세 가지 기술 지표와 결합하거나 가격이없는 지표 만 사용할 수 있습니다. 차단하지 않고 라이브 교육:지능형 학습 알고리즘은 백그라운드에서 비동기 적으로 작동합니다. 메타 트레이더 5 터미널은 완전히 반응하여 신경망을 학습하면서 시장을 계속 거래하고 분석 할 수 있습니다. 특징:
간편 시작 . 자동 모드로 빠르게 시작할 수 있는 간단한 설
ARIScalp is a powerful trading companion designed to generate high-probability entry signals with dynamic TP/SL/DP levels based on volatility. Built-in performance tracking shows win/loss stats, PP1/PP2 hits, and success rates all updated live. Key Features: Buy/Sell signals with adaptive volatility bands Real-time TP/SL/DP levels based on ATR Built-in MA Filter with optional ATR/StdDev volatility Performance stats panel (Success, Profit/Loss, PP1/PP2) Alerts via popup, sound, push, or email Cus

Professional-Grade VWAP + Market Profile Technology for Precision Trading VWAP Scalping Pro is an advanced analytical tool that integrates Volume-Weighted Average Price (VWAP) analysis with professional Market Profile visualization.
It provides traders with institutional-style insights into price structure, volume distribution, and session dynamics — ideal for scalping, intraday, and swing trading strategies. Key Features Triple VWAP Strategy Framework Trend VWAP (50) – Defines long-term dire

프로페셔널 멀티 타임프레임 스캘핑 인디케이터. 실시간 모바일 알림, 스마트 매수/매도 존, 일일 신호 통계 제공. 정밀함을 요구하는 데이 트레이더와 스캘퍼를 위해 설계됨. 개요 이 인디케이터는 정확성, 속도, 명확성 을 중시하는 데이 트레이더와 스캘퍼 를 위해 제작되었습니다. 멀티 타임프레임 분석과 지능적인 신호 필터링을 결합하여 성공 확률이 높은 거래 기회를 제공합니다. 실시간 알림 , 매수/매도 존 , 일일 성과 통계 를 통해 시장의 위치를 항상 파악할 수 있으며, 추측이나 불필요한 잡음은 없습니다. 추세 추종이든 역추세 매매든, 이 도구는 스타일에 맞게 적응하며 시장보다 한발 앞서 나갈 수 있도록 도와줍니다. 주요 기능 멀티 타임프레임 신호 엔진 메인 추세 (H4) → 시장 방향 필터 역추세 (H1) → 되돌림 및 반전 진입 추세 (M15) → 신호 타이밍 확인 세부 레이어 (M5) → 스캘핑 정밀도 플로우 추세 & 역추세 모드 플로우 추세 신호 : 모든 타임프레임이 같은 방향

Trade Filter is a tool designed primarily for traders using many Expert Advisors on the same currency pair and/or grid systems creating many simultaneous trading operations. By adding the filter (as an indicator) to a given chart, must select a magic number of the EA and only its trades remain visible. Numerous settings for colors, line styles, font sizes and others have been added, through which you can adjust the display according to your preferences. Set files also can be created and loaded.
Get ALL my MT4 & MT5 indicators FREE — See how here
특별 할인 : ALL TOOLS , 개당 $35 ! 신규 도구 는 첫 주 또는 처음 3회 구매 까지 $30 ! MQL5의 Trading Tools 채널 : 최신 소식을 받기 위해 제 MQL5 채널에 가입하세요 Zero Lag Liquidity 는 하위 타임프레임의 꼬리 프로파일과 고거래량 꼬리를 이용해 유동성 구역을 표시합니다. 각 비정상 캔들에 대해, 지표는 꼬리 내부의 거래량 히스토그램을 구축하고 로컬 POC(Point of Control)를 찾아 그 가격을 레벨로 렌더링합니다. 이후의 상호작용은 가격이 이 레벨들에 어떻게 반응하는지에 따라 라벨, 돌파 신호, 그리고 단순한 추세 상태를 트리거할 수 있습니다.
MT5 버전 더 보기: Zero Lag Liquidity MT5 Scanner MT4 버전 더 보기: Zero Lag Liquidity MT4 Scann

TendencyView is an MQL5 indicator/expert designed to display and analyze the trend of a financial asset (the current symbol) across multiple timeframes in parallel: H1, H4, and D1. It calculates fast and slow moving averages for each timeframe, compares their crossovers, and determines the trend: TREND_UP (bullish) -> Fast MA > Slow MA TREND_DOWN (bearish) -> Fast MA < Slow MA TREND_SIDEWAYS (sideways) -> No clear consensus On the chart, regardless of the timeframe, it displays color panels

Savage Indicator (XAUUSD)
Non-Repaint. Works on PC and Mobile Phone.
Overview :
Savage Indicator is designed for traders who want clean and precise signals without spending hours analyzing charts.
The indicator delivers real-time alerts including Push Notifications directly to your mobile phone, so you stay updated even when you’re away from your PC.
It works with multiple brokers and symbols, automatically detecting the XAUUSD chart you attach it to.
Features :
Clear signals wit

Bullhouse MarketProfile Description
The MarketProfile indicator collects and distributes traded volume at different price levels, creating a horizontal histogram that highlights areas of institutional interest. How it helps in trading
It helps traders identify strong support and resistance zones, balance areas, and points of control (POC), offering insights into where the market participants are most active. ️ How to use
Set the desired range of candles or session. The indicator will
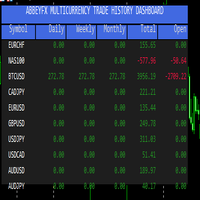
Abbeyfx Multicurrency Trade History Dashboard is an indicator that tracks and analyzes in a table format the trading performances across multiple forex pairs, stocks, crypto assets, or other instruments. This p ulls trades directly from MT5 trade history.
The Multicurrency Comparison table shows s ide-by-side results for all pairs. With quick glance, you can see your best and worst performing pairs. This indicator is a t ime-based Analysis Daily, weekly, monthly performance.
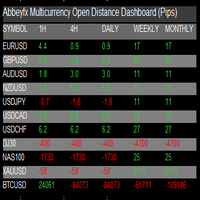
Unlock Market Insights with the AbbeyFX Multicurrency Open Distance Dashboard Take your trading to the next level with an advanced indicator that displays Price movement from 1H, 4H, Daily, Weekly, and Monthly Open across all trading instruments . With a single glance, you’ll see:
Precise pip or percentage movements for forex pairs, indices, metals, and crypto.
Multi-timeframe analysis (1H → Monthly) for stronger confirmations.
Clear visual dashboards that highlight bullish vs beari
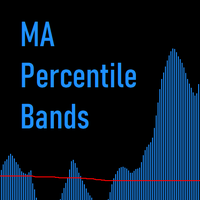
MA Percentile Bands (이동평균 백분위 밴드) 이 지표는 두 이동평균선 간의 관계를 분석하기 위한 통계적이고 정교한 접근법을 제공합니다. 단순한 교차(크로스오버)에만 초점을 맞추는 대신, "MA Percentile Bands"는 단기 및 장기 이동평균선 간의 거리를 측정하고 이를 최근의 과거 데이터와 비교합니다. 이를 통해 트레이더는 이동평균선 간의 이격이 통계적으로 유의미한 시점을 파악할 수 있으며, 시장의 모멘텀과 잠재적인 추세 소진 지점에 대한 독창적인 통찰력을 얻을 수 있습니다. 이 지표는 명확성을 위해 별도의 창에 표시되며, 두 가지 주요 요소로 구성됩니다. MA 거리 (히스토그램): 각 봉에 대한 단기 및 장기 이동평균선 간의 절대적인 거리를 보여줍니다. 히스토그램이 상승하는 것은 두 이동평균선이 멀어지고 있음을 나타내며, 이는 모멘텀이 증가하고 있음을 시사합니다. 백분위 임계값 (라인): 이 지표의 핵심 기능입니다. 이는 사용자가 정의한 조회 기간
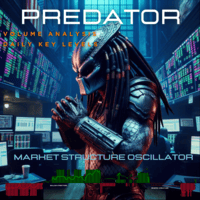
기능 설명 매일 수십억을 움직이는 동일한 기관 핵심 레벨을 사냥합니다. 세 개의 독점 알고리즘이 실제 시장 구조를 해독하여 소매 거래자들이 무엇에 맞았는지도 모르기 전에 고확률 킬존을 노출시킵니다. 시각적 요소 녹색 히스토그램 : 기관 매수 압력 감지 빨간색 히스토그램 : 스마트 머니 분배 진행 중 신호선 : 녹색 = 강세 거래량, 빨간색 = 매도세 참여 주요 매개변수 룩백 기간 : 14 (기관 기억 범위) 돌파 임계값 : 0.6 (헤어 트리거 민감도) 거래량 가중치 : 다크 풀 감지 신호 해석 0.6 이상 또는 -0.6 이하 : 기관 돌파 0.8 이상 또는 -0.8 이하 : 강한 모멘텀 구역 신호선 색상 변화 : 파워 구조 플립 감지 히스토그램 + 신호 수렴 : 고확률 트렌드 확인 전략 기관 주문흐름 패턴의 역공학. 소매 거래자들이 지연 지표로 허둥거리는 동안 마켓메이커의 속임수를 꿰뚫어 봅니다. 망설이는 매 분마다 기관 주머니로 흘러가는 이익입니다. 사냥꾼이 되세요, 먹이가 되지


Anchored VWAP Indicator Track the true market consensus price from any point on the chart.
This Anchored VWAP (Volume Weighted Average Price) indicator allows you to anchor the calculation to any candle — highs, lows, breakouts, or key events — offering precise control to identify institutional interest levels. Follow buyer or seller pressure in real-time Add multiple anchors to track various key points of interest simultaneously Ideal for professional and institutional-level analysis

Order Book Tilt with Volume Activity Meter Real-Time DOM Tilt • Session Bias • Volume Momentum Overview
Elevate your order-flow analysis with this clean, lightweight MT5 indicator—designed for traders who value clarity and context: Order Book Tilt (live): Real-time imbalance between sellers and buyers (Depth of Market), smoothed via EMA for actionable clarity. Session Tilt (running average): Tracks the cumulative bias of the current session—ideal for confirming trend setup vs noise. Volume Acti

Indicador que mostra níveis de variação do preço do ativo durante o dia. Possui alguns parâmetros para ajuste de cores e quantidade de níveis. Excelente como indicativo e utilização com outros indicadores para confirmar entradas e saídas.
Indicador que muestra niveles de variación del precio del activo durante el día. Posee algunos parámetros para el ajuste de colores y cantidad de niveles. Excelente como indicativo y para su uso con otros indicadores para confirmar entradas y salidas.
Indicat
Basic Smart Breaker Block Zones SMC Indicator
Introduction: Breaker blocks are order blocks that have been broken once by the market . When the price returns to these zones, they often trigger a strong reaction . In technical terms, resistance blocks become support zones after a breakout, and support blocks turn into resistance zones once broken. Understanding breaker blocks is extremely valuable for identifying high-probability trading opportunities , including both

RiskKILLER_AI Navigator는 AI 기반의 다중 시간대 시장 방향 및 전략 어시스턴트입니다. 트레이딩 성과는 프로처럼 시장을 이해하는 데 있습니다. 그것이 바로 RiskKILLER_AI Navigator 가 제공하는 것입니다: MQL5 외부 에서 작동하는 AI 기반 트렌드, 심리, 거시 분석을 통해 여러분의 트레이딩 스타일에 맞춰진 기관 수준의 인사이트를 얻으세요. 구매 후 사용자 설명서를 받으려면: 1. 설명서를 요청하는 댓글 을 게시 2. 저에게 쪽지 를 보내주세요. [ 전용 그룹 | 버전 MT5 - MT4 ]
핵심 이점 여러 시간대와 자산에 걸친 실시간 시장 방향 거시 지표, 뉴스, 심리에 대한 AI 기반 분석 여러분의 트레이딩 스타일(수동 또는 자동)에 기반한 맞춤형 조언 RiskKILLER_AI Expert Advisor (EA)와의 직접적인 시너지
주요 기능 AI 기반 글로벌 트렌드 대시보드 - 주요 FX 쌍과 BTCUSD에 대해 M1부터 D1까지의 시장

The DS Moving Average Gradient indicator is a technical analysis tool that displays the gradient of a selected moving average in a separate subwindow. Users can select from four moving average types: Simple (SMA), Exponential (EMA), Smoothed (SMMA), and Linear Weighted (LWMA). Additionally, the indicator offers the option to apply simple moving average smoothing to the calculated gradient or display the raw, unsmoothed gradient values. This indicator quantifies the rate of change (slope) of the

Trend Catcher – Multi-Timeframe MT5 Trend Filter with Mobile Alerts Trend Catcher is a lightweight, multi-timeframe trend detection indicator for MetaTrader 5. It helps traders synchronize signals across different timeframes, filter noise, and stay aligned with momentum for more structured entries. Designed with fast execution and mobile compatibility, this tool adapts to scalpers, day traders, and swing traders who need clarity in rapidly changing markets. Key Features 1. Multi-Timeframe Trend
FREE

Harness the Force of Market Momentum Stop chasing false breakouts. Trend Force identifies high-probability trend continuations with surgical precision, giving you the edge professional traders demand. Get accurate In/Out signals with smart dynamic stop loss, stop guessing and get results NOW! Why Traders Choose Trend Force Smart Breakout Detection Advanced volatility-adjusted algorithm catches real moves Filters out market noise and false signals automatically Dynamic adaptation to chan
First SMC based (working) buy sell signal indicator
Indicator will only draw NEW signals, To back test, use strategy tester. MESSAGE me for BONUS. This indicator is one of my best development. I struggled with implementing my method for a long time but finally i was able to automate my entries. We are still not there yet as my exists and sl's are dynamic. as soon as i figure dynamic sls and exists implementation, I will push the update. I might increase the cost exponentially. This indicator
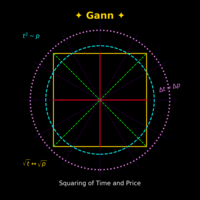
Gann Time–Price Square Cycles (MT5) This indicator applies the concept of time–price balance introduced by W.D. Gann.
It detects price swings on the chart and projects Quarter, Half, and Full cycle time intervals forward, marking them with vertical lines. The tool is designed to help traders study the relationship between swing size and elapsed time directly on MT5 charts. Functions Detects swing highs and lows based on pivot depth and minimum swing size. Projects Quarter, Half, and Full harmon

PriceActionToolKit - Professional ICT & Smart Money Concepts Indicator Transform Your Trading with Institutional-Grade Analysis PriceActionToolKit is a comprehensive indicator that brings the power of Inner Circle Trader (ICT) methodology and Smart Money Concepts directly to your MetaTrader 5 platform. This all-in-one solution eliminates the guesswork from your trading decisions by automatically identifying the key market structures that institutional traders use to move the markets. Why This
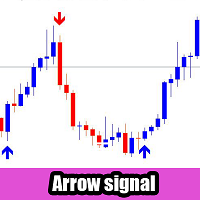
This indicator is designed to support traders by providing non-repainting arrow signals combined with dynamic period adjustment technology .
Its focus is on consistency, clarity, and flexibility, making it suitable for different timeframes and trading styles. Once a signal is generated, it does not repaint, drift, or disappear, ensuring that historical chart signals remain identical to real-time usage. The automated trading EA is now live; please purchase it here. Recommendations Best Pairs: EUR
This trading indicator is non-repainting, non-redrawing, and non-lagging, making it an ideal choice for both manual and automated trading. It is a Price Action–based system that leverages price strength and momentum to give traders a real edge in the market. With advanced filtering techniques to eliminate noise and false signals, it enhances trading accuracy and potential.
By combining multiple layers of sophisticated algorithms, the indicator scans the chart in real-time and translates comple

Buy n Sell Arrows with Trailing Stop – Traderlinkz Set File Provided on Request
Turn market noise into clear Buy/Sell signals.
A precision trading tool for MetaTrader 5 that combines clean entry signals with a dynamic trailing stop. Best results are achieved on the 5-minute timeframe , making it ideal for scalpers and intraday traders.
Especially effective for Gold (XAUUSD) and optimized for metals, cryptocurrencies, forex pairs, commodities, and global indices . Ask the seller for the re

The MQL5 website offers a very affordable option for purchasing an indicator called "I Know Buy or Sell." It truly knows when to buy and when to sell, making it a wonderful and reliable aid for traders on the FOREX market. https://www.mql5.com/ru/market/product/149101 Only BUY or SELL! Based on in-depth price analysis across all timeframes, the Indicator generates and displays specific BUY or SELL commands for 28 currency pairs on the MT5 trading platform screen on a bar corresponding to the pre
Here our more valuable tools
SMC Trend Trading , Easy SMC Trading , Institutional SMC Architect Volume Analysis Tools , Volume flow Profile , Market volume profile , FVG with Volume , Liquidity Heatmap Profile , Volume Spread Analysis Short Description:
Stop overloading your charts with dozens of indicators. Bollinger Fibo Pro is a sophisticated, all-in-one trading system for MetaTrader 5 that merges two legendary concepts into a single, powerful tool. It enhances standard

TrendCatcherBot: Find Your Edge in the Market Don't guess the trend—catch it. The TrendCatcherBot is an Expert Advisor designed for MetaTrader 5 that simplifies your trading strategy. By leveraging the power of moving average crossovers, this bot provides clear, visual signals directly on your chart, so you always know when to act. Watch for the unmistakable green, red, and black dots in the corner of your screen to instantly see if the market is signaling a buy, sell, or hold. It's the perfect
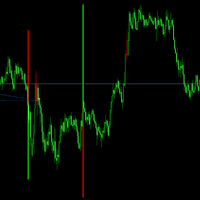
Introducing the Machine Learning Price Target Predictions, a cutting-edge trading tool that leverages kernel regression to provide accurate price targets and enhance your trading strategy. This indicator combines trend-based signals with advanced machine learning techniques, offering predictive insights into potential price movements. Perfect for traders looking to make data-driven decisions with confidence.
What is Kernel Regression and How It Works
Kernel regression is a non-parametric mach
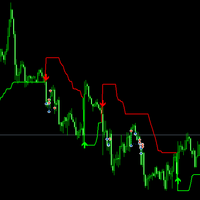
The Volume SuperTrend AI is an advanced technical indicator used to predict trends in price movements by utilizing a combination of traditional SuperTrend calculation and AI techniques, particularly the k-nearest neighbors (KNN) algorithm.
The Volume SuperTrend AI is designed to provide traders with insights into potential market trends, using both volume-weighted moving averages (VWMA) and the k-nearest neighbors (KNN) algorithm. By combining these approaches, the indicator aims to offer
Smart Money Flow Indicator – Professional SMC Analysis Tool The Smart Money Flow Indicator is designed for traders who want to apply institutional-grade market analysis directly in MetaTrader. It automatically detects key Smart Money Concept (SMC) patterns and levels, helping you identify high-probability trading opportunities with clarity and precision. Features: Automatic Fair Value Gap detection Order Block identification (bullish and bearish) Break of Structure signals Multi-timeframe suppor

Fibonacci Killer Alert MT5로 거래의 정밀도를 높이세요. 이 강력한 인디케이터는 피보나치 리트레이스먼트 레벨을 활용하여 외환, 주식, 암호화폐, 상품 시장에서 정확한 진입 신호를 제공합니다. Forex Factory와 Reddit의 r/Forex와 같은 거래 커뮤니티에서 찬사를 받고 있으며, Investopedia와 TradingView의 논의에서도 트렌드 반전 및 지속을 식별하는 정확성으로 호평받고 있어, 높은 확률의 설정을 찾는 트레이더들 사이에서 인기 있는 도구입니다. 사용자들은 프라이스 액션과 결합하여 주요 피보나치 레벨(예: 38.2%, 50%, 61.8%)을 최대 90%의 정확도로 식별하며, 새로운 캔들 형성 시 트리거되는 적시 알림을 통해 거래 타이밍이 25-35% 개선되었다고 보고합니다. 주요 이점으로는 높은 신호 정확도, 맞춤형 피보나치 레벨로 개인화된 전략, 차트를 지속적으로 모니터링하지 않고도 기회를 포착할 수 있는 경량 디자인이 포함되어 스캘
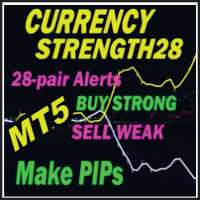
A Melhor Solução para Traders no MetaTrader 5! Analise a força de 9 moedas + XAU (Ouro) em apenas UM gráfico! Identifique o ponto exato de entrada em tendências e oportunidades de scalping com precisão profissional. RECURSOS EXCLUSIVOS Análise Completa USD, EUR, GBP, CHF, JPY, AUD, CAD, NZD + XAU Cobertura de 28+ pares forex + pares de ouro Múltiplos timeframes simultâneos (M1 até MN1) Painel em Tempo Real Mini painel lateral com ranking das moedas Valores M1 e D1 atualizados automatica

DD_Wallpaper – MT5 차트를 위한 맞춤형 전체 화면 및 중앙 배경 DD_Wallpaper 로 MetaTrader 5 (MT5) 차트를 더욱 전문적이고 개인화된 영감을 주는 작업 공간으로 바꿔보세요.
이 독창적인 인디케이터는 MT5 차트에 전체 화면 또는 중앙 모드 로 맞춤형 배경 이미지를 추가할 수 있습니다. 동기 부여, 미적 요소, 브랜드를 통해 거래 환경을 개선하고 싶은 트레이더에게 적합합니다. 주요 기능
️ 맞춤형 차트 배경 – 좋아하는 BMP 이미지를 MT5 차트에 표시.
전체 화면 & 중앙 모드 – 전체 배경 또는 중앙 이미지 선택.
자동 크기 조정 – 차트 크기에 맞게 자동 조정.
차트 크기 표시 – 터미널 로그에 차트 크기 기록 옵션.
만료 잠금 시스템 – 독점성을 보장하기 위한 내장 만료 날짜.
가볍고 효율적 – 거래 성능에 영향을 주지 않고 원활하게 실행. ️ 입력 매개변수 picture_filename → 이미지 파일

T-Virus Sentiment (MT5) — Turn raw indicators into one decisive market “serum” Concept. The T-Virus idea comes from biology: a single factor can “infect” a system and rapidly tilt its state. Markets behave the same way—one strong impulse spreads across timeframes and symbols until the whole structure turns risk-on or risk-off. T-Virus Sentiment captures that process by distilling seven proven signals into a single 0–100 “serum” gauge . When the “serum” crosses your buy/sell thresholds and market

Investing in this tool means investing in smarter, faster, and more disciplined trading. Core Functionality: Your Automated Trading Analyst At its heart, this indicator is a decision-support system. It automatically calculates and visualizes four of the most critical data points for any trader: Key Support Levels: The price floor where buying pressure is likely to step in. Key Resistance Levels: The price ceiling where selling pressure may emerge. Optimal Stop Loss for Buy Trades: A calculate
Multi-TF 대시보드 지표 – 사용자 설명서 및 장점 지표 이름: Multi-TF Indicator Dashboard
버전: 1.10
유형: 다중 시간대 대시보드 1. 포함된 지표 RSI (상대 강도 지수) 가격 강도를 측정 신호: 과매수(>70), 과매도(<30), 중립 MACD (이동 평균 수렴·발산) 추세 방향 및 잠재적 반전 분석 신호: 상승 / 하락 스토캐스틱 과매수 및 과매도 상태 판단 신호: OB(>80), OS(<20), 중립 볼린저 밴드 가격 변동성 측정 상단 밴드 = OB, 하단 밴드 = OS ADX (평균 방향 지수) 추세 강도 측정 신호: 강함 / 좋음 / 중립 / 약함 CCI (상품 채널 지수) 과매수 및 과매도 상태 판단 OB(>100) / OS(<-100) / 중립 ATR (평균 실제 범위) 변동성 측정 기준 이하 = 낮은 변동성 Williams %R 단기 과매수/과매도 상태 표시 OB / OS / 중립 거래량 현재 캔들의 거래량 표시 2. 사용 방법

Ultimate Professional Trading Analysis System A comprehensive multi-indicator trading system combining 25 professional-grade analysis tools in a single platform. This indicator integrates Smart Money Concepts (SMC) analysis with traditional technical indicators and advanced features for complete market analysis. Core Features: 10 Smart Money Concepts indicators including Order Blocks, Fair Value Gaps, Break of Structure, Liquidity Sweeps, Supply/Demand zones, Market Maker patterns, Premium/Disc
FOTSI – 외환 진정 강도 지수 개요 각 통화의 진정한 강도를 발견하고 우위를 가지고 거래하세요. FOTSI 지표 는 모든 주요 통화(USD, EUR, GBP, JPY, CHF, AUD, CAD, NZD)의 실제 모멘텀을 모든 통화쌍에서 측정하는 다중 통화 오실레이터 입니다. 단일 차트를 분석하는 대신, FOTSI는 여러 통화쌍의 데이터를 결합하고 움직임을 평활화하며, True Strength Index (TSI) 알고리즘을 적용하여 각 통화의 상대적 강도를 명확하고 안정적이며 지연 없이 제공합니다. 주요 특징 다중 통화 오실레이터: 각 통화의 강도를 독립적으로 측정합니다. 과매수 및 과매도 수준: +50 → 통화 과매수 (조정 확률 높음). –50 → 통화 과매도. ±25 → 중립 영역. 간단한 해석: 0 이상/이하 곡선 = 강도/약점. 리페인트 없음: 모든 계산은 실시간으로 수행되며 안정적입니다. 모든 통화쌍과 시간 프레임에서 호환: 신뢰성을 위해 H1, H4, D1 권장.

Automate Gann's Market Geometry: The Ultimate MT5 Indicator for Predicting Price Cycles & Key Levels Stop guessing and start knowing. The indicator does the complex math for you, transforming W.D. Gann's profound theories into clear, actionable trading signals on your chart. Are you struggling to... Manually calculate pivotal support and resistance levels? Identify high-probability reversal zones in a chaotic market? Understand how to apply Gann's concepts to modern trading? Keep track of your a
Weekday Stats Overview Weekday Stats is a quantitative analysis indicator designed to perform statistical studies of price behavior by classifying candle data according to the day of the week on which each candle occurred. The indicator processes the historical candles of the selected asset and provides statistical information for each day of the week, allowing the user to analyze price direction and price variation separately for each weekday. The sampling period, statistical parameters, and da

Month Stats Overview Month Stats is a quantitative analysis indicator designed to perform statistical studies of price behavior by classifying candle data according to the calendar month in which each candle was formed. The indicator processes historical candle data and provides statistical results for each month of the year, allowing users to analyze price behavior individually for January, February, March, and the remaining calendar months. The input parameters allow users to define the sampli

Fractal Support & Resistance Automatic Support and Resistance Indicator Based on Fractal Structure Short Description Fractal Support & Resistance is a technical analysis indicator that automatically identifies and displays support and resistance levels using fractal-based price structure detection. Overview Fractal Support & Resistance is an indicator designed to detect support and resistance zones using configurable fractal logic. The indicator automatically scans historical price structure an

This MQL5 indicator, named BoS_ChoCh_Indicator, detects Break of Structure (BoS) and Change of Character (ChoCh) in trading charts. It identifies pivot highs and lows using a user-defined period (default 5), monitors price breakouts above highs or below lows, classifies them as bullish/bearish BoS or ChoCh based on the prevailing trend, draws colored lines and labels on the chart for visualization, and populates buffers with signals, structure levels, and trend direction (1 for up, -1 for down)
Multi-Timeframe Laguerre RSI와 Zero-Lag MACD 지표는 MetaTrader 5용 고급 오실레이터로, 적응형 Laguerre RSI와 ZLEMA 기반 Zero-Lag MACD를 결합하여 정확한 모멘텀 및 트렌드 분석을 제공합니다. 신호는 별도 창에 표시되며, Multi-Timeframe 패널은 가중 점수를 활용해 신뢰할 수 있는 진입점을 식별합니다.
주요 특징:
듀얼 오실레이터 표시: 조정 가능한 LaRSI(Alpha)와 Zero-Lag MACD(ZLEMA 기반)를 동일 창에 표시.
Multi-Timeframe 지원(최대 5개): 각 타임프레임에 대한 합의 신호 및 전체 점수 표시.
Non-Repainting 신호: 모든 활성 타임프레임이 일치할 때만 화살표 표시, 신뢰도 향상.
유연한 알림: LaRSI/MACD 크로스 또는 Multi-Timeframe 합의 기반 팝업, 사운드, 푸시 알림.
사용자 맞춤형 시각화: 2색 또는 4색 스킴, LaR
1. NeuroResonance v13.2 - Advanced Multi-Mode Analysis Indicator NeuroResonance is a sophisticated, multi-faceted trading indicator for MetaTrader 5 designed to provide non-repainting signals based on advanced market analysis. The indicator goes beyond traditional methods by integrating cycle analysis, market regime detection (trending vs. mean-reversion), and a proprietary Quantum State Collapse (QSC) engine to identify trading opportunities. It is designed as a comprehensive trading framework
**Laguerre RSI MTF — MetaTrader 5용 인디케이터** 개발자: Aleshin AlgoTrade | 버전: 1.06
간단 소개: Laguerre RSI MTF는 Laguerre RSI 개념을 기반으로 한 고급 멀티타임프레임 인디케이터입니다(John Ehlers 영감). 여러 시간프레임에서 시장 모멘텀을 빠르게 분석하여 의사결정과 전략 구성에 도움을 줍니다.
주요 기능: - 최대 5개 시간프레임의 MTF 계산(적응형 바 수). - Laguerre 필터 튜닝용 Alpha 파라미터. - 2색/4색 다이나믹 컬러 스킴(과매수/과매도 표시). - 차트 내 MTF 패널과 가중 종합 신호. - 모든 선택 TF의 합의 시 표시되는 신호 화살표. - 향상된 알림: 데스크탑 알림 및 푸시 알림 지원. - 입력 검증 및 0으로 나누기 방지 등의 안정성 강화.
주요 입력: Source Price, Alpha (0.0–1.0), ColorChange, U

Schemes 2.0 - MT5 차트를 즉시 바꿔보세요 Meta Trader 5를 위한 최고의 시각적 향상 도구인 Schemes 2.0으로 거래 경험을 업그레이드하세요.
전문적으로 디자인된 9가지 색상 테마와 스마트 토글 인터페이스를 통해 깔끔한 미니멀리즘부터 생동감 넘치는 고대비 설정까지, 단 한 번의 클릭으로 차트 스타일을 즉시 전환할 수 있습니다.
트레이더들이 Schemes 2.0을 사랑하는 이유 1. 9가지 프리미엄 테마 - 밝은 테마부터 어두운 테마, 클래식 테마부터 모던 테마까지 모든 거래 스타일에 맞춰 제공됩니다. 2. 원클릭 스타일링 - 차트 설정 조정에 시간 낭비 없이 즉시 변화합니다. 3. 스마트 토글 - 방해받지 않는 작업 공간에서 언제든지 컨트롤을 표시하거나 숨길 수 있습니다. 4. 전문적인 디자인 - 스크린샷, 시그널 또는 실시간 거래 프레젠테이션에 적합합니다. 5. 가볍고 사용하기 쉬움 - 설치가 간편하고 직관적이며 군더더기 없이 깔끔하게 사용할 수 있
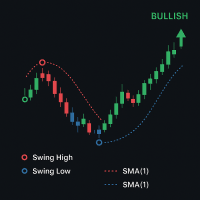
HighLow Swing — 추세 및 스윙 감지 지표
설명: HighLow Swing은 트레이더가 모든 차트 시간대에서 주요 시장 전환점과 추세 방향을 쉽게 파악할 수 있도록 설계된 강력한 추세 및 스윙 감지 지표입니다. 중요한 스윙 고점과 저점을 강조하고, 스윙 구조를 기반으로 추세 원을 그리며, 명확한 시각적 신호를 통해 시장 모멘텀을 앞서갈 수 있도록 도와줍니다.
주요 기능: 1. 스윙 포인트 감지: 차트에서 중요한 스윙 고점과 스윙 저점을 자동으로 감지하고 명확한 색상의 원으로 표시합니다. 2. 추세 식별: 스윙 고점/저점 분석과 가격 움직임을 결합하여 시장 추세(강세, 약세, 중립)를 파악합니다. 3. 시각적 추세 신호: 현재 추세 방향을 차트에 직관적인 원 형태로 표시합니다. 4. 설정 가능한 추적 기간: 다양한 시장 및 시간대에 맞게 조정 가능한 추적 기간을 통해 스윙 감지의 민감도를 사용자 지정할 수 있습니다. 5. 가볍고 효율적: 플랫폼 속도 저하 없이 모든 심

Haven Bands Reversion – 평균 회귀 트레이딩을 위한 전문 지표 평균 회귀 전략을 사용하는 트레이더를 위해 설계된 강력하고 정확한 도구, Haven Bands Reversion 을 소개합니다. 기존의 볼린저 밴드와 달리 이 지표는 거래량 가중 이동 평균(VWMA) 을 기반으로 하여 채널이 실제 시장 활동에 더 민감하게 반응합니다. 가장 중요한 것은 이 지표가 다시 그려지지 않는 신호 를 생성하여 신뢰할 수 있는 진입점을 제공한다는 것입니다. 여기에 제 다른 제품들이 있습니다 -> 여기 . 가격이 '공정한' 가치에서 너무 많이 벗어났을 때를 이해하는 것은 성공적인 반전 및 조정 거래의 핵심입니다. Haven Bands Reversion은 이러한 순간을 자동으로 식별하고 가격이 동적 변동성 채널 내부로 돌아올 때 명확한 신호를 제공합니다. 왜 VWMA가 표준 SMA보다 나은가요? 모든 캔들을 동일하게 고려하는 단순 이동 평균(SMA)과 달리, VWMA는 거래량이 많은

LEGION OF SOLDIERS – MT5용 재진입 및 모멘텀 확인 지표 재진입 기회를 포착하세요. 자신만의 전략 방향을 따르세요. LEGION OF SOLDIERS는 트레이더가 사전에 정의한 추세 내에서 잠재적인 재진입 지점을 식별하도록 설계된 기술적 지표입니다. 서로 다른 속도로 작동하는 두 개의 라인과 압력 히스토그램을 통해 두 라인의 교차를 확인하고, 거래량과 변동성을 기반으로 시장 움직임의 강도를 시각적으로 평가할 수 있습니다. 이 지표는 주요 추세를 결정하거나 방향 전환을 예측하기 위한 도구가 아닙니다. 이미 설정한 시장 방향에 따라 잠재적인 재진입 기회를 식별할 수 있도록 기존 트레이딩 전략을 보완하는 역할을 합니다. 주요 기능 1. 두 개의 라인 시스템 빠른 라인(청록색): 시장 움직임에 더 빠르게 반응합니다. 느린 라인(브론즈색): 교차를 식별하기 위한 기준 흐름을 제공합니다. 조정 가능한 Gamma 매개변수를 통해 두 라인의 작동 방식을 맞춤 설정할 수 있습니다.
PortfolioVaR Multi-Label Indicator: Your Ultimate Risk Manager Are you a serious trader who holds multiple positions across different symbols and currencies? If so, you need a clear, objective measure of your total portfolio risk. The PortfolioVaR Multi-Label indicator is the essential tool you've been waiting for, providing real-time, consolidated risk data directly on your MT5 chart. What is Value at Risk (VaR)? Value at Risk (VaR) is a fundamental concept in finance that measures the potentia

END FLOW MOMENTUM Capital Flow Analysis with a Geometric Approach Overview End Flow Momentum is a technical indicator that blends volume, price, and volatility analysis into a visual tool. Designed for traders seeking an alternative capital flow analysis tool. Key Features 1. Mathematical Foundation Proprietary Calculation Model: Uses a mathematical core that serves as a dynamic central reference point. Volatility-Adaptive Scaling: Utilizes the asset's inherent volatility as the primary

Smart Stochastic Divergence Detector Stochastic Divergence Detection Indicator for MetaTrader 5 Overview Smart Stochastic Divergence Detector is a technical analysis indicator designed to identify bullish and bearish divergence conditions between price action and the Stochastic oscillator. The indicator supports: Regular divergence detection Hidden divergence detection Trendline visualization Signal marking Configurable alerts Multi-timeframe operation It is intended for traders using momentum-b

Unlock the Market's Hidden Blueprint with Advanced Pattern Recognizer Tired of staring at charts, struggling to spot high-probability trading opportunities? What if you had a professional analyst scanning the markets 24/7, drawing perfect trendlines, and calculating precise profit targets for you? Introducing Advanced Pattern Recognizer for MetaTrader 5 – Your Automated Technical Analysis Powerhouse. This isn't just another indicator. It's a sophisticated algorithmic engine designed to do the he

The AX Forex Indicator MT5 is a sophisticated trading tool designed to provide traders with a comprehensive analysis of multiple currency pairs. This powerful indicator simplifies the complex nature of the forex market, making it accessible for both novice and experienced traders. AX Forex Indicator uses advanced algorithms to detect trends, patterns and is an essential tool for traders aiming to enhance their forex trading performance. With its robust features, ease of use, and reliabl

DoctorEdge Daily Levels Entry SL And TP Short Description:
Advanced indicator for MetaTrader 5 that automatically calculates entry, stop loss, and take profit levels based on market data, facilitating technical analysis and trade planning. Long Description:
The DoctorEdge Daily Levels Entry SL And TP is a technical indicator designed for traders seeking precision in defining entry points, stop loss, and take profit levels. It uses current market data to calculate: Entry (Entry): Stop Loss (SL)
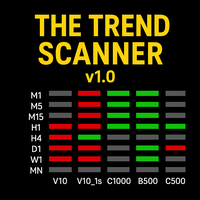
The Trend Scanner – Multi-Timeframe & Multi-Asset Analyzer Discover market direction at a glance!
The Trend Scanner is a powerful tool designed for Boom & Crash, Volatility Indices, Jump Indices, and even Forex (EURUSD) , allowing traders to instantly spot bullish or bearish trends across multiple assets and timeframes in a single, easy-to-read window. Key Features: Monitors trends from M1 up to Monthly . Covers a wide range of assets:
Boom & Crash Indices
Volatility Indices
Jump Indice
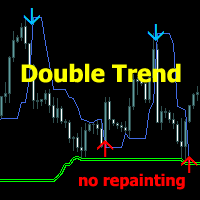
Trading System Double Trend MT5 - 여러 지표로 구성된 독립적인 트레이딩 시스템입니다. 전반적인 추세의 방향을 파악하고 가격 변동 방향에 대한 신호를 제공합니다.
스캘핑, 일중 또는 주간 거래에 사용할 수 있습니다.
특징
모든 시간대 및 거래 상품(외환, 암호화폐, 금속, 주식, 지수)에서 작동합니다. 차트를 로드하지 않고도 정보를 시각적으로 간편하게 확인할 수 있습니다. 지표가 다시 그려지거나 신호를 완성하지 않습니다. 캔들이 마감될 때만 작동합니다. 다양한 유형의 신호 알림이 제공됩니다. 시각적으로 이해하기 쉽고, 차트에 연결하고 신호의 간단한 권장 사항을 따르기만 하면 됩니다.
시스템의 각 추세에 대한 입력 매개변수가 구성됩니다.
General trend - 전반적인 추세를 파악합니다. Signal trend - 진입 및 청산 신호를 제공합니다. Play sound / Display pop-up message / Send push notifi

Enhance Your Technical Analysis with Stats Summary . The Stats Summary is a robust analytical tool developed for MetaTrader 5 (MT5), providing a detailed statistical overview of price behavior. Unlike traditional indicators, it uses descriptive statistics to map the distribution of prices over a customizable sample period. By defining the sample size, the indicator calculates and displays the following values on the chart: Minimum and Maximum (Min/Max): The complete price range of the selected i
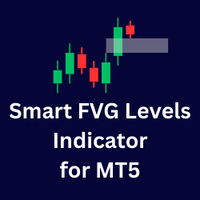
Smart FVG Levels Indicator for MT5 Introduction Smart FVG Levels Indicator is designed to automatically detect and display Fair Value Gaps (FVG) on MetaTrader 5 charts. It provides a structured way to visualize price imbalances and potential reaction zones. Settings General Settings Number of candles used for calculations Option to hide overlapping levels FVG Settings Enable or disable FVG levels Support level color Resistance level color Show level labels Display recent levels (limit number of

NosTraderMus LinearRegressionBands MT5 — 회귀 직선 채널 + RSI 및 신호 화살표 NosTraderMus LinearRegressionBands MT5 는 롤링 가격 구간 위에 회귀 직선 을 구축하고, 잔차의 표준편차 를 이용해 동적 채널 을 형성합니다. 이 통계적 채널 위에서 RSI 필터 (기간/타임프레임 선택 가능)를 적용하여 “극단 + 확인” 조건이 충족될 때 매수·매도 화살표 를 표시합니다. 신호는 종가 기준 으로 평가되어 리페인팅을 줄이는 데 초점을 맞춥니다. 동작 방식 회귀 직선 + 적응형 채널
RegPeriod 개의 봉으로 **추세 중심선(회귀 직선)**을 계산합니다. 채널 폭 은 잔차의 표준편차에 StdDevFactor 를 곱해 산출하므로, 현재 변동성 에 맞춰 폭이 자동 조정 됩니다. 추세 필터(선택)
직선의 기울기 가 방향성을 나타냅니다. OnlyInTrend=true 일 때는 추세 방향과 일치하는 신호만 표시됩니다(기울기 양수
MetaTrader 마켓은 과거 데이터를 이용한 테스트 및 최적화를 위해 무료 데모 거래 로봇을 다운로드할 수 있는 유일한 스토어입니다.
어플리케이션의 개요와 다른 고객의 리뷰를 읽어보시고 터미널에 바로 다운로드하신 다음 구매 전 트레이딩 로봇을 테스트해보시기 바랍니다. 오직 MetaTrader 마켓에서만 무료로 애플리케이션을 테스트할 수 있습니다.
