M W Scanner MT5
- Indicadores
-
Reza Aghajanpour
 =============================================================================================
<<<<<< Our team after 19 years of experience in the markets and programming would like to share winner solutions with you. >>>>>> - Versión: 1.9
- Actualizado: 24 enero 2026
- Activaciones: 20
**Todos los Símbolos x Todos los Plazos escanean con sólo pulsar el botón del escáner **
Introducción:
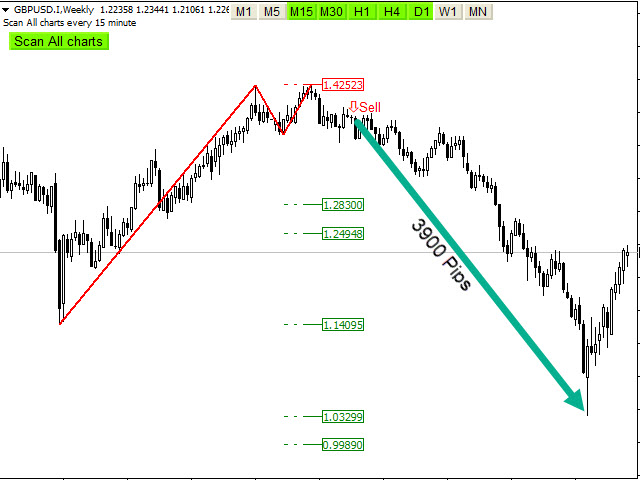
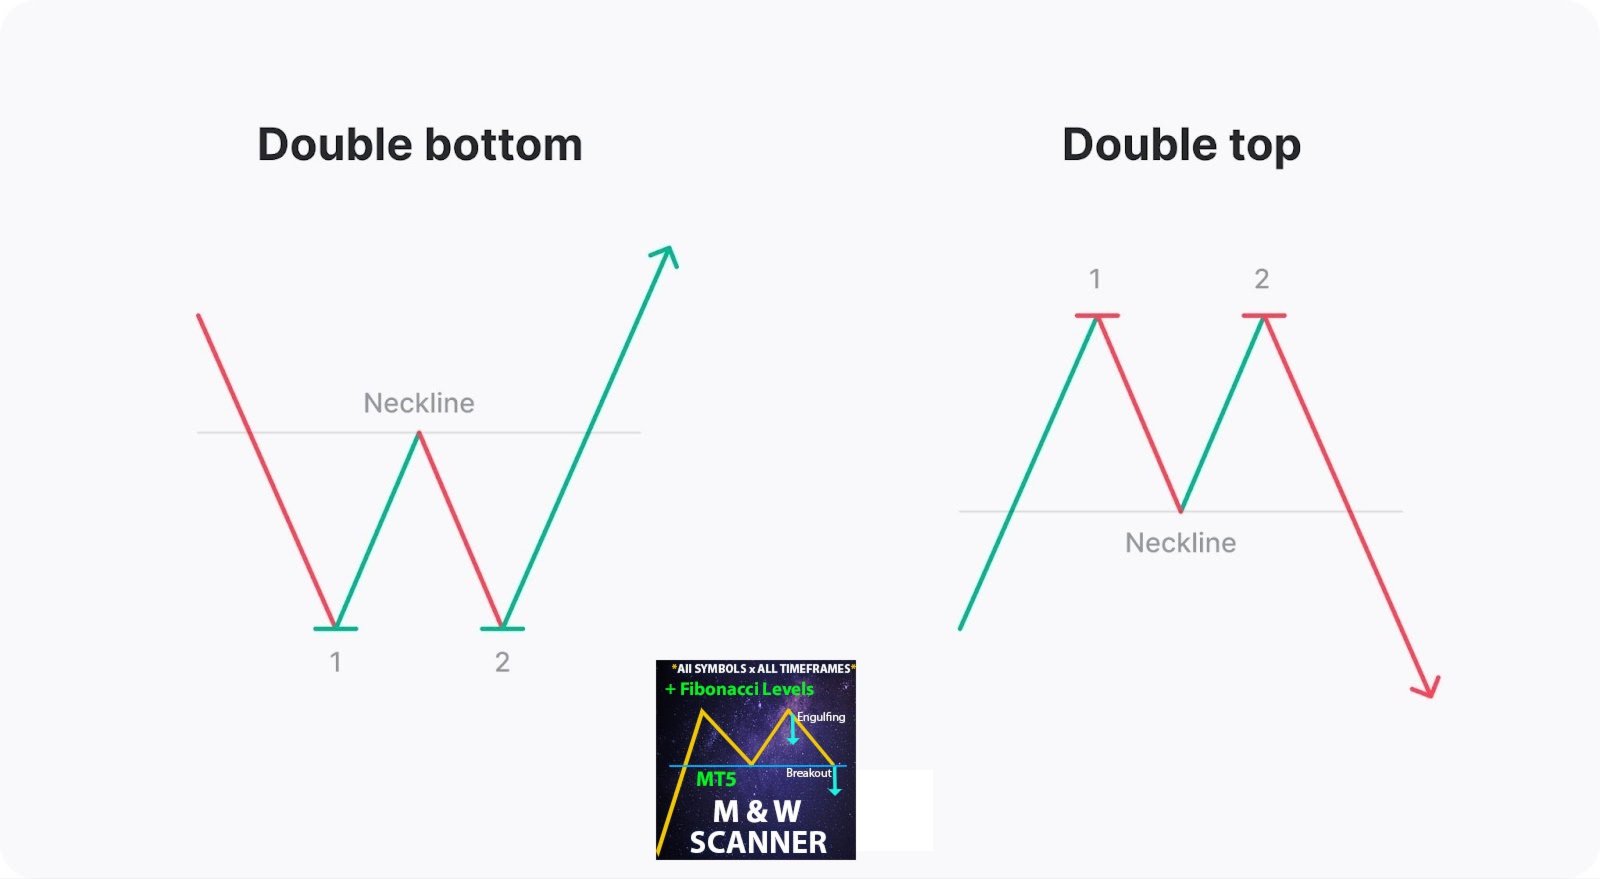
Doble Top(M) y Doble Bottom(W) es un tipo común muy repetitivo de los patrones de reversión de precios. Double Top se asemeja al patrón M e indica una reversión bajista mientras que Double Bottom se asemeja al patrón W e indica una reversión alcista que tienen una alta tasa de ganancias.
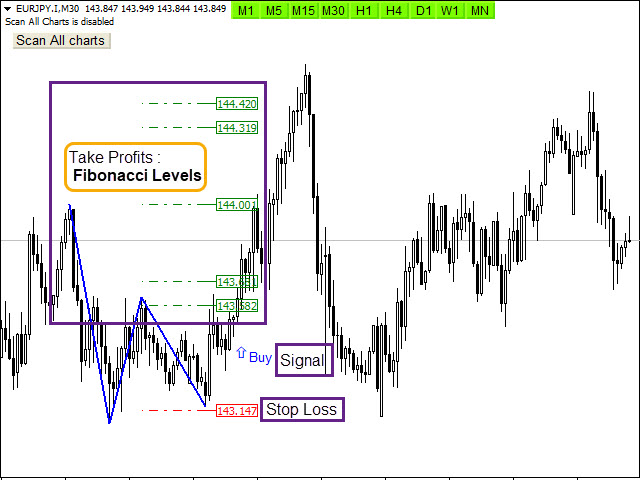
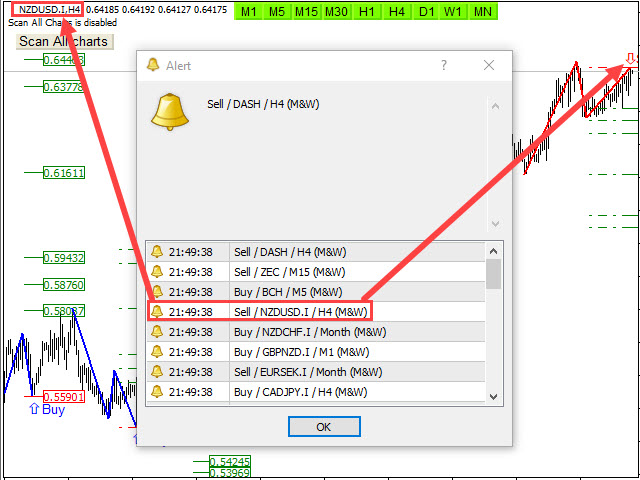
El indicador M W Scannerescanea todos los gráficos con sólo pulsar un botón. Tiene stop loss, Take profits y niveles de punto de entrada conel uso de los niveles de Fibonacci y la comprobación de velas para encontrar el mejor punto de entrada y salida de la negociación. Encuentra señales de inmediato con alarma y notificación para el comercio fácil.
Características principales:
- Detecta la mejor y más común tendencia de reversión exitosa: Doble Top(M) Pattern, Doble Bottom(W) Pattern, Doble top bottom
- Indicador fácil de usar
- NO repinta
- Botón de escaneo detodos los gráficos ( Forex, Crypto, Índices y materias primas )
- Selecciona y deselecciona marcos de tiempo para escanear (M1,M5,M15,M30,H1,H4,D1,W1,MN)
- Muestra y empuja la notificación de stop-loss, take profits y los niveles de punto de entrada
- Comprobación de velas para el mejor punto de entrada
- Utilizalos niveles de Fibonacci
- Envío de la alerta y notificación push
- Método Engulfing/breakout - Engulfing en el borde del patrón / Breakout cuello del patrón
- Activación/desactivación de la alerta en función de la hora configurada
- Ajuste la configuración del patrón
Parámetros de entrada :
=========Scanner============
- Escanear todos los gráficos - Activar
- Escanear el número de velas - Cantidad de barras históricas a evaluar
- Re-scan Timer - Re-scan todos losgráficos entodos los marcos de tiempo después de pasar el tiempo
- Modo = Engulfing/breakout -Engulfing en el borde del patrón / Breakout cuello del patrón
=======Display/style Options============
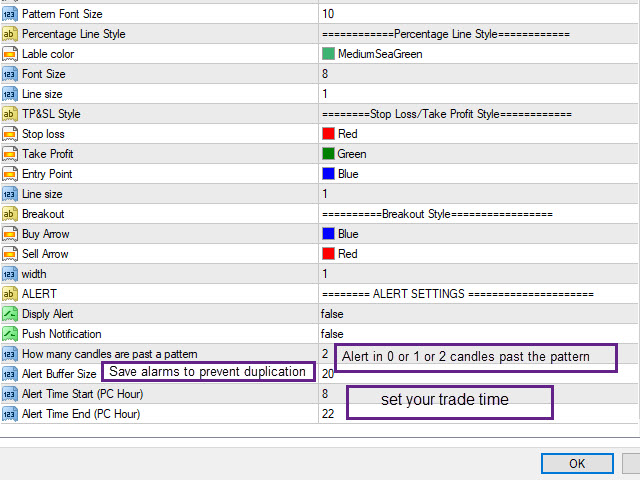
- Opciones de visualización - Mostrar o no SL & TP & Niveles de entrada
- Niveles de Stop Loss y Estilo de Breakout - Configurar las Fuentes y colores de los patrones
========CONFIGURACIÓN DE ALERTAS ==========
- Mostrar Alerta o Notificación Push - Activar o desactivar Alerta o Notificación Push
- Cuántas velas han pasado de un patrón - Número máximo de velas pasadas de un patrón para permitir la alerta
- Tamaño del Buffer de Alerta - Máximo de alertas guardadas para evitar alertas duplicadas
- Hora de inicio/fin de la alerta - Determina las horas de negociación basándose en el reloj del ordenador para activar y desactivar la alarma


I’ve purchased many indicators, and this author’s products are the most simple and straightforward. There’s nothing flashy—just clear and precise signals. Moreover, the signals are highly accurate; as long as you enter according to the conditions, you can consistently make stable profits.