• Información general
  • Comentarios (3)
  • Discusión (7)
  • Novedades

Doji Finder Indicator MT5

4
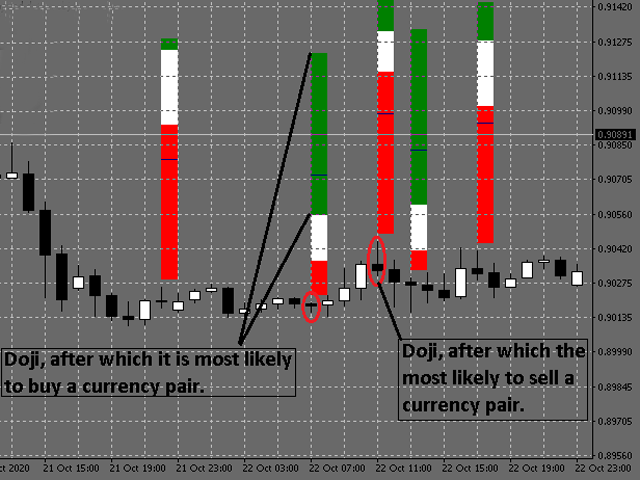
El indicador analiza el gráfico e identifica las velas Doji. Muestra su apariencia y señala la apariencia de dicha vela (si se permite en los parámetros). Además, este indicador muestra la fuerza de la reversión en forma de barras de diferentes colores (cuanto más verde, más probable es una subida, más rojo, una caída en el precio). La dirección de la señal depende de la dirección de las velas anteriores, ya que el Doji indica una reversión o corrección. En la configuración del indicador, puede cambiar los parámetros de la vela Doji, cuyo cierre será una señal. La aparición frecuente de una señal está fuertemente influenciada por el número de velas anteriores en una dirección antes de la reversión de Doji (cuanto más larga sea la tendencia antes de la reversión, más confiable puede ser la señal, pero con una gran cantidad de velas en una dirección, las señales serán muy raras).

En la configuración, también puede configurar la posibilidad de señalización y los colores de las flechas en el gráfico.

Parámetros de entrada

  • History: el período del historial del gráfico (el número de velas anteriores) donde buscar las velas de señal Doji anteriores;
  • MinLongShadowPercent - longitud mínima de la sombra de la vela (cuanto más larga es la sombra de la vela, mejor es la señal de inversión, pero menos señales), 1-99%;
  • MaxCandleBodyPercent - la longitud máxima del cuerpo de la vela (cuanto más grande es el cuerpo de la vela, menos similar es a Doji y más débil es la inversión), 0,1% - 20%;
  • CountLastCandles: el número de velas anteriores en una dirección antes de la inversión de Doji (1-10);
  • MinCandleLenghtPercent: la longitud mínima del candelabro Doji en porcentaje con respecto a varios anteriores (0 = apagado, 1-200%);
  • EnableAlert: habilita o deshabilita una alerta cuando aparece una señal Doji al cierre de la última vela;
  • ArrowBuyColor: color de la flecha cuando aparece una señal de compra;
  • ArrowSellColor: color de la flecha cuando aparece una señal de venta;
  • IndicatorBarsThickness: cambia el grosor de las líneas indicadoras (0: se dibujan barras del mismo tamaño, según el período de tiempo).


Comentarios 3
Rudolf Strahm
199
Rudolf Strahm 2021.11.22 16:07 
 

Bin am Testen sieht gut aus

Productos recomendados
Basic Harmonic Pattern MT5
Mehran Sepah Mansoor
4.79 (53)
Este indicador identifica los   patrones armónicos   más populares que predicen los puntos de reversión del mercado. Estos patrones armónicos son formaciones de precios que se repiten constantemente en el mercado de divisas y sugieren posibles movimientos futuros de los precios /   Free MT4 Version Además, este indicador tiene incorporada una señal de entrada en el mercado, así como varios take profits y stop losses. Debe tenerse en cuenta que aunque el indicador de patrón armónico puede propor
FREE
This is a demo version of the Candle Absorption Full indicator. It has limitations on operation. This indicator detects the Engulfing candlestick pattern and draws the corresponding market entry signal. Features It works only with EURUSD on timeframes M1 and M5. The indicator analyzes a combination of 2 or 3 candlesticks depending on settings. The number of pre-calculated bars (signals) is configurable. The indicator can send an alert to notify of a found signal. Signal can be filtered by sett
FREE
Forex Indicator Arrows
NGUYEN NGHIEM DUY
1 (1)
Forex Indicator Arrows is an arrow Indicator used as an assistant tool for your trading strategy. The indicator analyzes the standard deviation of bar close for a given period and generates a buy or sell signals if the deviation increases. It good to combo with Martingale EA to follow Trend and Sellect Buy Only/Sell Only for EA work Semi-Automatic. You can use this  Indicator with any EAs in my Products.
FREE
This indicator is designed to detect high probability reversal patterns: Double Tops/Bottoms with fake breakouts . This is the FREE version of the indicator: https://www.mql5.com/en/market/product/29957 The free version works only on EURUSD and GBPUSD! Double top and bottom patterns are chart patterns that occur when the trading instrument moves in a similar pattern to the letter "W" (double bottom) or "M" (double top). The patterns usually occur at the end of a trend and are used to signal tren
FREE
This Mt5 Indicator Signals when there is two opposite direction bars engulfed by current bar.  has a recent Exponential Moving Average Cross and past bar was oversold/bought Expert Advisor Available in Comments  Free Version Here : https://www.mql5.com/en/market/product/110114?source=Site&nbsp ; Full Alerts for mt5 terminal , phone , email, print to file, print to journal  Buy Signal ( blue line ) Past ema cross ( set at 30 bars back ) Past bar rsi is oversold ( level 40  ) Engulfing bar closes
FREE
Time to Trade Trading timing indicator is based on market volatility through 2 ATR indicators to determine the timing of a transaction. The indicator determines the times when the market has strong volatility in trend. When histogram is greater than 0 (blue) is a strong market, when histogram is less than 0 (yellow) is a weak market. Should only trade within histograms greater than 0. Based on the histogram chart, the first histogram value is greater than 0 and the second histogram appears, this
FREE
Japanese candlestick analysis has been in existence for hundreds of years and is a valid form of technical analysis. Candlestick charting has its roots in the militaristic culture that was prevalent in Japan in the 1700s. One sees many terms throughout the Japanese literature on this topic that reference military analogies, such as the Three White Soldiers pattern Unlike more conventional charting methods, candlestick charting gives a deeper look into the mind-set of investors, helping to establ
FREE
Aussenstab
Rainer Schnoege
5 (1)
The outside bar indicator shows a range of inside bars and the breakout up and down from the range. The breakout is always displayed at the start of a new range and is extended until another breakout. The calculation always takes place at the start of a new candle. So it is displayed accordingly in all time frames. In inside bar (  insidebar ) trading you can see the top and bottom of a range. In outside bar (  outsidebar ) trading, the breakout from a range and thus the trend following. The c
FREE
Introduction to the Candle Time Indicator The Candle Time Indicator for MetaTrader 5, helps users know how much time on a candlestick is remaining. Overview of Candle Time Indicator settings. TextColor: set the color of the countdown clock; FontSize: set the size of the font; Installation Guide Copy and paste the CandleTime.ex5 indicator files into the MQL5 folder of the Metatrader 5 trading platform. You can gain access to this folder by clicking the top menu options, that goes as follows: Fi
FREE
This indicator is an automated version of the Fibonacci retracement (Fib) indicator. Deciding the best areas to use when drawing the fib can be tricky and this  indicator was made with that in mind. When you drop it on the chart it will automatically choose the best points to draw the fib with, but in case you aren't satisfied with those regions, you can adjust it as you wish.
FREE
Peak Trough Analysis is the great tool to detect peaks and troughs in your chart. Peak Trough Analysis tool can use three different peaks and troughs detection algorithm. The three algorithm include the orignal Fractals Indicator by Bill Williams, the Modified Fractals indicator and ZigZag indicator. You can use this peak and trough analysis tool to detect the price pattern made up from Equilibrium Fractal-Wave process. For further usage, there are good guide line on how to use this peak trough
FREE
This indicator looks for 3 rather strong patterns: Spinning Top pattern Hammer or Hanging Man Inverted Hammer or Shooting Star These patterns may indicate a trend continuation or its reversal, depending on the location of the patterns. Input parameters Distance - distance between the signal and the formed signal Note: the higher the timeframe, the greater the value should be used in Distance to display the signal correctly Indicator Features Suitable for any currency pair Operating timeframe
FREE
Nuestro indicador de   Patrones Básicos de Velas   hace que identificar los principales patrones de velas sea más fácil que nunca. Descubra patrones como el Martillo, la Estrella Vespertina, los Tres Soldados Blancos y muchos más con sólo echar un vistazo a su gráfico. Con una interfaz intuitiva y señales visuales claras, nuestro indicador le ayuda a identificar oportunidades de trading de forma rápida y precisa /   Versión MT4 Dashboard Scanner para este indicador: ( Basic Candlestick Patterns
FREE
Super Fractals
Aurthur Musendame
5 (4)
Think of the Super Fractal Indicator as the Bill WIlliams Indicator on Steroids. Indicator Abilities: 1. Adjust Candle around Fractal High or Low. 2. Adjust Lookback period and only plot for a specific number of history candles avoiding cluttering your trading desk. 3. The Indicator uses buffers so you call and use it from any EA. Note : The higher the candles around Fractal, the stronger the Turning point anfd viceversa is true.
FREE
Bounce Zone MT5
Nguyen Thanh Cong
4.2 (5)
Introduction The Bounce Zone indicator is a cutting-edge non-repainting technical tool built to identify key areas on the price chart where market sentiment is likely to cause a significant price reversal. Using advanced algorithms and historical price data analysis, this indicator pinpoints potential bounce zones. Combined with other entry signal, this indicator can help forex traders place the best trades possible Signal A possible buy signal is generated when price is in the green zo
FREE
Virtual Targets MT5
Hoang Van Dien
4.6 (5)
This indicator is very useful for day traders or short term traders. (MT5 version) No need to calculate the number of pips manually, just look at the chart and you will see the Virtual Take Profit / Virtual Stop Loss target line and evaluate whether the entry point is feasible to reach the intended target or not. Enter the intended   Take Profit / Stop Loss   pips for your trade. The indicator will display   Virtual Take Profit / Virtual Stop Loss   lines for you to easily see if the target i
FREE
Basic Supply Demand MT5
Mehran Sepah Mansoor
4.89 (19)
El indicador   básico de oferta y demanda   es una potente herramienta diseñada para mejorar su análisis de mercado y ayudarle a identificar áreas clave de oportunidad en cualquier gráfico. Con una interfaz intuitiva y fácil de usar, este indicador gratuito de Metatrader le ofrece una visión clara de las zonas de oferta y demanda, lo que le permite tomar decisiones de trading más informadas y precisas /   Versión gratuita para MT4 Escáner del cuadro de mando para este indicador: ( Basic Supply
FREE
Free automatic Fibonacci is an indicator that automatically plots a Fibonacci retracement based on the number of bars you select on the BarsToScan setting in the indicator. The Fibonacci is automatically updated in real time as new highest and lowest values appears amongst the selected bars. You can select which level values to be displayed in the indicator settings. You can also select the color of the levels thus enabling the trader to be able to attach the indicator several times with differe
FREE
Cybertrade Keltner Channels
Emanuel Andriato
4.75 (4)
Cybertrade Keltner Channels - MT5 Created by Chester Keltner, this is a volatility indicator used by technical analysis. It is possible to follow the trend of financial asset prices and generate support and resistance patterns. In addition, envelopes are a way of tracking volatility in order to identify opportunities to buy and sell these assets. It works on periods longer than the period visible on the chart. All values ​​are available in the form of buffers to simplify possible automations.
FREE
What is this indicator? This indicator is the Stochastic Oscillator supporting Virtual Trading mode of   Knots Compositor . When the mode is turned on, the indicator will be recalculated based on the displayed candlesticks. When the mode is turned off, the indicator will be recalculated based on the original chart candlesticks. KC-Indicators -   KC-MA   (Moving Average) -   KC-ENV   (Envelopes) -   KC-BB   (Bollinger Bands) -   KC-ADX   (Average Directional Movement Index) -   KC-MACD   (Mo
FREE
Inside Bar Radar
Flavio Javier Jarabeck
4.6 (5)
The Inside Bar pattern is a very well known candlestick formation used widely by traders all over the world and in any marketplace. This approach is very simple and adds a little confirmation candle, so it adds a third past candlestick to the count to confirm the direction of the move (upward or downward). Obviously, there is no power on this candlestick formation if the trader has no context on what it is happening on the market he/she is operating, so this is not magic, this "radar" is only a
FREE
RenkoExpert
Andrey Goida
4 (4)
Renko Expert Advisor based on Renko bar simulation.    The EA has two options for building Renko bars. Classic and ATR. In the classic version, renko bars are marked with areas on the main chart; in the ATR version, renko bars are modeled and drawn in the indicator window. Modeling renko bars inside the EA allows you to optimize the robot better than drawing renko bars offline.      Telegramm channel   Set file Our second robot RENKOTREND Does not use martingale!  Trades opened by the robot co
FREE
WaPreviousCandleLevelsMT5
Wachinou Lionnel Pyrrhus Sovi Guidi
!!!This Free Version just works on EURUSD!!! Wa Previous Candle Levels MT5 shows the previous candle levels, it shows the previous candle Open High Low Close levels (OHLC Levels) in different time frame. It's designed to help the trader to analyse the market and pay attention to the previous candle levels in different time frame.  We all know that the OHLC Levels in Monthly, Weekly and Daily are really strong and must of the time, the price strongly reacts at those levels. In the technical anal
FREE
RSI Condition: The Relative Strength Index (RSI) for the current period is below a specified low threshold (RsiLow). This indicates oversold conditions. Candlestick Pattern: It checks for a specific candlestick pattern across three consecutive candles: The current candle (1) closes higher than it opens (bullish) The previous candle (2) closes lower than it opens (bearish) The current candle's close is below the high of the previous candle Price Action: The alert also checks that the curre
FREE
Full Fractals MT5
Sergey Ermolov
4.58 (12)
MT4 version  |  Indicador Owl Smart Levels  |  Estrategia Owl Smart Levels  |   FAQ El   Indicador Fractals   es uno de los elementos de la estrategia comercial del autor de Bill Williams. Se utiliza para buscar puntos de inversión de precios en el gráfico de precios y, en consecuencia, niveles de soporte y resistencia. El   Indicador Full Fractals   es un Fractals mejorado que está disponible en el conjunto de herramientas de casi todos los terminales comerciales. Su única diferencia es que pa
FREE
Double Tops And Bottoms MT5
Alexander Nikolaev
4.83 (6)
Este indicador busca y muestra los patrones de análisis técnico Double Bottom y Double Top. Señala (muestra un mensaje en la pantalla) si la forma se formó recientemente. A menudo, después de la aparición de estos patrones, la tendencia se invierte o se produce una corrección. Para no buscarlos usted mismo o no perderse su apariencia, es suficiente agregar un indicador al gráfico. El indicador se puede usar en diferentes marcos temporales y pares de divisas, existen configuraciones para una mej
FREE
Dail Session Open Lines
Aurthur Musendame
4.33 (9)
Daily session open lines shows the traders three important trading session opens. By default it is set up to show you: Zero GMT Open Line London Open Session Line New York Open Session Line The default times are set according to GMT+2 and as such you are able to change and customise according to your specific time zone. The Indicator is usefull specially for the trader who trades the London and NewYork sessions.
FREE
Fractals Direction ST Patterns MT5 is a modification of Bill Williams' Fractals indicator, which allows you to specify any number of bars for finding a fractal. In the settings, it is also possible to set the number of points for determining the trend direction. The upward direction is determined if the last upper fractal is higher than the penultimate upper fractal. The downward direction is determined if the last lower fractal is lower than the penultimate lower fractal. This simple indicator
FREE
Trend Master Chart MT5
Frederic Jacques Collomb
5 (1)
Trend Master Chart es el indicador de tendencia que necesita. Se superpone al gráfico y utiliza códigos de colores para definir diferentes tendencias/movimientos del mercado. Utiliza un algoritmo que combina dos medias móviles y diferentes osciladores. Los periodos de estos tres elementos son modificables. Funciona en cualquier período de tiempo y en cualquier par. De un vistazo podrás identificar una tendencia alcista o bajista y los diferentes puntos de entrada a esta tendencia. Por ejemplo
FREE
DALA Forecast
Grigorii Matsnev
About the indicator: DALA Forecast is a universal tool for predicting the dynamics of time series of any nature. For prediction, modified methods of nonlinear dynamics analysis are used, on the basis of which a predictive model is built using machine learning methods.  To get the trial version of the indicator, you can contact me in private messages. How to use the indicator: Apply the indicator to your chosen financial instrument or indicator with the settings you need. The prediction will b
FREE
Los compradores de este producto también adquieren
TPSproTREND PrO MT5
Roman Podpora
4.89 (9)
TPSpro TREND PRO  - is a trend indicator that automatically analyzes the market and provides information about the trend and each of its changes, as well as giving signals for entering trades without redrawing! The indicator uses each candle, analyzing them separately. referring to different impulses - up or down impulse. Exact entry points into transactions for currencies, crypto, metals, stocks, indices!  Version MT4               DETAILED DESCRIPTION               R ecommended to use with an
Atomic Analyst MT5
Issam Kassas
4.56 (18)
En primer lugar, vale la pena enfatizar que este Indicador de Trading no repinta, no redibuja y no se retrasa, lo que lo hace ideal tanto para el trading manual como para el automatizado. Manual del usuario: configuraciones, entradas y estrategia. El Analista Atómico es un Indicador de Acción del Precio PA que utiliza la fuerza y el impulso del precio para encontrar una mejor ventaja en el mercado. Equipado con filtros avanzados que ayudan a eliminar ruidos y señales falsas, y aumentan el poten
TPSpro RFI Levels MT5
Roman Podpora
4.7 (10)
反转第一脉冲水平 (RFI)     指示     俄羅斯     -        ESP   Recomendamos utilizar con   el indicador -   TPSpro 趋势专业版 -   MT5版本 Un elemento clave importante en el comercio son las zonas o niveles a partir de los cuales se toman decisiones para comprar o vender un instrumento comercial. A pesar de los intentos de los grandes actores de ocultar su presencia en el mercado, inevitablemente dejan rastros. Nuestra tarea era aprender a encontrar estos rastros e interpretarlos correctamente. Funciones principales:
Atbot
Zaha Feiz
4.97 (34)
AtBot: Cómo funciona y cómo usarlo ### Cómo funciona El indicador "AtBot" para la plataforma MT5 genera señales de compra y venta utilizando una combinación de herramientas de análisis técnico. Integra la Media Móvil Simple (SMA), la Media Móvil Exponencial (EMA) y el índice de Rango Verdadero Promedio (ATR) para identificar oportunidades de trading. Además, puede utilizar velas Heikin Ashi para mejorar la precisión de las señales. Deja una reseña después de la compra y recibe un regalo especia
Gold Stuff mt5
Vasiliy Strukov
4.92 (163)
Gold Stuff mt5: un indicador de tendencia diseñado específicamente para el oro, también se puede usar en cualquier instrumento financiero. El indicador no se vuelve a dibujar ni se retrasa. El marco de tiempo recomendado es H1. IMPORTANTE! Póngase en contacto conmigo inmediatamente después de la compra para obtener instrucciones y bonificación!   Puede obtener una copia gratuita de nuestro indicador Strong Support y Trend Scanner, por favor envíe un mensaje privado. ¡a mí! PARÁMETROS Draw
Primero que todo, vale la pena enfatizar que este Sistema de Trading es un Indicador No Repintado, No Redibujado y No Retrasado, lo que lo hace ideal tanto para el trading manual como para el automatizado. Curso en línea, manual y descarga de ajustes preestablecidos. El "Sistema de Trading Inteligente MT5" es una solución completa de trading diseñada para traders nuevos y experimentados. Combina más de 10 indicadores premium y presenta más de 7 estrategias de trading robustas, lo que lo convie
Quantum Trend Sniper
Bogdan Ion Puscasu
4.79 (48)
Introduciendo       Indicador Quantum Trend Sniper   , el innovador indicador MQL5 que está transformando la forma en que identificas y negocias los cambios de tendencia. Desarrollado por un equipo de comerciantes experimentados con experiencia comercial de más de 13 años,       Indicador de francotirador de tendencia cuántica       está diseñado para impulsar su viaje comercial a nuevas alturas con su forma innovadora de identificar cambios de tendencia con una precisión extremadamente alta.
Trend Screener Pro MT5
STE S.S.COMPANY
4.87 (62)
Desbloquee el poder del comercio de tendencias con el indicador Trend Screener: ¡su solución definitiva para el comercio de tendencias impulsada por lógica difusa y un sistema multidivisa!Mejore su comercio de tendencias con Trend Screener, el revolucionario indicador de tendencias impulsado por lógica difusa. Es un poderoso indicador de seguimiento de tendencias que combina más de 13 herramientas y funciones premium y 3 estrategias comerciales, lo que lo convierte en una opción versátil para co
FX Power MT5 NG
Daniel Stein
5 (5)
Obtenga su actualización diaria del mercado con detalles y capturas de pantalla a través de nuestro Morning Briefing aquí en mql5 y en Telegram ! FX Power MT5 NG es la nueva generación de nuestro popular medidor de fuerza de divisas, FX Power. ¿Y qué ofrece este medidor de fuerza de nueva generación? Todo lo que le encantaba del FX Power original PLUS Análisis de fuerza de ORO/XAU Resultados de cálculo aún más precisos Períodos de análisis configurables individualmente Límite de cálculo persona
Este es un genial indicador para MT5 que ofrece señales precisas para entrar en una transacción sin redibujar. Se puede aplicar a cualquier activo financiero: fórex, criptomonedas, metales, acciones, índices. Nos dará valoraciones bastante precisas y nos dirá cuándo es mejor abrir y cerra una transacción. Eche un vistazo  al vídeo  (6:22), ¡contiene un ejemplo de procesamiento de una sola señal que ha amortizado el indicador! La mayoría de los tráders mejoran sus resultados comerciales durante l
FX Volume MT5
Daniel Stein
4.93 (14)
Obtenga su actualización diaria del mercado con detalles y capturas de pantalla a través de nuestro Morning Briefing aquí en mql5 y en Telegram ! FX Volume es el PRIMER y ÚNICO indicador de volumen que proporciona una visión REAL del sentimiento del mercado desde el punto de vista de un bróker. Proporciona una visión impresionante de cómo los participantes institucionales del mercado, como los brokers, están posicionados en el mercado Forex, mucho más rápido que los informes COT. Ver esta info
IX Power MT5
Daniel Stein
4.17 (6)
IX Power   lleva por fin la insuperable precisión de FX Power a los símbolos que no son de Forex. Determina con exactitud la intensidad de las tendencias a corto, medio y largo plazo de tus índices, acciones, materias primas, ETF e incluso criptodivisas favoritas. Puede   analizar todo lo   que su terminal le ofrece. Pruébalo y experimenta cómo   tu timing mejora significativamente   a la hora de operar. Características principales de IX Power Resultados de cálculo 100% precisos y sin rep
Black Dragon indicator mt5
Ramil Minniakhmetov
4.81 (53)
El indicador de detección de tendencias complementará cualquier estrategia y también se puede utilizar como una herramienta independiente. Ventajas Fácil de usar, no sobrecarga el gráfico con información innecesaria; Puede usarse como filtro para cualquier estrategia; Tiene niveles integrados de soporte y resistencia dinámicos, que se pueden usar tanto para obtener ganancias como para establecer límites de pérdidas; El indicador no cambia de color después de que se cierra la vela;  Funciona
ATrend
Zaha Feiz
4.75 (4)
ATREND: Cómo Funciona y Cómo Usarlo #### Cómo Funciona El indicador "ATREND" para la plataforma MT5 está diseñado para proporcionar a los traders señales de compra y venta robustas mediante una combinación de metodologías de análisis técnico. Este indicador utiliza principalmente el Rango Verdadero Promedio (ATR) para medir la volatilidad, junto con algoritmos de detección de tendencias para identificar posibles movimientos del mercado. Deja un mensaje después de la compra y recibe un regalo es
Advanced Supply Demand MT5
Bernhard Schweigert
4.5 (14)
¡Actualmente con 33% de descuento! ¡La mejor solución para cualquier tráder principiante o experto! Este indicador es una herramienta comercial única, de alta calidad y asequible, porque incorpora una serie de características patentadas y una nueva fórmula. Con esta actualización, podrá mostrar zonas de doble marco temporal. No solo podrá mostrar un marco temporal más alto, sino también mostrar ambos, el marco temporal del gráfico MÁS el marco temporal más alto: MOSTRANDO ZONAS ANIDADAS. A todos
** All Symbols x All Timeframes scan just by pressing scanner button ** *** Contact me  to send you instruction and add you in "123 scanner group" for sharing or seeing experiences with other users. After 17 years of experience in the markets and programming, Winner indicator is ready. I would like to share with you! Introduction The 123 Pattern Scanner indicator with a special enhanced algorithm is a very repetitive common pattern finder with a high success rate . Interestingly, this Winner in
Auto Order Block with break of structure based on ICT and Smart Money Concepts (SMC) Futures Break of Structure ( BoS )             Order block ( OB )            Higher time frame Order block / Point of Interest ( POI )    shown on current chart           Fair value Gap ( FVG ) / Imbalance   -  MTF      ( Multi Time Frame )    HH/LL/HL/LH  -  MTF      ( Multi Time Frame )  Choch  MTF      ( Multi Time Frame )  Volume Imbalance     ,  MTF          vIMB Gap’s Power of 3 Equal High
ICT, SMC, SMART MONEY CONCEPTS, SMART MONEY, Smart Money Concept, Support and Resistance, Trend Analysis, Price Action, Market Structure, Order Blocks, BOS/CHoCH,   Breaker Blocks ,  Momentum Shift,   Supply&Demand Zone/Order Blocks , Strong Imbalance,   HH/LL/HL/LH,    Fair Value Gap, FVG,  Premium  &   Discount   Zones, Fibonacci Retracement, OTE, Buy Side Liquidity, Sell Side Liquidity, BSL/SSL Taken, Equal Highs & Lows, MTF Dashboard, Multiple Time Frame, BigBar, HTF OB, HTF Market Structure
FxaccurateLS
Shiv Raj Kumawat
WHY IS OUR FXACCCURATE LS MT5 THE PROFITABLE ? PROTECT YOUR CAPITAL WITH RISK MANAGEMENT Gives entry, stop and target levels from time to time. It finds Trading opportunities by analyzing what the price is doing during established trends. POWERFUL INDICATOR FOR A RELIABLE STRATEGIES We have made these indicators with a lot of years of hard work. It is made at a very advanced level. Established trends provide dozens of trading opportunities, but most trend indicators completely ignore them!
Matrix Arrow Indicator MT5
Juvenille Emperor Limited
5 (12)
Matrix Arrow Indicator MT5   es una tendencia única 10 en 1 que sigue un indicador   100% sin repintado   de marcos temporales múltiples que se puede usar en todos los símbolos/instrumentos:   divisas ,   materias primas ,   criptomonedas ,   índices ,   acciones .  Matrix Arrow Indicator MT5  determinará la tendencia actual en sus primeras etapas, recopilando información y datos de hasta 10 indicadores estándar, que son: Índice de movimiento direccional promedio (ADX) Índice de canales de prod
Ahora $ 147 (aumentando a $ 499 después de algunas actualizaciones) - Cuentas ilimitadas (PC o Mac) Manual de usuario de RelicusRoad + Videos de capacitación + Acceso al grupo privado de Discord + Estado VIP UNA NUEVA MANERA DE VER EL MERCADO RelicusRoad es el indicador comercial más poderoso del mundo para divisas, futuros, criptomonedas, acciones e índices, y brinda a los comerciantes toda la información y las herramientas que necesitan para mantenerse rentables. Brindamos análisis téc
Was: $249  Now: $99   Market Profile defines a number of day types that can help the trader to determine market behaviour. A key feature is the Value Area, representing the range of price action where 70% of trading took place. Understanding the Value Area can give traders valuable insight into market direction and establish the higher odds trade. It is an excellent addition to any system you may be using. Inspired by Jim Dalton’s book “Mind Over Markets”, this indicator is designed to suit the
Este tablero muestra los últimos   patrones armónicos   disponibles para los símbolos seleccionados, por lo que ahorrará tiempo y será más eficiente /   versión MT4 . Indicador gratuito:   Basic Harmonic Pattern Columnas del indicador Symbol:   aparecerán los símbolos seleccionados Trend :   alcista o bajista Pattern :   tipo de patrón (gartley, mariposa, murciélago, cangrejo, tiburón, cifrado o ABCD) Entry :   precio de entrada SL:   precio de stop loss TP1:   1er precio de toma de benefici
AW Trend Predictor MT5
AW Trading Software Limited
4.75 (51)
La combinación de niveles de tendencia y ruptura en un sistema. Un algoritmo de indicador avanzado filtra el ruido del mercado, determina la tendencia, los puntos de entrada y los posibles niveles de salida. Las señales indicadoras se registran en un módulo estadístico, que le permite seleccionar las herramientas más adecuadas, mostrando la efectividad del historial de señales. El indicador calcula las marcas Take Profit y Stop Loss. Manual e instrucciones ->   AQUÍ   / Versión MT4 ->   AQUÍ Có
Conviértase en un Breaker Trader y obtenga beneficios de los cambios en la estructura del mercado a medida que se invierte el precio. El indicador de ruptura de bloque de órdenes identifica cuándo una tendencia o movimiento de precio se acerca al agotamiento y está listo para revertirse. Le alerta sobre cambios en la estructura del mercado que generalmente ocurren cuando una reversión o un retroceso importante están a punto de suceder. El indicador utiliza un cálculo patentado que identific
Ante todo, vale la pena enfatizar que esta Herramienta de Trading es un Indicador No Repintado, No Redibujado y No Retrasado, lo que la hace ideal para el trading profesional. Curso en línea, manual del usuario y demostración. El Indicador de Conceptos de Acción del Precio Inteligente es una herramienta muy potente tanto para traders nuevos como experimentados. Combina más de 20 indicadores útiles en uno solo, combinando ideas avanzadas de trading como el Análisis del Trader del Círculo Inte
TPA True Price Action indicator reveals the true price action of the market makers through 100% non-repainting signals strictly at the close of a candle! TPA shows entries and re-entries, every time the bulls are definitely stronger than the bears and vice versa. Not to confuse with red/green candles. The shift of power gets confirmed at the earliest stage and is ONE exit strategy of several. There are available now two free parts of the TPA User Guide for our customers. The first "The Basics"
Difícil de encontrar y escasa en frecuencia, las divergencias son uno de los escenarios comerciales más confiables. Este indicador busca y escanea las divergencias regulares y ocultas automáticamente usando su oscilador favorito. [ Guía de instalación | Guía de actualización | Solución de problemas | FAQ | Todos los productos ] Fácil de comerciar Encuentra divergencias regulares y ocultas Admite muchos osciladores bien conocidos Implementa señales comerciales basadas en rupturas Muestra n
Easy By Sell is a market indicator for opening and closing positions. It becomes easy to track market entries with alerts. It indicates trend reversal points when a price reaches extreme values ​​and the most favorable time to enter the market. it is as effective as a Fibonacci to find a level but it uses different tools such as an algorithm based on ATR indicators and Stochastic Oscillator. You can modify these two parameters as you wish to adapt the settings to the desired period. My othe
Volume Order Blocks MT5
Suvashish Halder
5 (6)
Introducing the Volume Order Blocks indicator, a game-changing tool designed for traders who demand precision and clarity in their market analysis. This advanced indicator not only identifies order blocks but also integrates crucial volumetric data, allowing you to gauge the strength of these blocks with unparalleled accuracy. MT4 version -  https://www.mql5.com/en/market/product/121237/ Key Features of the Volume Order Blocks: Bullish & Bearish Order Blocks: Easily visualize and differentiat
Otros productos de este autor
Double Tops And Bottoms MT5
Alexander Nikolaev
4.83 (6)
Este indicador busca y muestra los patrones de análisis técnico Double Bottom y Double Top. Señala (muestra un mensaje en la pantalla) si la forma se formó recientemente. A menudo, después de la aparición de estos patrones, la tendencia se invierte o se produce una corrección. Para no buscarlos usted mismo o no perderse su apariencia, es suficiente agregar un indicador al gráfico. El indicador se puede usar en diferentes marcos temporales y pares de divisas, existen configuraciones para una mej
FREE
This EA is easy to use, it does not have too complicated settings and algorithms for performing trading operations. It’s not optimized for long, it may appeal to those who recently decided to engage in trading on the exchange with the help of advisers, or who do not want to understand the settings for a long time. The basis of his work is several indicators (moving average, RSI, stochastic, ATR). Despite its simplicity, it has a custom trailing stop function, which can reduce the risks for a dep
ADX Channel Indicator
Alexander Nikolaev
4.8 (5)
Este indicador forma un canal basado en las lecturas del indicador ADX (índice de movimiento direccional promedio), muestra e informa al comerciante de una reversión del precio en los límites de este canal y también puede informar cuando el precio toca los límites del canal. También dibuja líneas de puntos adicionales, que dependen de las lecturas + DI y -DI del indicador ADX. También tiene una opción para filtrar señales en función de las lecturas estocásticas. El canal dibujado por este indic
FREE
Este asesor experto encuentra patrones de análisis técnico que a menudo aparecen antes de un cambio de tendencia: doble fondo, triple fondo, cabeza y hombros y sus contrapartes opuestas. El Asesor Experto puede identificarlos en el gráfico de un par de divisas y operar cuando se ha formado el patrón y se ha roto. Además, para operar excluyendo señales innecesarias (por ejemplo, con volatilidad débil), puede ajustar y optimizar las lecturas de algunos indicadores (estocástico, ADX) y el filtro p
Volume levels are an important indicator for stock trading. In the past, most of the trades were made at these levels, or these trades were made by large traders. In the future, the price often bounces off such levels, and this can be successfully applied in trading. This Expert Advisor is able to determine volume levels based on trade in history. It is based on an indicator that displays levels: https://www.mql5.com/en/market/product/65562 , but besides displaying, it can trade from levels. In
Indicador gratuito para detectar rápidamente rupturas de líneas de tendencia y altas o bajas de un rango de precios. Muestra líneas basadas en los máximos y mínimos de los precios, y también encuentra y muestra líneas de tendencia inclinadas. Tan pronto como el precio sobrepasa la línea y la vela se cierra, el indicador lo indica con una flecha (también puede habilitar una alerta). Este indicador es fácil de usar y también gratuito. El número de velas para definir líneas de tendencia, así como
FREE
Easy Bollinger Bands
Alexander Nikolaev
4.67 (3)
This Expert Advisor trades based on the Bollinger Bands indicator. It performs trades after a price rebound from the borderlines of the indicator. It is simple to use, contains only a few settings, which are easy to understand. This is the simplified version of the Master Bollinger Bands Expert Advisor. For better trading results, it is recommended to use the full version of the EA: https://www.mql5.com/en/market/product/21788 The free version does not provide the ability to use multiple indicat
FREE
Easy Parabolic Sar
Alexander Nikolaev
4.4 (5)
The Expert Advisor places orders based on the points of the Parabolic Sar indicator. If your trading strategy utilizes this indicator, the EA will save you from the necessity to move your pending orders after every candlestick (e.g. 5 minutes or 1 hour) and will do it automatically. You can set the EA to open only BuyStop or only SellStop or both. Buy default both Buy and Sell are enabled. The EA does not use any indicators other than Parapolic Sar. Therefore you are to decide the time to run th
FREE
ADX Channel
Alexander Nikolaev
4.67 (3)
ADX Channel is an indicator that plots the channel depending on the values of the ADX (Average Directional Movement Index) indicator. The resulting channel is a little similar to the Envelopes, but its lines depend on the market volatility. The sell trade is usually executed fast when the price touches and bounces from the upper line of the channel, buy - from the lower. It is recommended to trade when there is no significant news. The recommended timeframes: M5 - H1. The indicator is not design
FREE
Easy Channels
Alexander Nikolaev
4 (1)
The indicator draws price channels. It can be customized so that only buy or sell channels are displayed. Also, trend lines can be displayed instead of channels. This indicator is easy to use, but nevertheless, there are many trading strategies based on channel trading. Advisor based on this indicator:  https://www.mql5.com/en/market/product/37952 Parameters History - maximum number of bars to build channels; Distance - minimum distance from one High (or Low) to another when constructing a chann
FREE
Trend and correction indicator
Alexander Nikolaev
4.17 (6)
The indicator finds strong trend movements of a currency pair over the specified number of bars. It also finds correction to this trend. When the trend is strong enough, and the correction becomes equal to the values specified in the parameters, the indicator generates a signal. You can set different correction values, while the best suiting are 38, 50 and 62 (Fibonacci levels). In addition, you can configure the minimum length of trend, the number of history bars for search and other parameters
FREE
Este Asesor Experto encuentra la dirección de la tendencia del par de divisas en un número determinado de barras, después de eso, determina el momento de la corrección. Si la tendencia es lo suficientemente fuerte y la corrección se vuelve igual a la especificada en los parámetros, entonces el EA opera en la dirección de la tendencia (pero solo si las lecturas adicionales del indicador confirman la apertura de una operación). Dado que este EA funciona con correcciones, no comprará en el máximo
Una ruptura de una línea de tendencia, así como una alta o baja, generalmente indica un cambio (o continuación) de la tendencia. Este indicador muestra líneas en los máximos y mínimos del precio, así como también encuentra y muestra líneas de tendencia inclinadas. Tan pronto como el precio sobrepasa la línea y la vela se cierra, el indicador lo indica con una flecha (también puede habilitar alertas). Este indicador es fácil de usar, sin embargo, hay muchas estrategias comerciales que se basan e
Colored candles
Alexander Nikolaev
Some candles have a strong tendency to continue the movement or to revert it. With the help of the Colored candles indicator such movements are clearly visible. This indicator calculates the parameters of each candle, as well as its volume, and after that it paints the candles depending on its strength and direction. Bullish candles are colored green and bearish candles - red. The greater the power of the bulls or the bears, the brighter the color. You can change the colors if you want. The indi
This utility is the improved version of Trailing stop for advisors. It manages other EAs' orders as well as the ones opened manually. It is capable of trailing the price (trailing stop function), set a stop loss and take profit if they have not been set before. The Pro version features the ability to set trailing stop based on fractals and points of Parabolic SAR. When configuring the utility for an EA having no trailing stop function, place it to the new window with the same currency pair speci
Easy Candles
Alexander Nikolaev
3 (1)
This is a simple and free Expert Advisor that trades candlesticks. It compares several nearest bars and their volumes, and opens a trade based on that data. Unlike the professional version , it analyzes only 1 timeframe. The recommended timeframes for this EA are H1, H4, D1, it works with any currency pairs. The parameters always need to be optimized before trading, as well as after some period of trading. Input Parameters Lots - lot size (if Lots=0, then the lot will be calculated based on th
FREE
Este indicador puede determinar los niveles de precios en los que hubo más volumen durante el período histórico especificado. En el futuro, el precio a menudo rebota en esos niveles y esto se puede aplicar con éxito en el comercio. Se muestran como líneas, algunos parámetros para determinar los niveles se pueden ajustar. Este indicador es una versión gratuita de Volume Levels MT5, por lo que no proporciona señales y la construcción de niveles se limita a un par de divisas EUR / USD. Para todos l
FREE
Break Lines
Alexander Nikolaev
4.67 (3)
The indicator draws lines the the price highs and lows. Break through the high or low usually indicates trend change (or continuation). Once the price moves through a line, and the candlestick closes, the indicator draws an appropriate arrow (also, you can enable alerts). A deal should be conducted in the breakthrough direction immediately or after a slight rollback. It is best to trade following the trend on a larger timeframe. This indicator is easy to use, but nevertheless, there are many tra
FREE
Bollinger with WPR demo
Alexander Nikolaev
4.33 (3)
This Expert Advisor is the free version of "Bollinger with WPR scalper", which is based on the Bollinger bands and Williams' Percent Range indicators. Limitations of the free version: lot is fixed to 0.01, only the EURUSD currency pair is supported, trading time cannot be selected, trailing stop is not available. Nevertheless, it can make quite a lot of deals, so you do not have to wait for positions to be opened (with the appropriate settings and timeframes below H1). The EA can be used on time
FREE
Easy Channels MT5
Alexander Nikolaev
5 (1)
This indicator draws price channels. Easy to use. It has various settings, for example, you can configure it to show channels only for buy or sell, you can display trend lines instead of channels. There are many trading strategies that are based on trading in channels, you can trade on the rebound from the borders of the channels, or the breakdown of the channel.   Parameters History - the maximum number of bars for building channels; Distance - the minimum distance from one maximum (or minimum
Volume Levels USDJPY
Alexander Nikolaev
3.5 (2)
Volume Levels is a very important indicator for exchange trading. Most of the trades were performed on those levels. This indicator displays the price level that had the most trade volumes over a certain period of time. Often, the price bounces from those levels in the future, and it can be successfully used in trading. This is a demo version that works only on the USD/JPY currency pair. To work on all currency pairs, install the full version: https://www.mql5.com/en/market/product/15888 Param
FREE
Moving averages are very often used for analyzing currency pairs and trading. This Expert Advisor can analyze many moving averages at once and trade based on this. When the required number of moving averages signal a purchase, the adviser makes a purchase, if the indicators signal a sale, the advisor sells. Also, there is filtering spurious signals at low volatility based on the ADX indicator. In the settings of the adviser, you can set the required number of sliding ones, their period (the init
This Expert Advisor identifies trend reversals based on fractals and some other indicators. It is a free lite version of Three fractals Brief description of the trading strategy: when the fractals were formed after a prolonged fall, and the last fractal did not update the minimum of the previous bar's lower fractal, then a trend reversal is determined (at the same time, there must be a fractal in the middle, which is higher than the others). Similarly, opposite for growth. In case other indicato
FREE
This EA implements the EMA 8/18 strategy, which is used by many traders. Brief description of the strategy: The Buy is determined when the EMA 8 indicator crosses the EMA 18 from below, with the price moving more than 50 points from the crossing. The buy position is opened when the price touches the EMA for the first time, after that, as the price rises, the trade is maintained by a trailing stop with a step of 30-35 points. The opposite is for opening a sell position. The parameters of the fast
El Asesor Experto detecta velas Doji en el gráfico y abre tratos cuando aparecen (si cumplen con los parámetros especificados). Además, el EA también puede comerciar con velas envolventes. Puede mostrar las velas en las que está operando, también muestra cómo está configurada la vela de señal. Los ajustes exactos de las velas de señalización se pueden cambiar y optimizar. Además, el Asesor Experto tiene configuraciones para indicadores adicionales para filtrar las entradas comerciales y puede a
This EA trades with the trend using several methods to identify and enter a trade. For example, it uses trendlines, Gator and Stochastic indicators to analyze the market. In addition to trading, it can also display trend lines that it trades based on. It has filters for ADX and MA indicators, as well as a sufficient number of settings to be able to optimize on various currency pairs and timeframes. The EA sets stop loss and take profit for each trade, does not have risky trading methods. It i
Colored Candles Demo
Alexander Nikolaev
5 (1)
The demo version of the Colored Candles indicator - calculates the parameters of each candle, as well as its volume. After that, it paints the candles depending on their strength and direction. Bullish candles are colored green and bearish candles - red. The greater the power of the bulls or the bears, the brighter the color. You can change the colors if you want. The indicator helps to analyze the price movement, as well as market entry points. The more accurate signals are formed on the higher
FREE
Trailing stop for advisors
Alexander Nikolaev
4.5 (2)
The utility manages other EAs' orders as well as the ones opened manually. It is capable of trailing the price (trailing stop function), set a stop loss and take profit if they have not been set before. When configuring the utility for an EA having no trailing stop function, place it to the new window with the same currency pair specifying the same Magic value (as for the EA orders the stop loss is to be applied to). You can set any timeframe. It does not affect the utility operation. Set Magic
FREE
Volume Candles
Alexander Nikolaev
Volumes are one of the most important factors of trading, as it is the high volumes that move the market in either direction. But there are very few standard indicators for volumes in MetaTrader 4. The Volume Candles analyses the volumes of the trades and displays candles depending on these volumes. The candle appears once the required number of volumes has passed during trading (the VolumeCandle parameter). If the candles close frequently and are thin, then the volumes on the market are current
Volume Levels
Alexander Nikolaev
5 (3)
Volume Levels is a very important indicator for exchange trading. Most of the trades were performed on those levels. This indicator displays the price level that had the most trade volumes over a certain period of time. Often, the price bounces from those levels in the future, and it can be successfully used in trading. It works on any currency pair. Parameters HistoryBars - the number of bars to determine the near volume levels; Range - the maximum distance above and below the current price t
Filtro:
zainshah94
105
zainshah94 2024.04.03 03:40 
 

El usuario no ha dejado ningún comentario para su valoración

Rudolf Strahm
199
Rudolf Strahm 2021.11.22 16:07 
 

Bin am Testen sieht gut aus

Alexander Nikolaev
61154
Respuesta del desarrollador Alexander Nikolaev 2021.11.22 21:53
Thank you for your feedback.
Aleksandr Tamonin
4107
Aleksandr Tamonin 2021.01.13 18:35 
 

El usuario no ha dejado ningún comentario para su valoración

Alexander Nikolaev
61154
Respuesta del desarrollador Alexander Nikolaev 2021.11.22 21:52
Спасибо за отзыв.
Respuesta al comentario
Versión 1.2 2020.11.29
Added setting for the thickness of the indicator bars.
Versión 1.1 2020.11.25
Improved drawing of indicator bars on history.