Seconds Heiken Ashi
- Indicadores
- Versión: 1.12
- Actualizado: 17 noviembre 2021
- Activaciones: 5

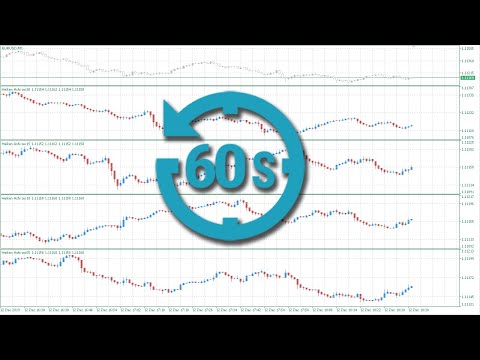
El indicador muestra en una ventana separada un gráfico de precios en forma de velas Heiken Ashi con una periodicidad inferior a un minuto.
Períodos disponibles (segundos): 30, 20, 15, 12, 10, 6, 5, 4, 3, 2, 1.
Es posible seleccionar el precio base para los cálculos.
Parámetros
- Marcos de tiempo - el período de velas en segundos.
- Conteo de niveles de precios - el número de niveles de precios en un gráfico.
- Precio aplicado - el precio utilizado en los cálculos.
Número del buffer: 0 - Heiken Ashi Open, 1 - Heiken Ashi High, 2 - Heiken Ashi Low, 3 - Heiken Ashi Close.