ReboltDelta
- Indicators
- Version: 1.0
- Activations: 5
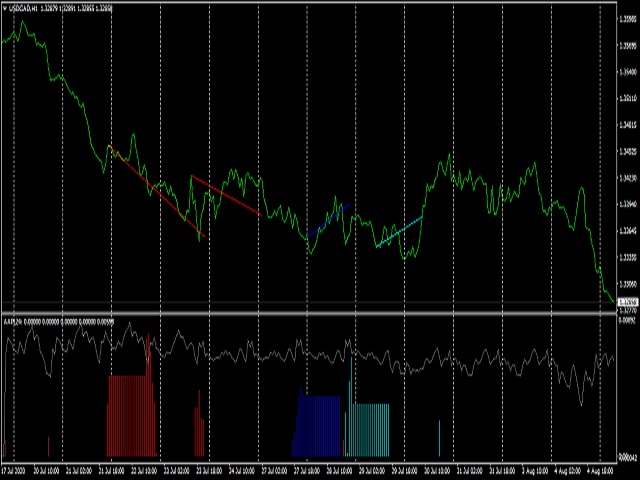
Rebalance Overlay Technology (Rebolt) enables the trader to visualize the flow of money from one chart to another chart.
Rebolt Delta (ReboltDelta) indicates the probable price change that will occur in the target chart based on changes in the source chart.
ReboltDelta is designed for use in cooperation with Rebolt Probability.
La tecnología de superposición de reequilibrio (Rebolt) permite al operador visualizar el flujo de dinero de un gráfico a otro gráfico. Rebolt Delta (ReboltDelta) indica el probable cambio de precio que se producirá en el gráfico de destino en función de los cambios en el gráfico de origen. ReboltDelta está diseñado para su uso en cooperación con Rebolt Probability.