Highlighted Candle Signs MT5
- Indicators
-
Luis Paulo Rodrigues Pastor
 Hello, we develop indicators and EA according to your needs.
Contact us if we can meet your demand.
Follow our page on Instagram @tradingbots.br - Version: 4.0
- Updated: 25 November 2020
- Activations: 5
Indicator designed to give investors the advantage of identifying strong candlestick patterns in real time by staining candlesticks representing these patterns, using possible buy or sell performance. The color for each pattern identified by the parameter indicator according to your taste.
The candlestick patterns identified by this indicator are:
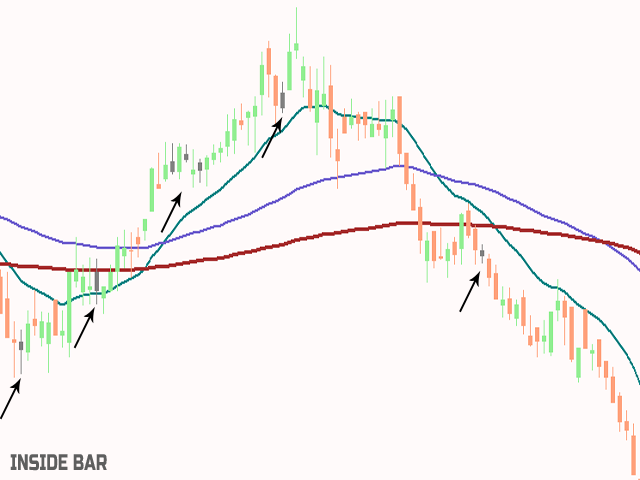
- Inside Bar
- Closing Price Reverse Top (PFRA)
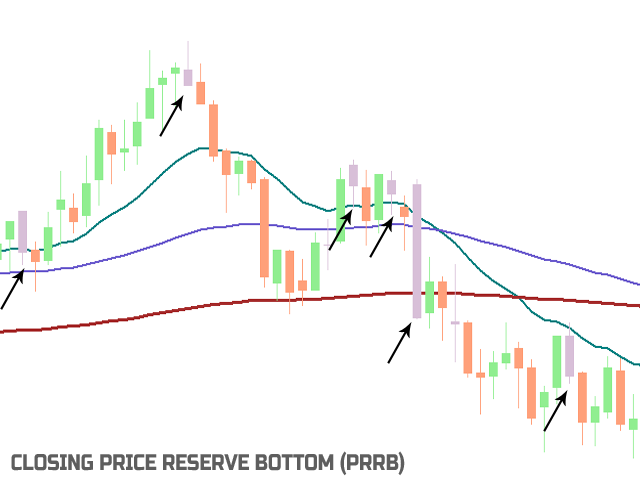
- Closing Price Reverse Bottom (PFRB)
- Dave Landry
- Bullish Engulf
- Bearish Engulf
Advantages:
- Real Time
- At each tick, the color of the candle changes if it is forming one of the patterns specified above, this allows to anticipate the closing of the candle and make the position.
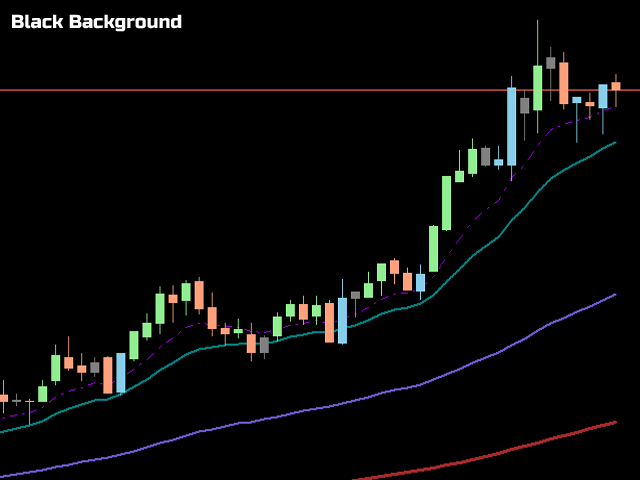
- Contrast and Configurable Default Colors
- To make the patterns easier to see, well-contrasted colors have been set by default, which are clearly visible on both white and black backgrounds, but if necessary, the colors are fully configurable in the indicator settings.
- Choose which patterns to display.
- If you are not using all the patterns that the indicator identifies, you have the option to disable it, making the chart view clearer. By default, the Inner Bar and High Reverse Closing Price defaults are already enabled.
Description of Standards:
Inside Bar: has its high and low contained between the high and low of the previous candle.
Closing Price Reverse Top (PFRA): has its low lower than the low of the previous candlestick, and close above the close of the previous candlestick.
Closing Price Reverse Bottom (PFRB): has its high greater than the high of the previous candlestick, and closes below the close of the previous candlestick.
Dave Landry: has its lowest lower than the low of the previous two candles.
Bullish Engulf: must be a bullish candlestick, with a body larger than the sum of its shadows, and the previous candlestick should be bearish and have a lower actual trading volume. You can set the body size of the bullish candlestick in relation to the previous one so that it is considered a bullish swallow
Bearish Engulf: should be a bearish candlestick, with a body larger than the sum of its shadows, and the previous candlestick should be bullish and have a lower actual trading volume. You can set the body size of the bearish candle over the previous one so that it is considered a bearish engulf.
Comments:
The indicator does not define or display any entry, stop loss or take profit points, it is up to the investor to set such points according to his strategy.
Author:
Luis Paulo Pastor, computer scientist, investor and private speculator.

Doesn't work. As in when you activate it to the chart nothing shows up as described by the creator.