Footprint Flow Studio

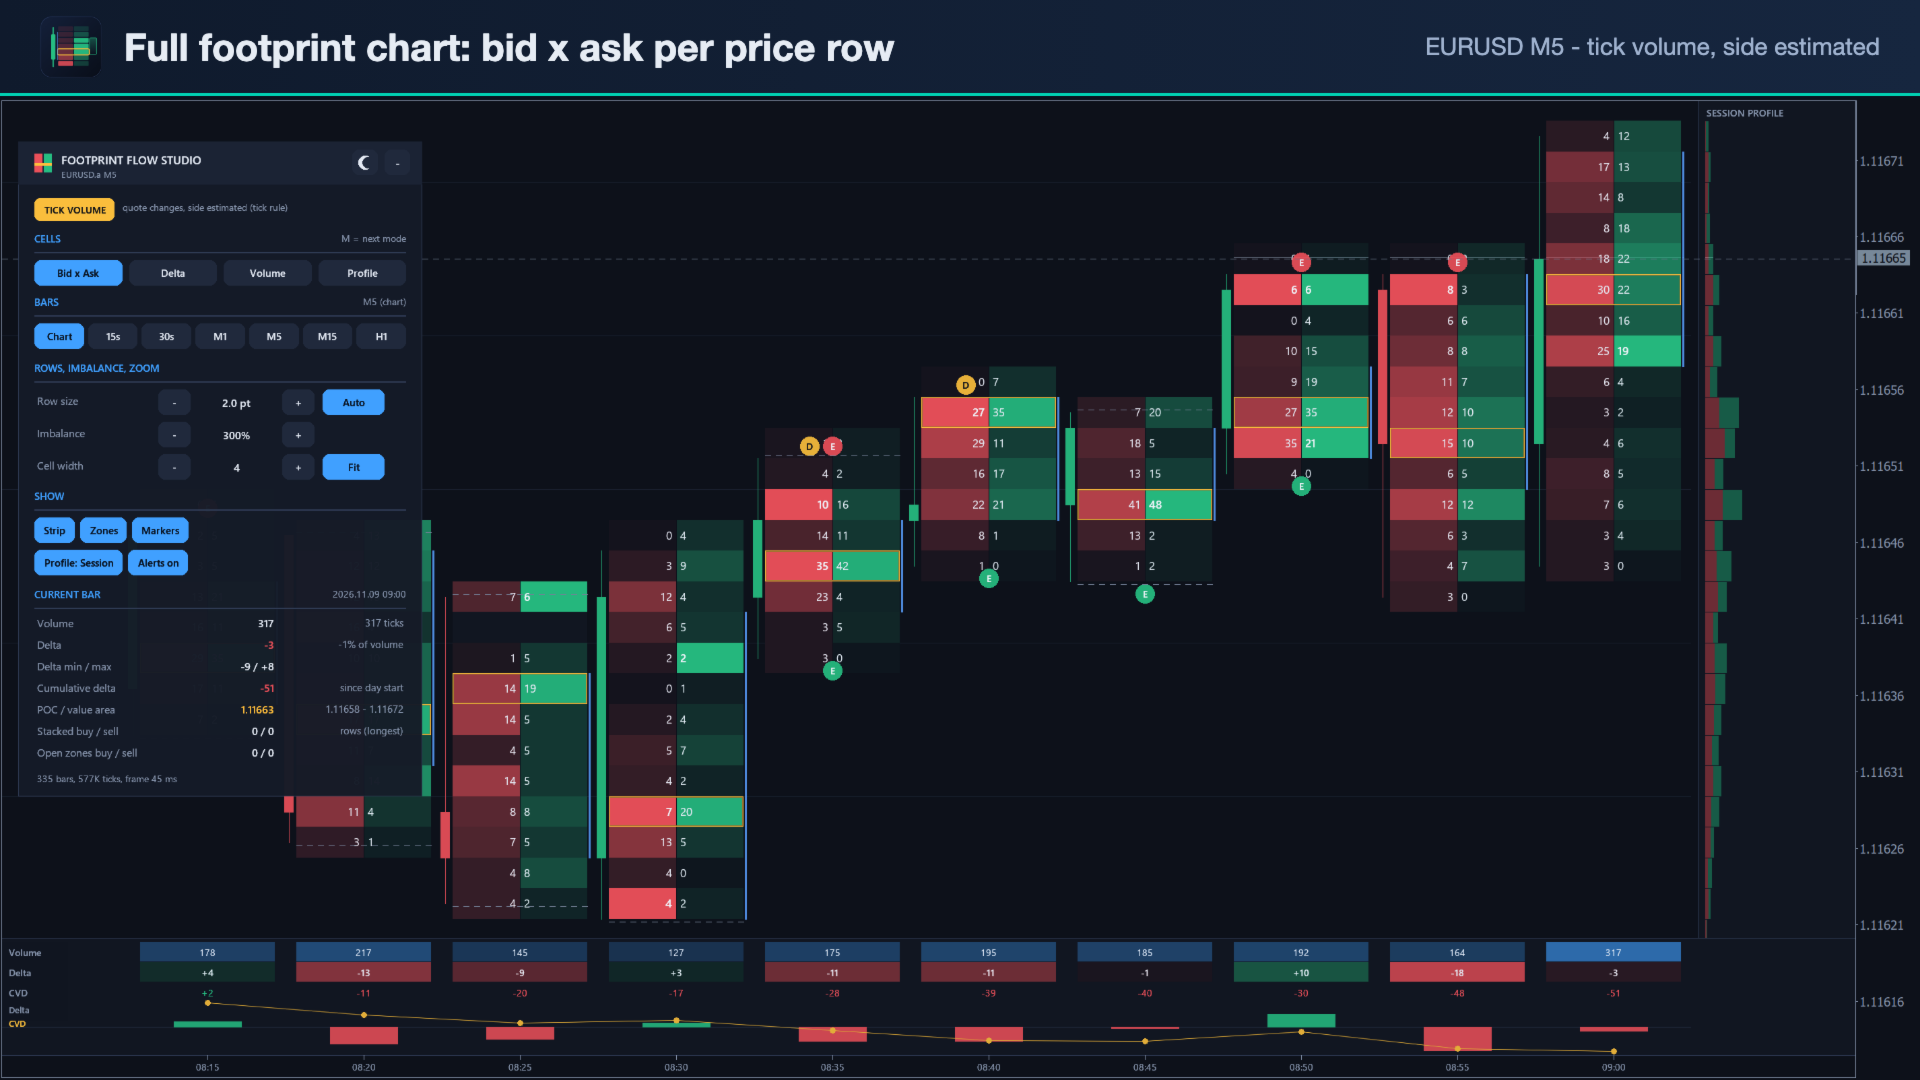
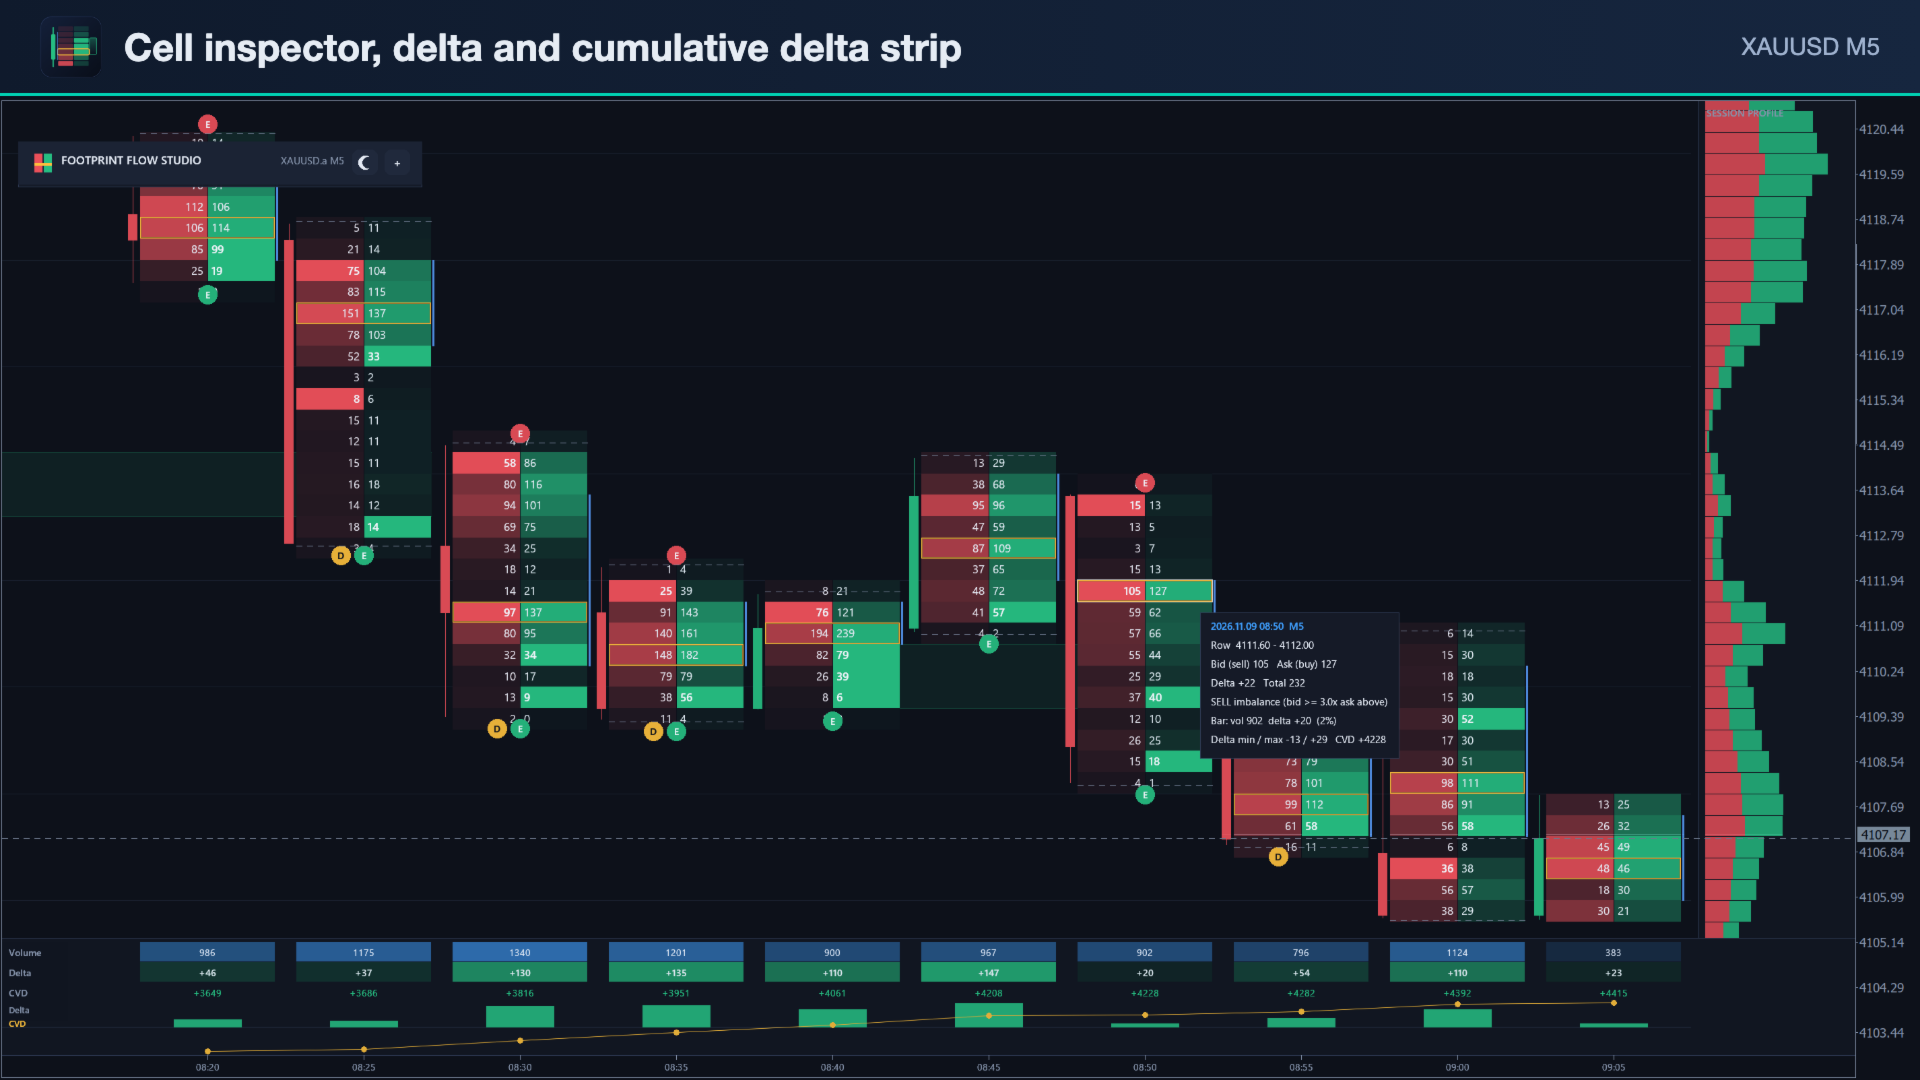
Footprint Flow Studio turns a MetaTrader 5 chart into a full footprint chart. Every bar is split into price rows, and each row shows how much was traded on the bid and on the ask. You see where buyers and sellers were aggressive, where they were absorbed, and where an auction ran out, bar by bar.

The panel always shows which data is used. Forex and CFD symbols in MT5 only have tick volume: every quote change counts as 1, and the buy/sell side is estimated from the direction of the price change. This shows where the activity was and which way price was pushed, but it is not exchange order flow, and the numbers will differ from a futures data feed. Symbols with exchange trades (futures, stocks and some crypto feeds) use real volume, and the side then comes from the broker's trade data. The panel badge reads REAL VOLUME or TICK VOLUME and lists the classification method used.

Footprint cells

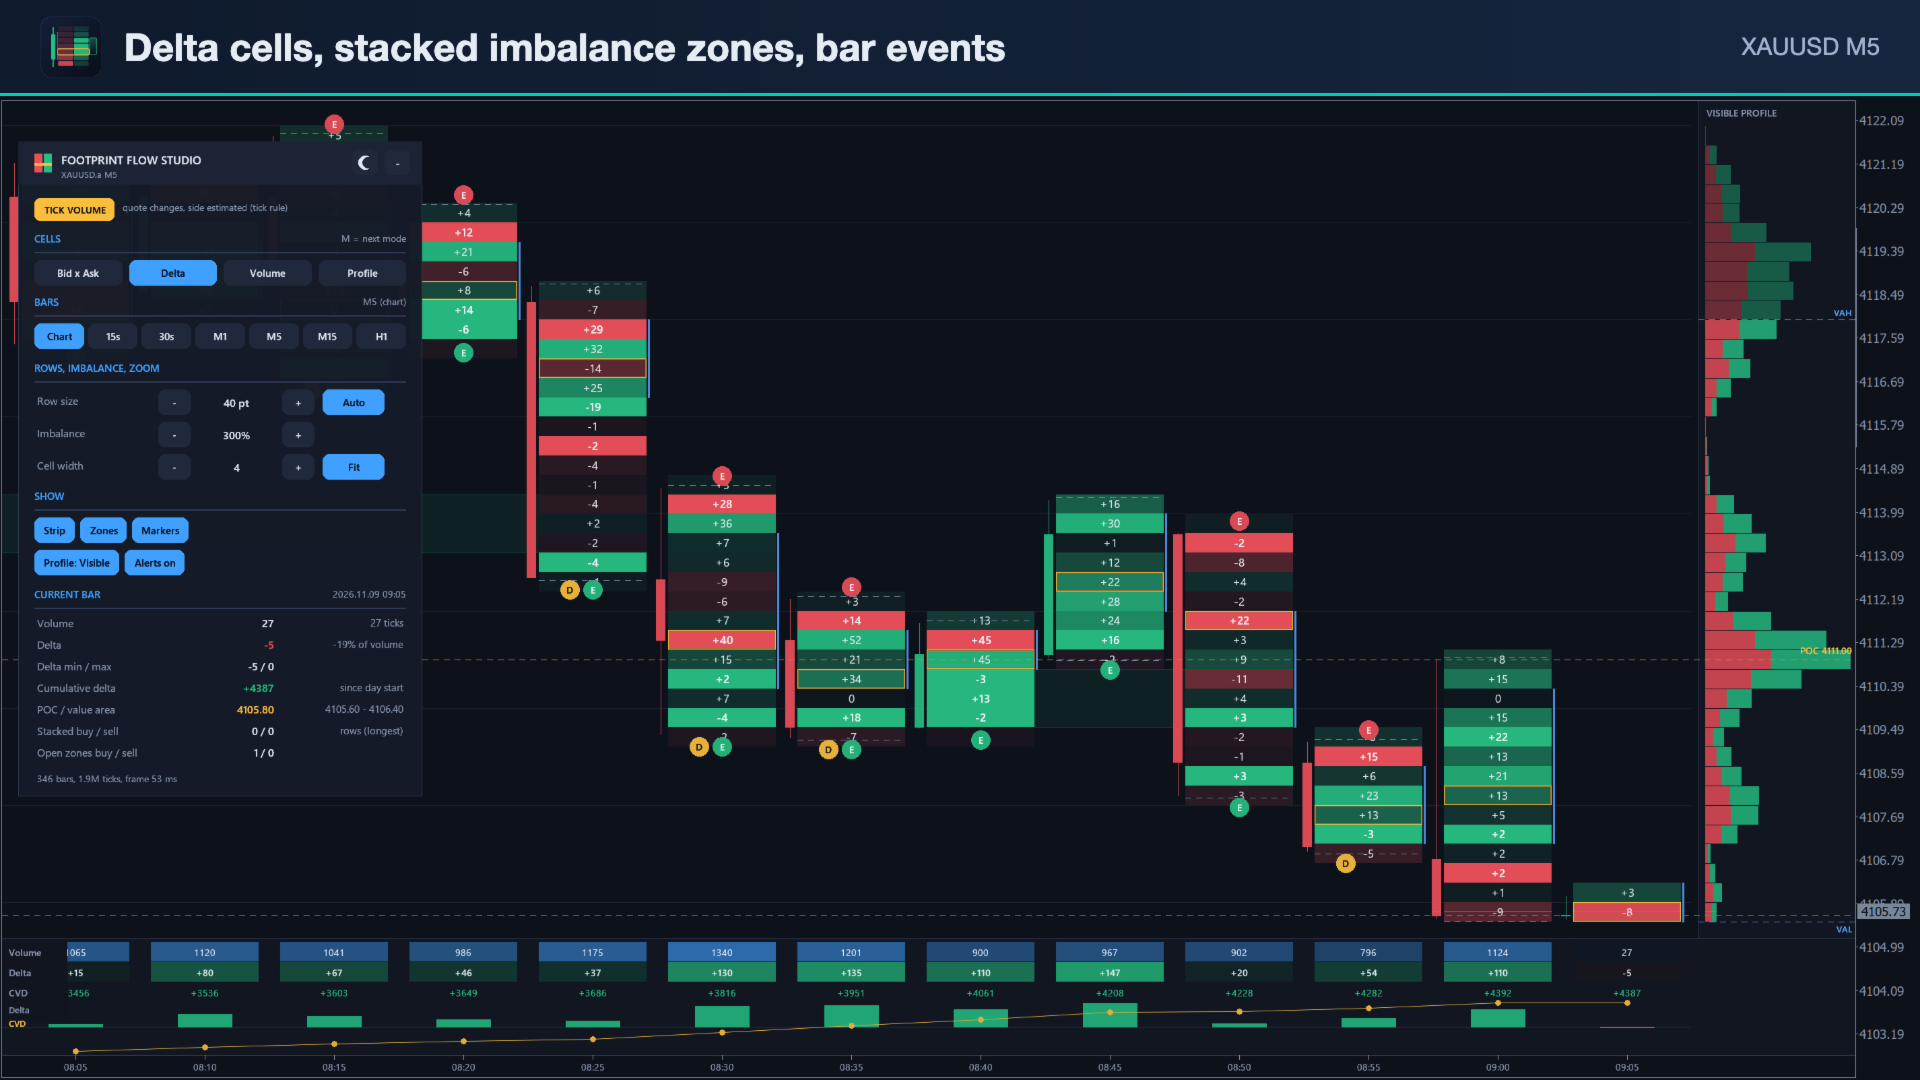
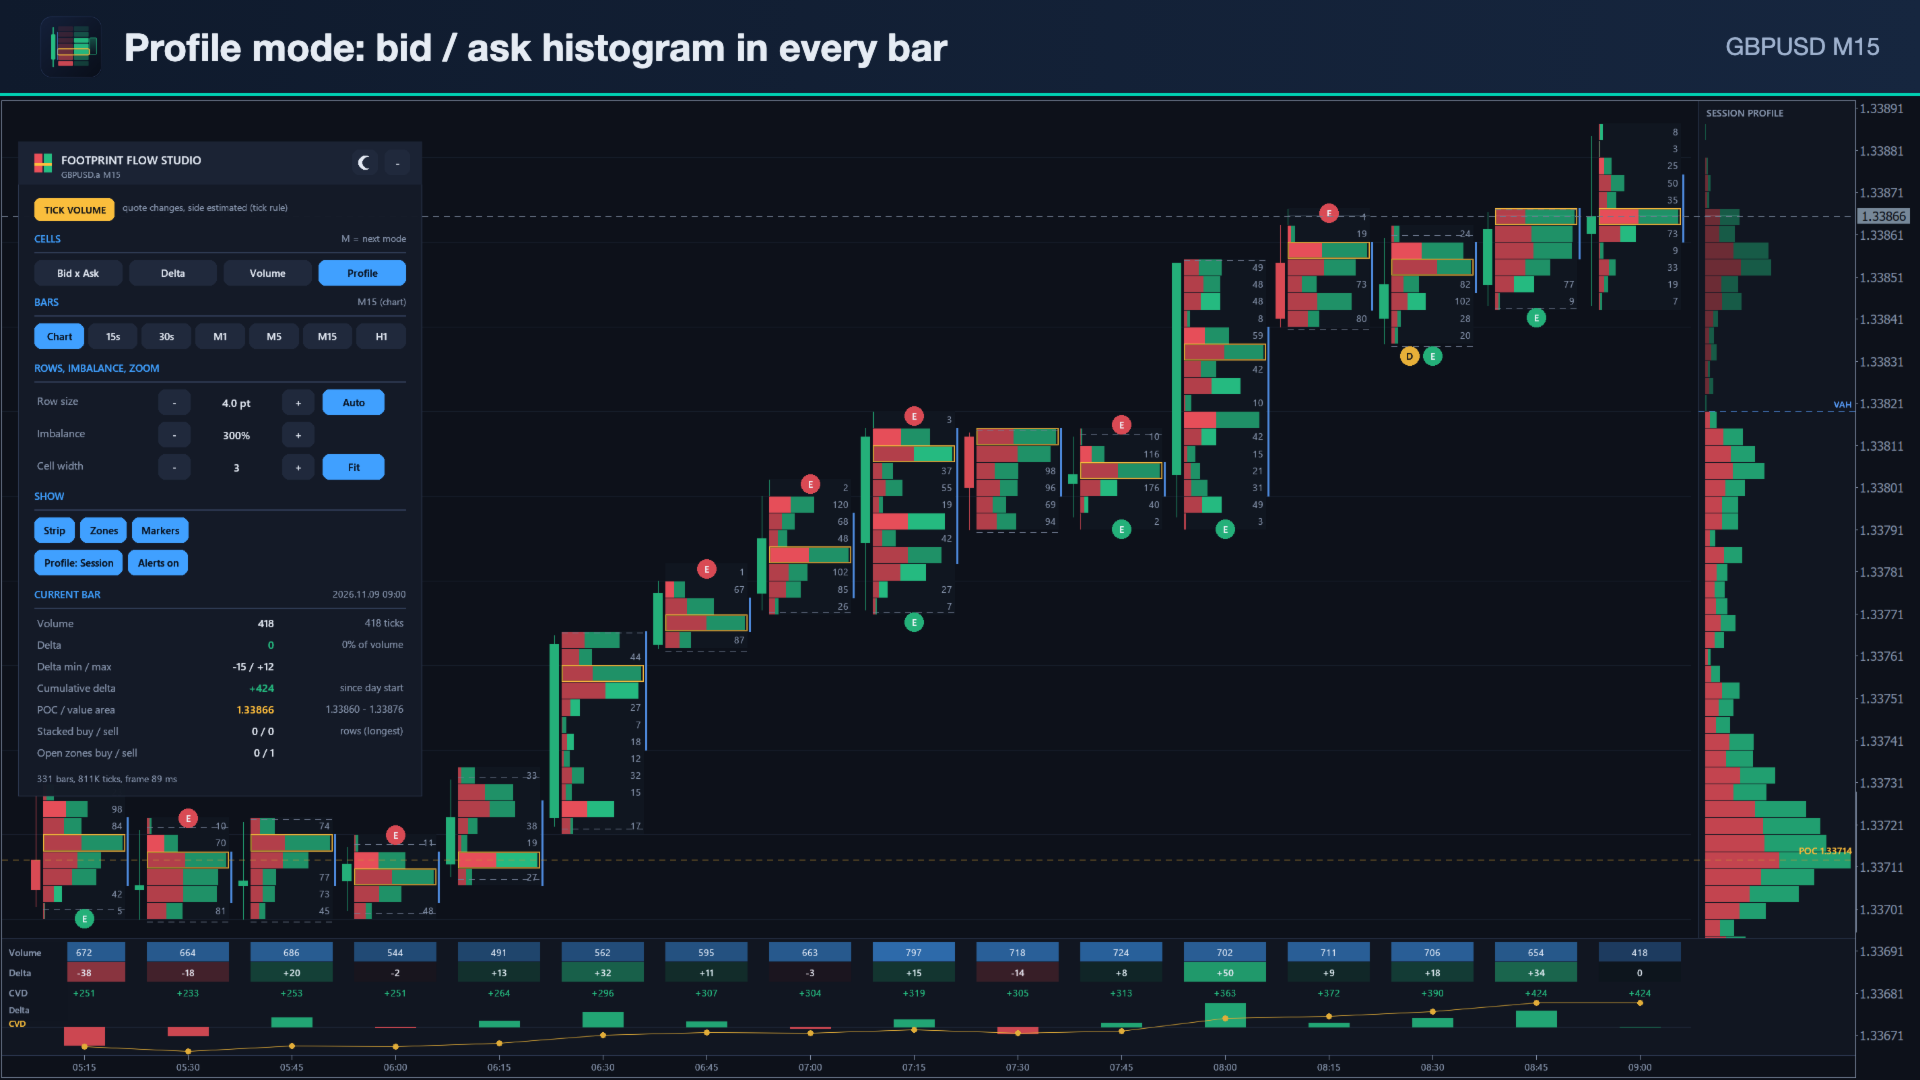
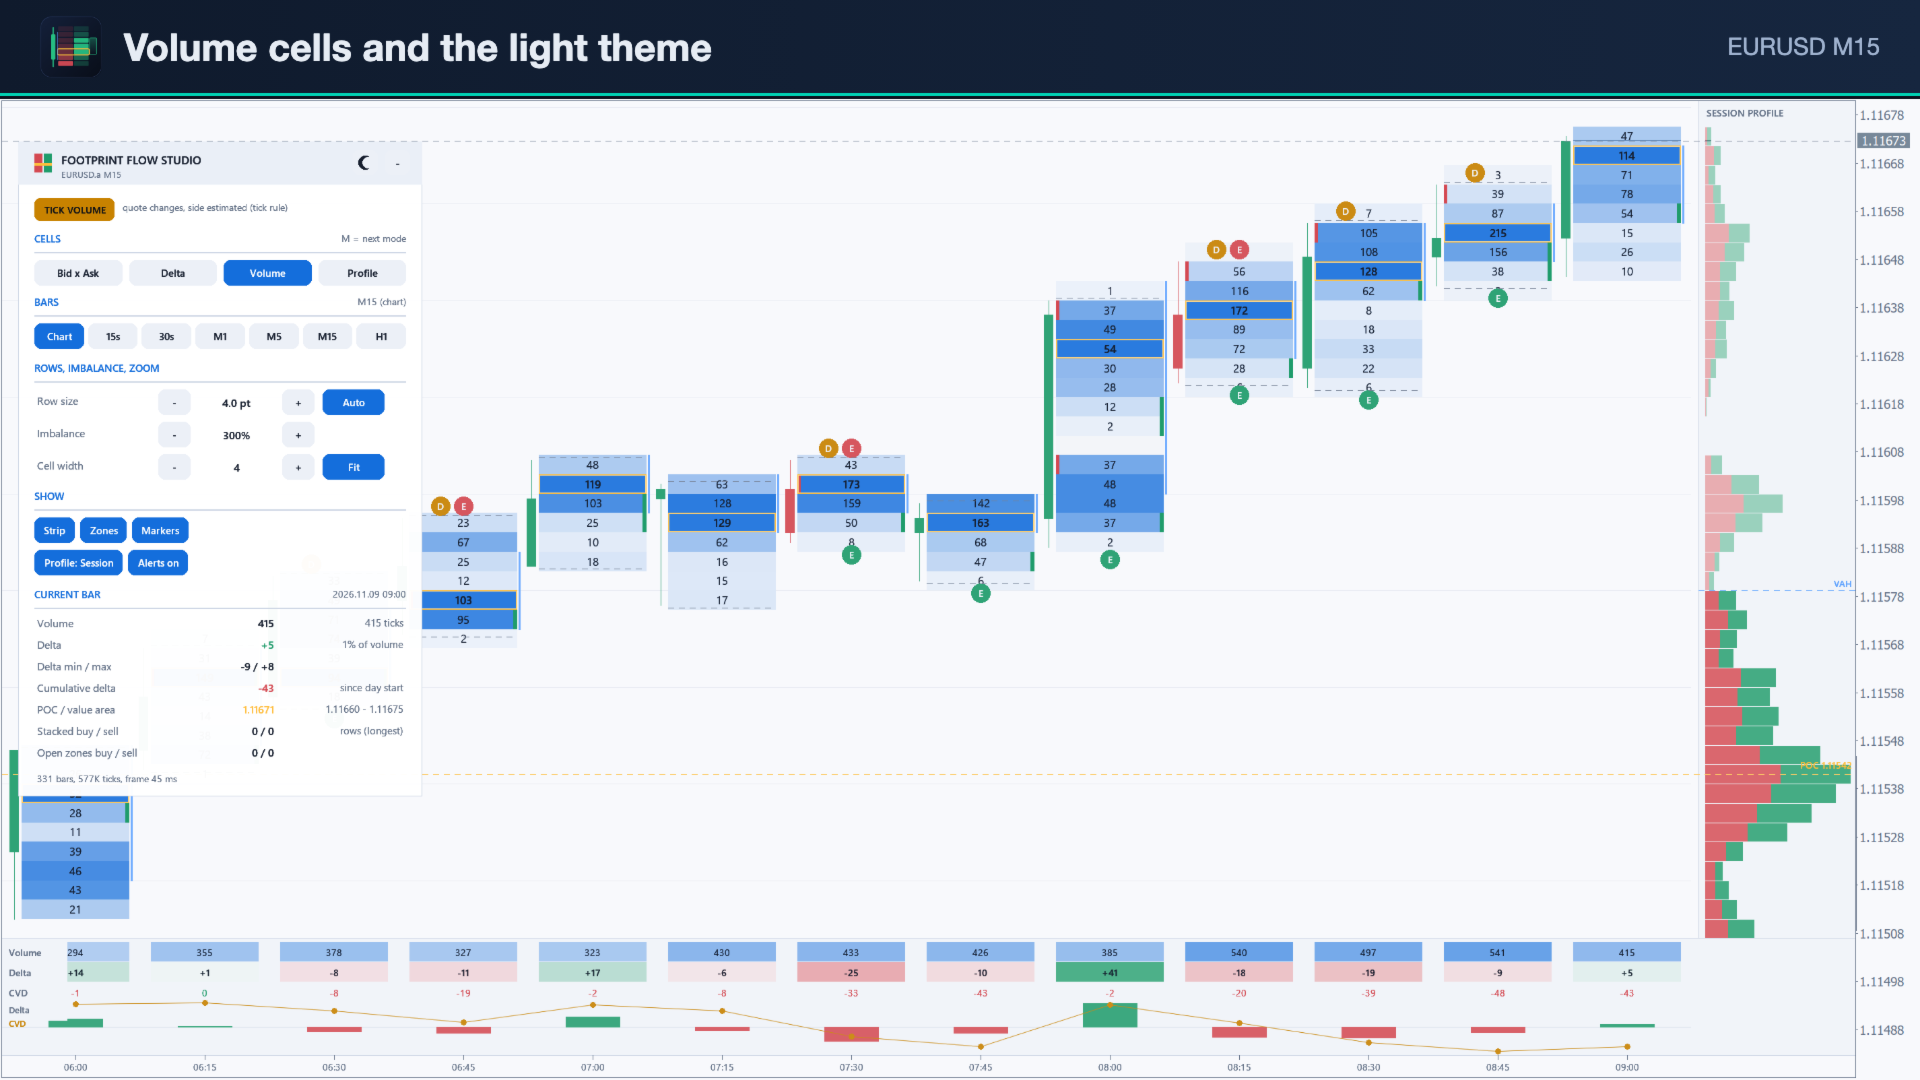
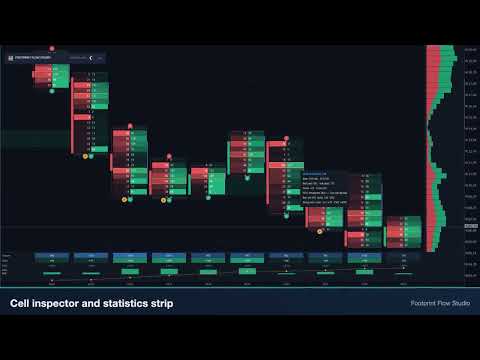
  • Four cell modes, one click each (or key M): Bid x Ask (sell volume left, buy volume right), Delta per row, Volume per row, and Profile (a horizontal bid/ask histogram inside every bar).
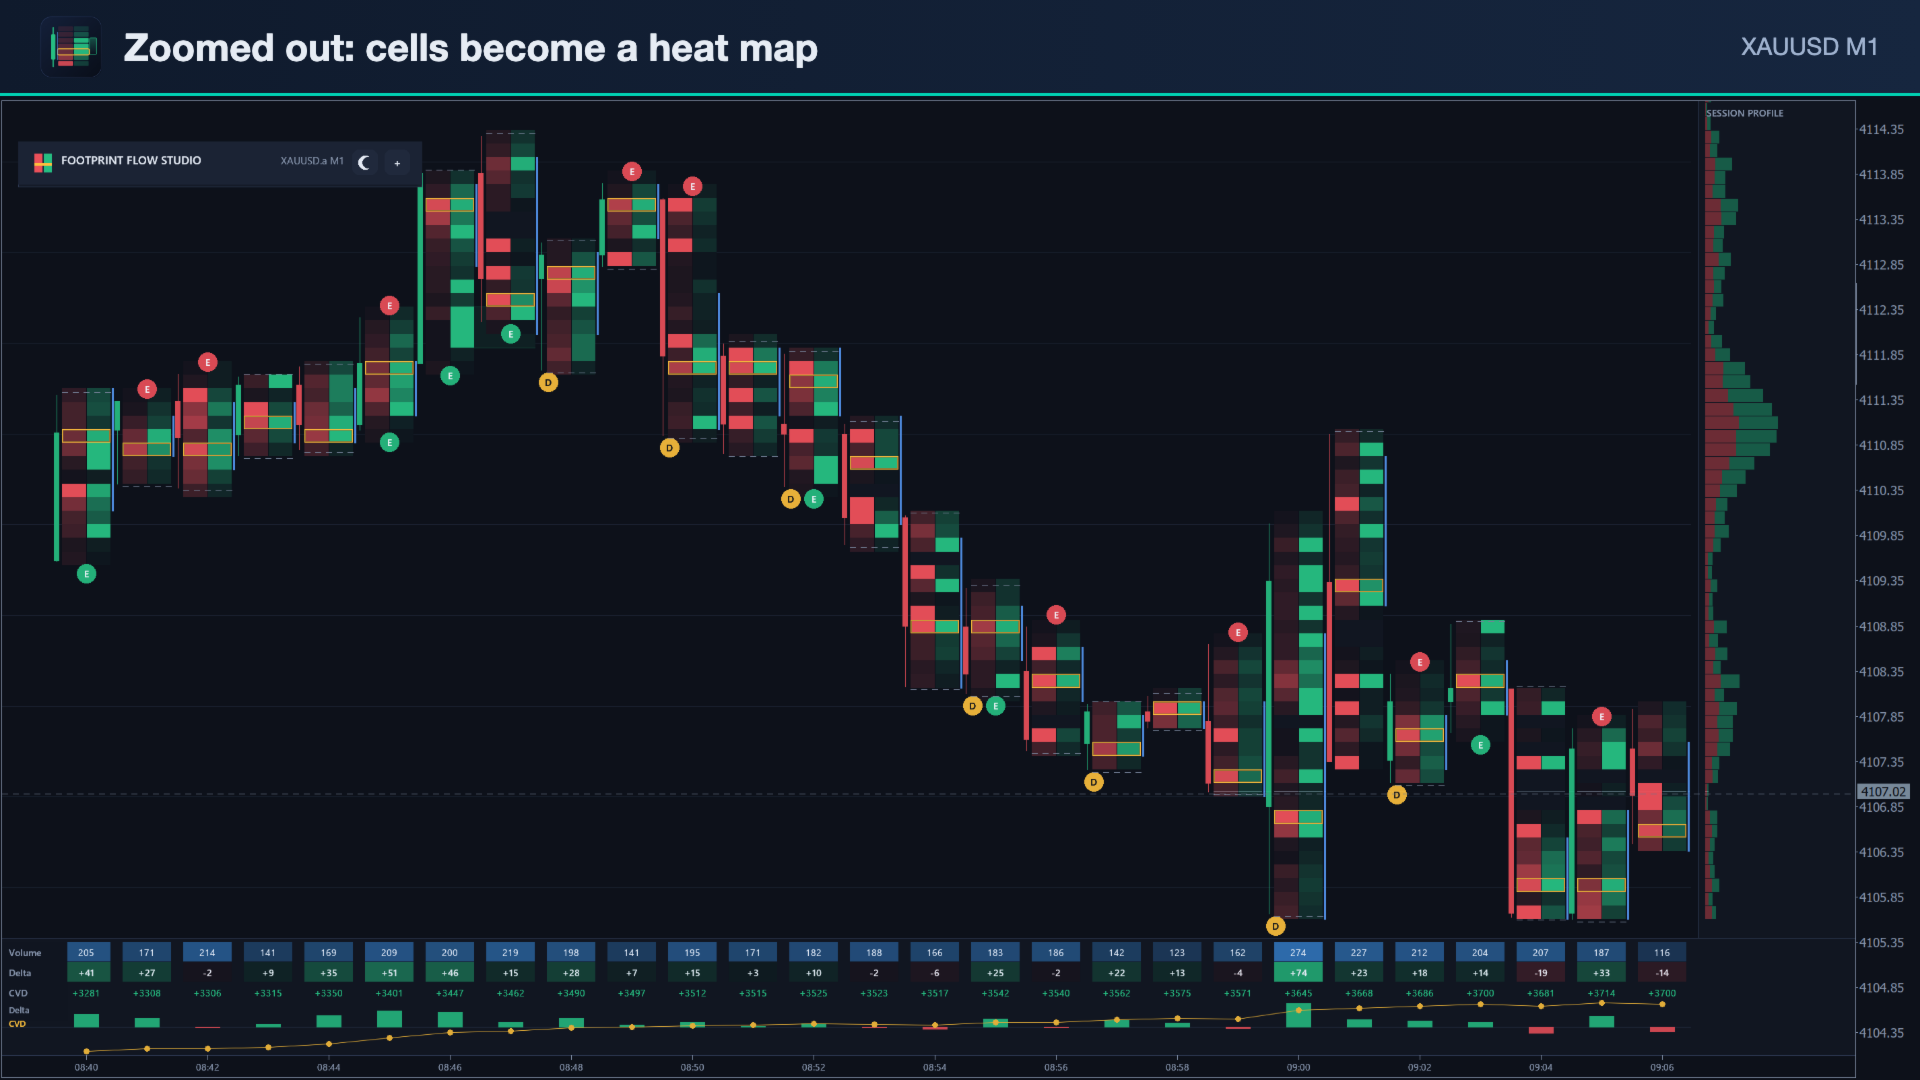
  • Cells are shaded by size, so the heavy rows stand out even when you zoom far out and the numbers are hidden.
  • A slim candle next to every footprint column shows open, high, low and close.
  • POC (the row with the most volume) is outlined in every bar. A bracket marks the bar's value area (70 % by default).
  • Cell inspector: move the mouse over any cell to see the exact bid, ask, delta and total. It also shows any imbalance, and the bar's volume, delta, delta min/max and cumulative delta.

Imbalances and zones

  • Diagonal imbalances: the ask of a row is compared with the bid one row lower, and the bid with the ask one row higher. The ratio can be set (300 % by default) and changed live on the panel.
  • Stacked imbalances (3 or more rows in a row by default) become zones. A zone is extended to the right until price trades back into it. Open zones and tested zones look different.
  • A minimum cell volume keeps thin rows from giving false imbalances.

Bar events

  • A: absorption. Heavy selling at the low with a close in the upper half, or heavy buying at the high with a close in the lower half.
  • E: exhaustion, where the extreme row traded far less than the bar's average row.
  • D: delta divergence. A higher high with negative delta, or a lower low with positive delta.
  • Unfinished auction: both sides traded at the bar's extreme. It is shown as a dotted line.

Delta strip, profile and time axis

  • Statistics strip under the bars: volume, delta and cumulative delta per bar, with a delta histogram and a cumulative delta line. Cumulative delta resets each trading day or runs continuously.
  • Right-side profile of the current session or of the visible bars, with POC, VAH and VAL lines across the chart.
  • Own time axis with date changes, because footprint bars can differ from the chart bars.

Bars from ticks: seconds to H4

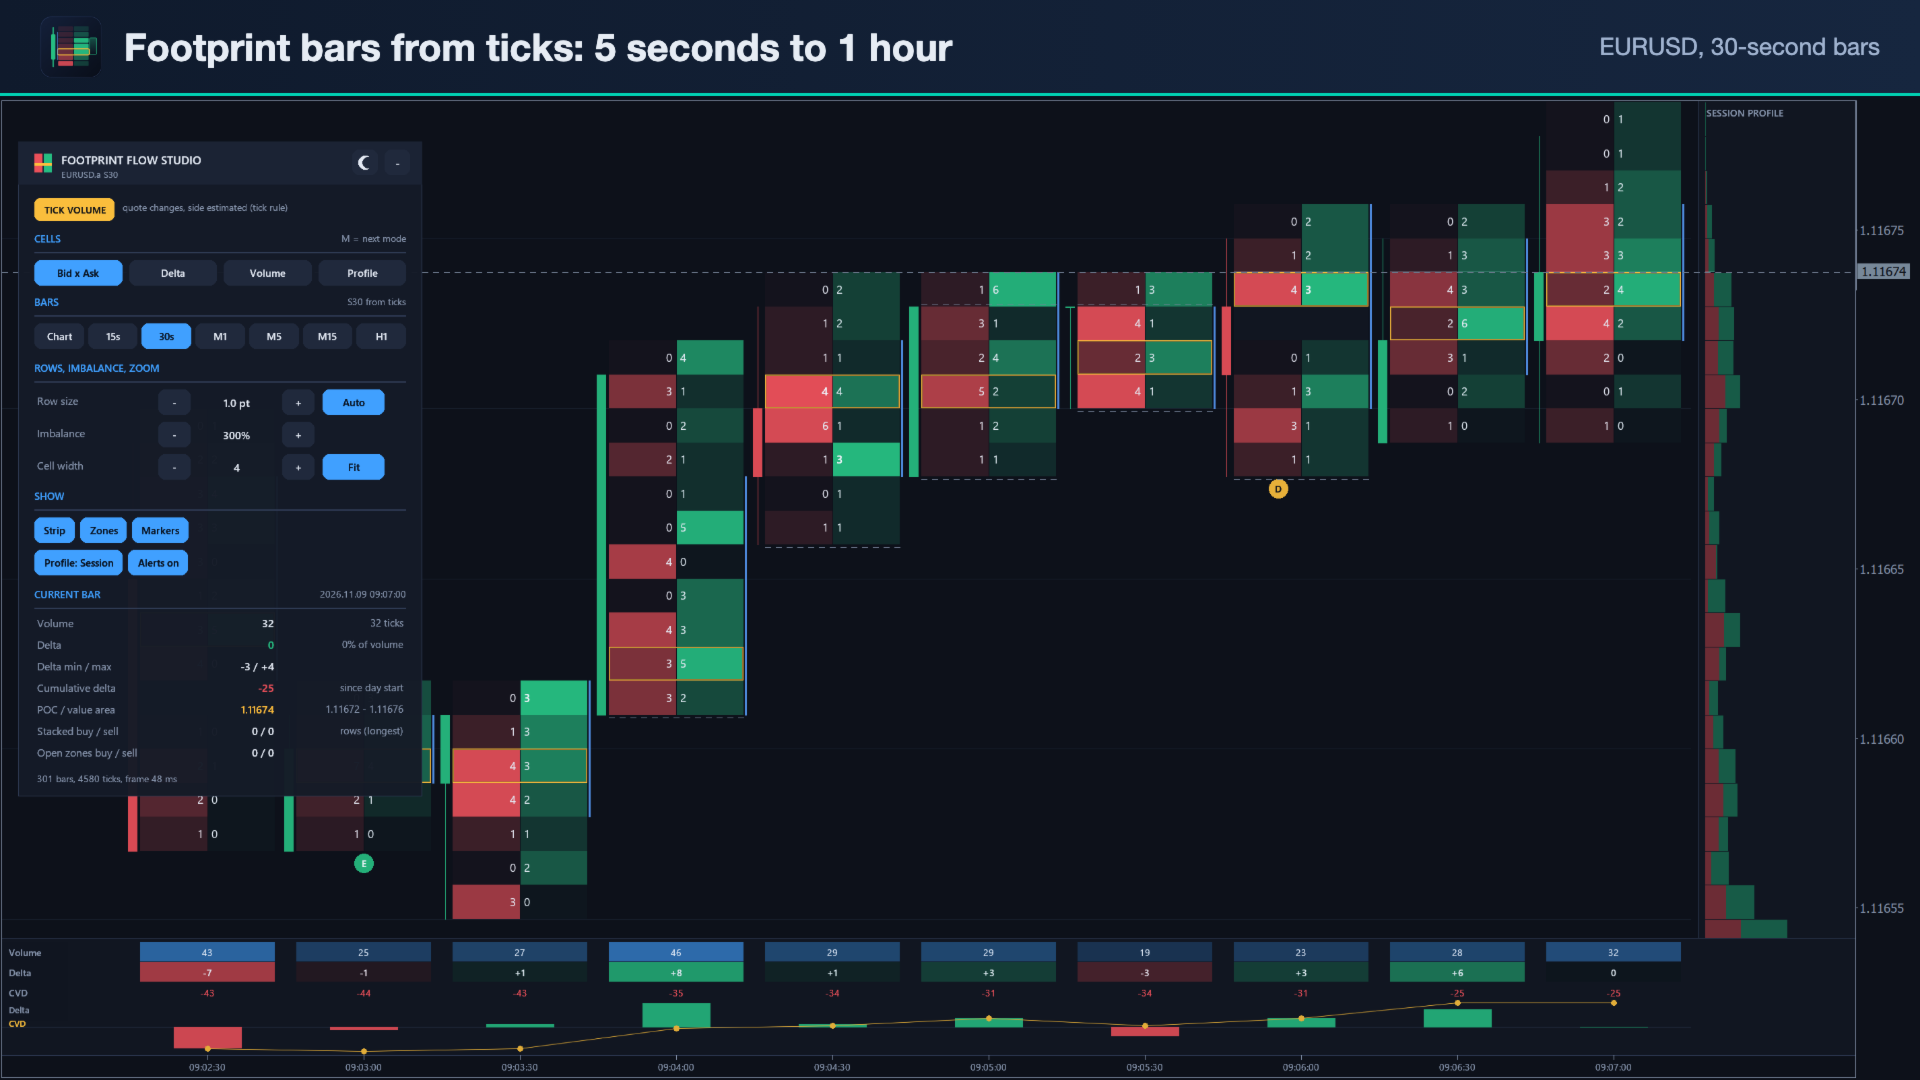
  • Footprint bars can follow the chart timeframe (M1 to H4), or be built from ticks at 5, 10, 15 or 30 seconds, or at 1, 2, 3, 5, 10, 15, 30 minutes or 1 hour, on any chart.
  • Row size is set automatically from the average bar range, so forex, gold, indices and crypto work without tuning. It can also be set in points. Rows are grouped further when you zoom out, so the numbers stay readable. You can also choose the number of rows per cell with the panel's +/− buttons.
  • Bar analysis (stacks, zones, events, alerts and buffers) uses fixed analysis rows, so signals do not change when you zoom.

Navigation that feels like a normal chart

  • Scroll the chart as usual (drag, arrow keys, Home/End) and the footprint follows.
  • The normal chart zoom (+/−, mouse wheel) sets the cell width.
  • Auto-fit keeps the price scale fitted to the visible bars (key F or the Fit button). Switch it off to zoom the price scale freely.
  • The indicator hides the normal candles, grid and date scale while it is attached. Your chart settings come back when you remove it.

Fast and light

  • One canvas draws only the visible bars. Ticks are processed once and then updated incrementally. History loads in small steps in the background, so the terminal stays responsive.
  • Footprint cache on disk: when you reopen the chart or switch back to a timeframe, the footprint is read from the cache and only the new ticks are loaded.
  • Old bars release their rows to keep memory low.

Alerts and EA access

  • Alerts on bar close: stacked imbalance, delta divergence and absorption, as a pop-up, push notification or e-mail.
  • 8 indicator buffers for EAs: bar delta, cumulative delta, bar volume, POC, VAH, VAL, stacked imbalance (+rows buy / −rows sell) and bar event (±1 absorption, ±2 delta divergence, ±3 exhaustion). The buffers are filled when the footprint period equals the chart period.

Panel

  • Cell mode, bar period, row size, imbalance ratio, cell width and auto-fit are all on one panel, with switches for strip, zones, markers, profile and alerts.
  • It also shows statistics for the current bar: volume, delta, delta %, delta min/max, cumulative delta, POC and value area, stacks and open zones.
  • The panel is movable and can be minimised. It has dark and light themes and scales with the screen DPI (tested at 100 % and 200 %).

How it differs from our Volume Profile OrderFlow Suite

The Suite is a level tool: periodic, composite and fixed-range profiles, naked POCs, VWAP and anchored VWAP, and level statistics, with a compact footprint of the latest bars. Footprint Flow Studio is the dedicated footprint workspace: every bar on screen is a full footprint, with bars from seconds to H4, imbalance zones, bar events and a statistics strip. It has no VWAP, periodic profiles or level statistics. The two tools complement each other.

Requirements and notes

  • MetaTrader 5, any symbol. Tick history comes from your broker. The default load is 300 bars, at most 10 days.
  • The footprint quality depends on your broker's tick data. On forex and CFDs it shows tick activity with an estimated side, as explained above.
  • Strategy Tester: works in visual mode, so you can try the free demo. Use "Every tick based on real ticks" for footprints like the live chart. In the generated-tick modes, the footprint is built from the tester's ticks.
  • This is an analysis tool. It does not trade and does not predict prices. Trading involves risk.
Recommended products
AstraQuant Smart Liquidity AI AstraQuant Smart Liquidity AI is a professional MetaTrader 5 indicator designed for traders who want a cleaner and more structured way to understand market behavior. Instead of depending on simple arrows or basic crossover systems, the indicator focuses on liquidity sweeps, momentum behavior, volatility conditions, and multi-timeframe alignment to help traders read the market with better clarity. Many traders struggle because charts become overloaded with indicators
TradeAQ
Guo Sheng Zhao
LuoMo Volume & Price Structure 8.98 A multi-function chart indicator for   MetaTrader 4 and MetaTrader 5 , designed to display key volume, volatility, sentiment, and price-structure information directly on the main chart. Main Features Volume and price-based Support & Resistance Volume spike and exhaustion signals ATR volatility expansion alerts Volume Profile with HVN and LVN Bullish and bearish sentiment distribution Developing or fixed POC VAH and VAL levels Supply and Demand zones Volume-wei
HiLo Activator Plus
Rodrigo Galeote
5 (1)
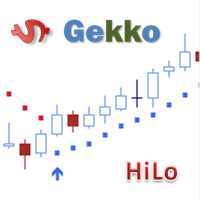
HiLo Activator is one of the most used indicators to determine trend. Find it here with the ability to customize period and colors. This indicator also plots up and down arrows when there is a change on the trend, indicating very strong entry and exit points. HiLo fits well to different types of periods for day trading. You can easily understand when it is time to buy or sell. It works pretty good also for other periods like daily and monthly signalizing long-term trends. The use of the indicato
Fractals
Mikhail Nazarenko
The Fractals indicator displays on the chart only fractals with the specified parameters in the indicator settings. This allows you to more accurately record a trend reversal, excluding false reversals. According to the classical definition of a fractal, it is a candlestick - an extremum on the chart, which was not crossed by the price of 2 candles before and 2 candles after the appearance of a fractal candle. This indicator provides the ability to adjust the number of candles before and after t
WAPV Weis Wave Chart MT5
Eduardo Da Costa Custodio Santos
The Weis Wave Chart for MT5 is a Price and Volume indicator. The Price and Volume reading was widely disseminated through Richard Demille Wyckoff based on the three laws created by him: Supply and Demand, Cause and Effect and Effort vs. Result. In 1900 R.Wyckoff already used the wave chart in his analyses. Many years later, around 1990, David Weis Automated R. Wyckoff's wave chart and today we bring you the evolution of David Weis' wave chart. It shows the amount of Volume and the amount of pips
Senkou Span B Dynamic Rejection and Multi-Filter Confluence Framework for MetaTrader 5 Overview The Senkou Span B Dynamic Rejection Indicator is a modular technical analysis system designed for the MetaTrader 5 platform. It identifies institutional price interactions around the Senkou Span B equilibrium line of the Ichimoku Kinko Hyo model. Senkou Span B represents the 52-period midpoint value projected into the market structure, serving as a primary indicator of medium-to-long term support, r
Indicador de Força da Moeda para MetaTrader 5 Este indicador analisa a força relativa das principais moedas forex, fornecendo uma representação visual clara de quais moedas estão ganhando ou perdendo força em comparação com outras. Ele avalia os principais pares de moedas (EUR, USD, GBP, JPY, AUD, NZD, CAD, CHF) e calcula a força usando métodos como RSI ou ROC, dependendo da configuração selecionada. Os resultados são exibidos como linhas separadas para cada moeda, facilitando a identificação de
Renko Plus
Eadvisors Software Inc.
With Renko Plus you can use the features in the Indicator functionality, just add it to the Metatrader5 chart.             The Renko chart is a type of chart, developed by the Japanese, that is constructed using price movement rather than standardized prices and time intervals like most charts. It is believed to be named after the Japanese word for bricks, "renga", as the graphic looks like a series of bricks.             A new brick is created when the price moves a specified pri
TriConfluence Pro
Gabriel Balbino De Oliveira
TriConfluence Pro: The End of False Breakouts and Blind Speculation Tired of losing money to fake signals, lagging indicators, and choppy sideways markets? Most traders fail because they trade market noise instead of true price structure. TriConfluence Pro is built upon a rigorous triple-confluence methodology. It eliminates guesswork by combining three of the market's most powerful and respected tools— Bollinger Bands, RSI, and ADX —into a smart, automated dashboard right on your MetaTrader cha
Catch the Spikes. Trade the Ticks. Master the Market. Welcome to ATHENA (Crash & PainX Edition) by DC Trading — the ultimate MetaTrader 5 technical analysis indicator built specifically for synthetic index traders targeting Crash and PainX markets. Whether you specialize in catching high-probability downward spikes or executing disciplined tick scalping strategies on the M1 timeframe, Athena gives you clear, real-time visual confirmation to trade with maximum confidence. WHY TRADERS CHOOSE AT
ZigZag Market Structure Breakout Pro ZigZag Extras Display BreakOut points is a MetaTrader 5 indicator for traders who use ZigZag, breakout points, market structure, BOS, CHoCH, swing high, swing low, support and resistance, and higher timeframe bias in their trading analysis. Main Benefits Displays confirmed ZigZag swing highs and swing lows Marks BOS Up, BOS Down, CHoCH Up and CHoCH Down Shows Depth Highest High and Depth Lowest Low lines Adds HH, HL, LH and LL structure labels Includes HTF bi
True Weis Wave
Atila Goncalves Firmino
A version based on David Waves' description in his book 'Trade About to Happen' of his adaptation of the Wyckoff wave chart. The indicator directionally accumulates volume, adding to each brick or candle close, with color indication for up and down. it can be used it with tick or real volume, it also changes color when the accumulated value of the previous wave is exceeded, being the trade signal. Yellow color is used for doji candlestick, it will continue with accumulation without zero the sum
IC Flat Pro The True Math
Aruncharan Ganapathy Sivakumar
IC FLAT PRO – THE TRUE MATH   Early Adopter Pricing Secure IC FLAT PRO – THE TRUE MATH at the current launch price. Once the first 10 purchases  have been sold, the price will increase by USD 300 . Institutional-Grade Market Structure Analysis for MetaTrader 5 IC FLAT PRO – THE TRUE MATH is a premium institutional-grade market structure indicator developed for serious traders who demand precision, consistency, and high-quality trade opportunities. Built using advanced mathematical algorithms
One of the most famous phrases in the trading world is "The Trend Is Your Friend". Trading following the current trend is one of the most successful ways in terms of probability. The hard part of it is to recognize when the market is trending or not. that's the role of our indicator we called The Trend Is Your Friend Until It Is Not. Apart from its big name it is really easy to use and see when the market is trending or ranging. Through a little window of 3 colors you will identify if the mark
DoctorEdge V-LINE (Pump it & Dump it) Strategy Pro Confirms trend direction using smart momentum logic and key price behavior How It Works DoctorEdge V-LINE is a smart visual indicator designed to detect trend impulses and confirm their strength based on how price reacts around certain dynamic zones. Buy Trend: When price reaches level -20 , the line turns green , signaling a potential buy . If price breaks above level 0 and the line stays green, the uptrend is confirmed . If price doe
Gm Vwap Point
Antonio Augusto Barreto De Melo
VWAP is an intraday calculation used primarily by algorithms and institutional traders to assess where a stock is trading in relation to its weighted average volume for the day. Day traders also use VWAP to assess market direction and filter out trading signals. This indicator is used to analyze and calculate the Vwap from a certain point on the graph, which is widely used to analyze the beginning of a movement of the price relationship with the volume. - Multi Vwaps on the same chart, placed
ICT Order Blocks Premium Indicator Professional Market Structure Analysis Based on ICT Methodology OrderBlocks ICT   is an advanced technical analysis tool that identifies high-probability trading zones based on the Inner Circle Trader (ICT) methodology. This professional-grade indicator detects key market turning points using institutional order block analysis, revealing where smart money is likely accumulating positions. Key Features: Smart Filtering Technology : Eliminates weak and insignific
VWAP Suite Pro
Ahmed Hamed Hamed Eadwan
5 (1)
Most VWAP indicators give you a single line that resets at midnight. That works well enough on simple setups, but falls apart the moment you want to compare how price is behaving relative to the London open versus the New York open, or when you want to anchor a VWAP to a specific swing high from three weeks ago and keep it on screen while also watching the daily and weekly levels at the same time. I kept adding separate indicators to solve each of these needs until I had five VWAP tools on the s
Gods Eye
Oamogetswe Semelo
God’s Eye God’s Eye is a chart-based market-structure and range-planning indicator for MetaTrader 5. It combines daily volatility context with price structure on the active chart timeframe. It is designed to support discretionary analysis and provide data buffers for Expert Advisors; it does not place trades or guarantee trade outcomes. Daily Range Dashboard God’s Eye calculates an average daily high-low range from completed D1 bars and compares it with price movement from the current daily ope
Support Resistance Zone Master is a display-only support and resistance indicator for MetaTrader 5. It detects price zones from historical highs and lows on a selectable timeframe, then plots them directly on the chart so you can see where the market has reacted before. The indicator shows two types of levels: Current Support / Resistance — the single nearest support level below price and the single nearest resistance level above price, drawn as solid horizontal lines. Multiple levels (R1–R6 / S
Zic Zac De Midas
Job Israel Vargas Sarabia
ZIC ZAC DE MIDAS — Asesor Experto para Índices Americanos ZIC ZAC DE MIDAS es un sistema de trading automatizado diseñado específicamente para operar en índices americanos (US500, US30, US100 y similares), combinando una lógica de reingreso escalonado con múltiples capas de gestión de riesgo para proteger el capital en escenarios adversos. El robot viene preconfigurado con un set optimizado para SP500 enfocado en operaciones de bajo capital ($1,000) y drawdown controlado (~80%), listo para
Fractum Quantizz Trader foi projetado e desenvolvido para aproveitar pullbacks dentro de tendências definidas, usando a volatilidade adaptativa para encontrar o ponto de retorno ideal, confirmado por fractal e força direcional. Pode-se usar range ou Fractal para posicionamento de ordens. Ativo recomendado: Miniíndice WIN. Timeframe recomendado: M5. OBS: Alterar parâmetro BR1 para BR.
Delta Msnr Flex
Dely Ange Alex Dely
DELTA MSNR FLEX Intelligent MSNR Structure Analysis & Key Level Detection — MetaTrader 5 DELTA MSNR FLEX is a professional indicator designed to analyze price structure and identify important MSNR levels directly on the MetaTrader 5 chart. Its objective is simple: transform significant market reactions into clearly identifiable levels, helping traders improve their market analysis and decision-making process. AUTOMATIC & MANUAL DETECTION DELTA MSNR FLEX provides a flexible approach to market
The Adaptative Moving Average Zeiierman is a technical analysis tool designed to identify trading opportunities through adaptive trend analysis. This Metatrader adaptation of Zeiierman's original TradingView indicator which combines several analytical methods to provide visual market assessments. Technical Features Utilizes an adaptive smoothing algorithm based on market volatility Calculates an Efficiency Ratio (ER) to adjust sensitivity dynamically Incorporates Sigma bands for volatility meas
CRT Candle Range Theory HTF MT5 - Ultimate CRT Indicator: Advanced ICT Concepts and Malaysian SnR Trading System Master the Market Maker's Footprints with the Most Advanced Candle Range Theory Indicator. Unlock the true power of Smart Money Concepts (SMC) and trade precisely like the institutions with the Ultimate CRT Indicator. Built exclusively for serious traders, this indicator automates the highly effective Candle Range Theory (CRT), a core pillar of ICT Concepts (Inner Circle Trader), and
Weis Wave Scouter
Jean Carlos Martins Roso
Discover the power of advanced volume analysis with Weis Wave Scouter, a revolutionary indicator for MetaTrader 5 that combines the proven principles of the Wyckoff method and Volume Spread Analysis (VSA). Designed for traders seeking precision and depth in their operations, this indicator offers a tactical reading of the market through cumulative volume wave analysis, helping to identify key points of trend reversals and continuations. Weis Wave Scouter features a clear visual interface with co
Caicai L&S Yield Histogram Important Notice: This indicator is an integral tool of the automated EA Caicai Long and Short Pair Trading . This indicator visually displays the percentage deviation (Yield %) of a pair's current spread relative to its own historical mean. It is an excellent tool for quickly visualizing the gross financial potential of a market distortion in Long & Short operations. Main Features: Percentage Visualization: Understand the size of the distortion in palpable percentage
This indicator builds upon the previously posted Nadaraya-Watson smoothers. Here we have created an envelope indicator based on Kernel Smoothing with integrated alerts from crosses between the price and envelope extremities. Unlike the Nadaraya-Watson estimator, this indicator follows a contrarian methodology. Please note that by default this indicator can be subject to repainting. Users can use a non-repainting smoothing method available from the settings. The triangle labels are designed so
Btc Guppy
Fritz Roland Barnard
BTC Guppy — Special Launch Price: $57 Limited introductory offer — first 10 purchases only! Once the first 10 copies have been sold, the price will increase to $99. BTC Guppy BTC Guppy is an automated trading system developed for MetaTrader 5, designed to identify potential trend reversals and continuation opportunities in the Bitcoin market. The EA is built around the Guppy Multiple Moving Average (GMMA) methodology, developed by Australian trader and technical analyst Daryl Guppy . THE IDE
HAS RSI Signal — Professional Trend Indicator with SL/TP Calculation HAS RSI Signal is a powerful trading tool that combines time-tested classics with modern noise-filtering algorithms. The indicator analyzes the market through the prism of Heiken Ashi Smoothed candles and the RSI oscillator, providing clear entry signals at trend reversals or when exiting overbought/oversold zones. Key Advantages: Double Filtration: Using Heiken Ashi Smoothed eliminates market "noise," while RSI confirms the mo
Buyers of this product also purchase
Entry Points Pro shows you where to enter, where to put the stop and what lot to trade — before you place the order. PRICE Now 149 USD, and this is the last copy at this price. After it the price goes up to 199 USD, and the final price is 349 USD. I make my money trading the markets, and I show it, so I don't need to sell this indicator to everyone. It is a tool for traders who think for themselves, not a magic button. The arrow appears when the candle closes and does not repaint. Two setting
Gann Made Easy   is a professional and easy to use Forex trading system which is based on the best principles of trading using the theory of W.D. Gann. The indicator provides accurate BUY and SELL signals including Stop Loss and Take Profit levels. You can trade even on the go using PUSH notifications. PLEASE CONTACT ME AFTER PURCHASE TO GET TRADING  INSTRUCTIONS   AND GREAT EXTRA INDICATORS  FOR FREE! Probably you already heard about the Gann trading methods before. Usually the Gann theory is a
Ultra Indicator
Ihor Otkydach
5 (1)
ULTRA is a technical indicator that operates on an “all-in-one” basis—it independently analyzes the market, generates trading signals, displays levels for setting stop-loss orders, and suggests when to close trades to lock in profits or minimize losses. In other words, it doesn't matter if you don't know how to analyze the market, determine levels—where to set your stop-loss—or struggle with money management. ULTRA will do all of that for you! BUYER BONUS: After purchasing the ULTRA indicator, s
Boba Analysis Suite
Trade Ready Solutions LLC
5 (2)
Boba Analysis Suite Boba Analysis Suite is an analytical indicator for MetaTrader 5. It brings market structure, relevant price zones and broader market context together in a single chart view. Developed through practical experience as a trader and trading coach, it supports a structured analysis process: assessing market direction, identifying important levels and considering multiple timeframes together. Analysis in Context Individual signals gain meaning through context. Boba Analysis Suite h
M1 Sniper MT5
Oleg Rodin
5 (7)
M1 SNIPER  is an easy to use trading indicator system. It is an arrow indicator which is designed for M1 time frame. The indicator can be used as a standalone system for scalping on M1 time frame and it can be used as a part of your existing trading system. Though this trading system was designed specifically for short-term trading, it still can be helpful for all traders. This trading system can be used with any forex pair and time frame, though lower time frames are recommended from M1 up to M
Auto Optimized SpeedAngle is an institutional-grade momentum vectoring system that eliminates curve-fitting through continuous Walk-Forward Optimization (WFO). Rather than relying on static inputs that degrade when market regimes shift, the indicator dynamically recalibrates its parameters using Out-of-Sample (OOS) validation, ensuring the displayed signals represent genuine statistical edges rather than historical anomalies. By shifting the focus from subjective visual angles to normalized, qua
Adaptive Price Action Engine Buy Indicator- Get EA Based on it for FREE. Self-Optimizing Multi-Timeframe Trend & Candlestick Intelligence Markets do not behave the same way all the time—and not every price-action pattern has the same value in every market regime. Adaptive Price Action Engine is designed to adapt to changing market conditions by combining trend structure, multi-timeframe analysis, candlestick patterns, and statistical optimization into one analytical framework. Two Adaptive Mode
Scalper Vault is a powerful, fully-equipped trading system designed for traders who want to achieve consistency in intraday trading . This high-precision indicator serves as a complete, standalone trading system that delivers institutional-grade analysis for both Forex and Binary Options traders. PLEASE CONTACT ME AFTER PURCHASE TO GET MY TRADING TIPS PLUS A GREAT BONUS! By eliminating the guesswork and complex manual analysis, Scalper Vault allows you to focus purely on execution using easy to
SIO Oscillator: Self-Optimizing Semivariance Imbalance Oscillator Buy the indicator and get the Expert Advisor based on it for FREE. Most oscillators treat all price movement the same. SIO separates upside and downside market pressure and measures the imbalance between them, showing which side is really in control: buyers or sellers. When the imbalance reaches an extreme, SIO prints a clear signal with entry, Stop Loss and Take Profit levels. What makes SIO different is that it doesn’t rely on f
Volatility Master for MetaTrader is a real-time dashboard tool that scans up to  50 symbols  to identify high-volatility , trending markets instantly. With bullish/bearish signals, customizable alerts, and a user-friendly interface, it helps you avoid range-bound conditions and focus on high-probability trades. Clarity leads to confidence. Trade confidently and protect your capital effectively with this powerful dashboard. We don't offer free or bonus indicators in exchange of reviews from you.
Multi Currency Strength and Momentum Indicator MT5 Dynamic Forex28 Navigator is the evolution of our long-time, popular indicators, combining the power of three into one: Advanced Currency Strength28 Indicator (700 reviews) Advanced Currency IMPULSE with ALERT (530 reviews) CS28 Combo Signals (recent Bonus) The two predecessor indicators together have received more than 1,200 reviews on the MQL5 Market and have been a staple in the MT4 community since 2016. Dynamic Forex28 Navigator MT5 carries
AriFocus
Temirlan Kdyrkhan
AriFocus - Non-Repainting Buy/Sell Signals AriFocus - one clear signal. AriFocus marks buy and sell signals directly on the chart and suggests a stop-loss level for each one. Every signal is confirmed on bar close and never repaints. - Buy/sell arrows, confirmed on bar close - Suggested stop-loss level for every signal - Trend band and candle coloring to show direction at a glance - 10 ready-made presets, or your own settings (14 calculation methods) - Pop-up, push and email alerts with entr
Neuro Poseidon MT5
Daria Rezueva
4.68 (53)
Neuro Poseidon is a new indicator by Daria Rezueva. It combines precise trading signals with adaptive TP/SL levels - creating best possible trades as a result! Message me and get  Neuro Poseidon Assistant  as a gift to automize your trading process! What makes it stand out? 1. Proven profitability on all assets and timeframes 2. Only confirmed BUY and SELL signals present on the chart 3. Adaptive TP & SL levels generated by the software for each trade 4. Easy to understand - suitable for al
PZ Swing Trading MT5
PZ TRADING SLU
5 (5)
Protect against whipsaws: revolutionize your swing trading approach Swing Trading is the first indicator designed to detect swings in the direction of the trend and possible reversal swings. It uses the baseline swing trading approach, widely described in trading literature. The indicator studies several price and time vectors to track the aggregate trend direction and detects situations in which the market is oversold or overbought and ready to correct. [ Installation Guide | Update Guide | Tro
Azimuth Pro
Ottaviano De Cicco
5 (7)
Azimuth Pro V2: Synthetic Fractal Structure and Confirmed Entries for MT5 Overview Azimuth Pro is a multi-level swing structure indicator by Merkava Labs . Four nested swing layers, swing-anchored VWAP, ABC pattern detection, three-timeframe structural filtering, and closed-bar confirmed entries — one chart, one workflow from micro-swings to macro-cycles. This is not a blind signal product. It is a structure-first workflow for traders who care about location, context, and timing. Halloween P
SkyHammer Signal Pro Professional No-Repaint Trend Signal Indicator with Locked Entry, SL and TP Levels SkyHammer Signal Pro is a structured trend and momentum signal indicator designed for traders who want clear, fixed, and verifiable trading signals. It works best on lower timeframes such as M1 and M5 . The indicator does not try to predict tops or bottoms. Instead, it waits for confirmed market structure, trend direction, momentum strength, volatility quality, and target space before generati
Advance AI Scanner
Mohamed Samsudeen
5 (1)
Advance AI Scanner is a multi-symbol analysis indicator for MetaTrader 5. It scans Forex pairs, metals, energy, stock indices and cryptocurrencies at the same time and rates each instrument with its own self-training model. It explains in plain English what moved each market and why, and it estimates how far upcoming economic news usually moves each symbol, measured on your broker's own price history. $199 instead of $499. 10 copies left at this price. One time purchase  Installation and User
Bill Williams Advanced
Siarhei Vashchylka
5 (11)
Bill Williams Advanced is designed for automatic chart analysis using Bill Williams' "Profitunity" system. The indicator analyzes four timeframes at once. Manual (Be sure to read before purchasing) Advantages 1. Analyzes the chart using Bill Williams' "Profitunity" system. Signals are displayed in a table in the corner of the screen and on the price chart. 2. Finds all known AO and AC signals, as well as zone signals. Equipped with a trend filter based on the Alligator. 3. Finds "Divergence Bar
Apex Patterns PRO Buy Indicator - Get Expert Advisor Based on it for FREE. Self-Optimizing Chart Pattern & Breakout Intelligence Traditional pattern scanners rely on fixed inputs, often underperforming when market volatility and structures shift. Apex Patterns PRO is designed to adapt to changing market conditions by combining structural chart pattern recognition, momentum filtering, and statistical self-optimization into one analytical framework. Adaptive Scanning Engine Self-Optimizing Patter
Apollo SR Master is a Support/Resistance indicator with special features which make trading with Support/Resistance zones easier and more reliable. The indicator calculates Support/Resistance zones in real-time without any time lag by detecting local price tops and bottoms. Then to confirm the newly formed SR area, the indicator shows special signal which signalizes that the SR zone can be taken into consideration and used as an actual SELL or BUY signal. In this case the strength of the SR zone
Divergence Bomber
Ihor Otkydach
4.89 (94)
Each buyer of this indicator also receives the following for free: The custom utility "Bomber Utility", which automatically manages every trade, sets Stop Loss and Take Profit levels, and closes trades according to the rules of this strategy Set files for configuring the indicator for various assets Set files for configuring Bomber Utility in the following modes: "Minimum Risk", "Balanced Risk", and "Wait-and-See Strategy" A step-by-step video manual to help you quickly install, configure, and
Superhero
Ihor Otkydach
5 (3)
The SUPERHERO indicator is a multi-currency trading system designed on an "all-inclusive" basis. The indicator independently analyzes the market and provides signals on when to open and close trades. It uses Stop Loss and Take Profit orders. The R:R ratio is 1:1. This system can send push notifications to your smartphone, so you can place trades "on the go" without needing to be tied to a PC. It's perfect for proprietary trading firms. A BONUS FOR EVERY CUSTOMER: Every buyer of this indicator wi
Trend Lines PRO MT5
Roman Podpora
5 (1)
TREND LINES PRO    helps understand where the market is truly changing direction. The indicator shows real trend reversals and points where major players re-enter. You see   BOS lines   Trend changes and key levels on higher timeframes — without complex settings or unnecessary noise. Signals don't repaint and remain on the chart after the bar closes. VERSION MT 4     -     Reveals its maximum potential when paired with the   RFI LEVELS PRO  indicator What the indicator shows: Real shifts   tren
FootPrint Chart MT5
Gayathiri Gopalakrishnan
5 (1)
Turn every candle into a bid x ask footprint built from real tick data. See who is actually trading at each price, with delta, volume profile, imbalance zones and a scored setup engine that prints entry, stop and target Order Flow Footprint Chart Pro Most indicators tell you what price did. This one tells you who did it. Order Flow Footprint Chart Pro rebuilds every candle on your chart from raw tick data and shows you the volume that traded at each individual price inside it, split into the am
Quantum TrendPulse
Bogdan Ion Puscasu
5 (26)
Introducing Quantum TrendPulse , the ultimate trading tool that combines the power of SuperTrend , RSI , and Stochastic into one comprehensive indicator to maximize your trading potential. Designed for traders who seek precision and efficiency, this indicator helps you identify market trends, momentum shifts, and optimal entry and exit points with confidence. Key Features: SuperTrend Integration: Easily follow the prevailing market trend and ride the wave of profitability. RSI Precision: Detect
Advanced Supply Demand MT5
Bernhard Schweigert
4.53 (15)
Best Solution for any Newbie or Expert Trader! This indicator is a unique, high quality and affordable trading tool because we have incorporated a number of proprietary features and a new formula. With this update, you will be able to show double timeframe zones. You will not only be able to show a higher TF but to show both, the chart TF, PLUS the higher TF: SHOWING NESTED ZONES. All Supply Demand traders will love it. :) Important Information Revealed Maximize the potential of Advanced Supply
PainX GainX Blue Spike Fusion AI Synthetic Index Spike Analysis Indicator for MetaTrader 5 Overview PainX GainX Blue Spike Fusion AI is a technical analysis indicator for MetaTrader 5, designed to help traders monitor potential spike setups on compatible synthetic indices. The indicator combines signal monitoring, market-condition analysis, chart markers, notifications, and an on-chart information panel. It presents relevant market information in an organized format to help traders evaluate pote
ARIPoint
Temirlan Kdyrkhan
1 (4)
ARIPoint is a powerful trading companion designed to generate high-probability entry signals with dynamic TP/SL/DP levels based on volatility. Built-in performance tracking shows win/loss stats, PP1/PP2 hits, and success rates all updated live. Key Features: Buy/Sell signals with adaptive volatility bands Real-time TP/SL/DP levels based on ATR Built-in MA Filter with optional ATR/StdDev volatility Performance stats panel (Success, Profit/Loss, PP1/PP2) Alerts via popup, sound, push, or email Cu
Currency Strength Wizard   is a very powerful indicator that provides you with all-in-one solution for successful trading. The indicator calculates the power of this or that forex pair using the data of all currencies on multiple time frames. This data is represented in a form of easy to use currency index and currency power lines which you can use to see the power of this or that currency. All you need is attach the indicator to the chart you want to trade and the indicator will show you real s
The UZFX {SSS} Scalping Smart Signals v5.0 MT5  is a Non Repaint high-performance trading indicator designed for Scalpers, Day Traders, and Swing Traders who demand accurate, real-time signals in fast-moving markets. Developed by (UZFX-LABS), this indicator combines price action analysis, trend confirmation, and smart filtering to generate high-probability buy and sell signals, Warning Signals, and Trend Continuation Opportunities across all currency pairs and timeframes.  Believe me its one of
More from author
Trend Signal Navigator EA – free companion EA for the Trend Signal Navigator indicator This EA trades the confirmed, non-repainting signals of the Trend Signal Navigator indicator automatically, with professional risk and trade management. It is free: you don't need to send a private message or wait for a "bonus EA". How it works Live and demo charts : the EA reads the signals, stop loss and targets of the Trend Signal Navigator indicator through iCustom (default path Market\Trend Signal Navigat
FREE
Overview SR Confluence Pro is a professional MetaTrader 5 indicator for support & resistance and chart pattern analysis. It combines dual S&R engines (high-volume box engine + multi-timeframe pivot engine), automatic detection of 16+ classic chart patterns , and a confluence scoring system that rates how closely price structure and S&R levels align. Every zone is back-tested on the chart history — touches, bounces, breaks, false breaks and bounce rate are combined into a 0–100 strength score — a
A chart overlay indicator for traders who want a structured view of Smart Money Concepts, market structure shifts, order block patterns, fair value gaps, equal highs and lows, and key multi-timeframe price levels directly inside MetaTrader 5. BOS and CHoCH · Internal and Swing Structure · Order Block Finder · Input-Controlled FVG Colors · EQH and EQL · Premium and Discount Zones Product Overview SMC Price Action Patterns is designed to convert raw price action into a clear, visual market map. T
FREE
MACD Divergence Radar Pro Multi-Symbol Divergence Scanner & Visual Dashboard for MetaTrader 5 Regular & Hidden Divergence 20+ Pairs Simultaneous Scan Entry / SL / TP Levels History Statistics One-Click Chart Opening Auto Oscillator Sub-Window Overview MACD Divergence Radar Pro is a professional-grade divergence detection indicator that continuously scans multiple currency pairs and timeframes in real time. It identifies both regular and hidden MACD divergences — bullish and bearish — and presen
Professional account protection for prop-firm challenges and funded accounts. It monitors drawdown, open risk, news windows, trading sessions, manual trades, profit targets, and challenge progress in real time, then warns, locks, de-risks, deletes orders, or closes managed exposure according to your rules. Two draggable on-chart panels — Economic Calendar and Performance Stats — keep news planning and account analytics on the chart without leaving MT5. Built for Prop-Firm Traders This EA does no
VoidFlow IFVG Trade Assistant Pro is a manual-first MetaTrader 5 trading panel for Inverse Fair Value Gap (IFVG) setups. It finds fair value gaps, confirms when price closes through them, scores every setup from 0 to 100, draws a complete trade plan and lets you place the order with one click and one confirmation. Automatic entries are available as an option you switch on yourself. Video walk-through: see the video on this page. Free demo: download it and run it in the Strategy Tester (the demo
ICT Market Structure Pro ICT Market Structure Pro is a Smart Money Concepts / ICT trading tool designed to automatically draw the most important structural and liquidity elements directly on the chart. The indicator helps traders read price action through an institutional lens by mapping market structure shifts, liquidity pools, order blocks, imbalances, premium/discount zones, and key ICT session windows in one place. It supports both single-timeframe and multi-timeframe analysis modes, with a
Trade Assistant Risk Calculator is an all-in-one floating trading panel (Expert Advisor) designed for professional manual traders on MetaTrader 5. It combines Visual Chart Trading , Automatic Risk Calculation , and Advanced Position Management into a single, compact interface. Stop calculating lot sizes manually. Stop guessing your Risk:Reward ratio. Simply drag lines on the chart, and the EA calculates the exact lot size to match your risk percentage, equity, or money target. Important Notes Th
Trade Assistant Risk Calculator is an all-in-one floating trading panel Expert Advisor for MetaTrader 5, built for professional manual traders. It combines visual chart trading , automatic risk calculation , and advanced position management in one compact interface. Stop calculating lot sizes manually. Stop guessing your Risk:Reward ratio. Drag the planning lines on the chart and the EA calculates the exact lot size for your selected risk percentage, equity, fixed-money risk, or fixed-lot workfl
MT5 Indicator · All Markets · Non-Repainting Signals · Entry / SL / TP1-TP3 · MTF + Scanner Momentum Pulse colors every candle by the real momentum behind it, not by price alone. Each bar is scored on five dimensions and placed in one of nine strength states . On top of that you get buy/sell signals with Entry, Stop Loss and three Take Profit levels , a multi-timeframe bias dashboard , a multi-symbol scanner , a forward test of every past signal with win rate and profit factor, and a risk-based
Supertrend core · 11 click-to-toggle confirmation filters · Multi-timeframe trend dashboard · Entry / SL / TP1-TP3 levels · Higher-timeframe filter · Trend cloud · 5,000-bar performance simulation with profit factor & drawdown TrendGuard Pro is a professional-grade MT5 scalping indicator that fortifies every entry signal with up to 11 independent confirmation filters . False breakouts are systematically eliminated before an arrow ever appears on the chart, letting you trade only the highest-pro
ICT Market Structure EA ICT Market Structure EA trades fair value gaps in the direction of market structure, only inside the ICT Silver Bullet hours, and only when the H4 and D1 structure agree. One EA on one chart trades a whole portfolio — by default EURUSD, XAUUSD, USTEC and US500 . Its higher-timeframe context uses the same detection code as the indicator ICT Market Structure Pro (swings, BOS / CHoCH, order blocks, FVGs, premium / discount). The default portfolio and settings were checked wi
Price Action 10 Setups EA Price Action 10 Setups EA automates ten classic bar-by-bar price-action setups — the patterns that discretionary price-action traders consider the most reliable: major trend reversals, final flags, breakouts, High 2 / Low 2 pullbacks, wedges, channels, measured moves, trading-range reversals, opening reversals and magnet (breakout) tests. Every setup is a fully coded rule set with a precise entry, stop and target, so the EA trades the patterns the same way every time. O
MACD Divergence Radar EA MACD Divergence Radar EA trades MACD divergences automatically. It uses the same signal engine as the indicator MACD Divergence Radar Pro — price pivots compared with the MACD histogram (OsMA) or the MACD main line, regular and hidden divergences, bullish and bearish — and turns every freshly confirmed divergence into a trade with a stop beyond the divergence pivot and a fixed reward-to-risk target. One EA on one chart can trade a whole portfolio; by default EURUSD, GBPU
TrendGuard Pro Auto EA is a fully automated trend-following Expert Advisor built on the TrendGuard Pro signal engine. It enters when the Supertrend flips and the confirmation filters agree, protects every trade with an ATR stop loss, can bank profits in steps at TP1 / TP2 / TP3, lets winners run with an ATR trailing stop, and exits on the opposite signal. It trades the chart symbol, or a whole portfolio of symbols from one chart, and is controlled from an interactive on-chart dashboard. Signal e
Price Action 10 Setups Indicator Price Action 10 Setups Indicator finds ten classic bar-by-bar price-action setups on your chart and turns every one of them into a complete trade plan: entry, stop loss and target , drawn on the chart, tracked bar by bar and summarised in a modern dashboard with per-setup statistics, a multi-symbol scanner and alerts. The detection is the same code as in Price Action 10 Setups EA (the automated version on the MQL5 Market): the indicator shows a signal exactly whe
Momentum Pulse EA trades the signals of the Momentum Pulse indicator automatically. The complete Momentum Pulse signal engine is built into the EA: every closed bar is coloured in one of nine momentum states, and a change of state becomes a buy or sell signal with its own Entry, Stop Loss and three take-profit levels. The EA takes those trades with risk-based position sizing, banks profit in steps at TP1 / TP2 / TP3 and manages the rest with breakeven and an ATR trailing stop. One chart can trad
Harmonic patterns with an honest track record. The indicator finds Gartley, Bat, Alt Bat, Butterfly, Crab, Deep Crab, Shark, Cypher, 5-0 and AB=CD patterns on your chart and on dozens of symbols and timeframes at once, draws the XABCD shape with its Potential Reversal Zone (PRZ) and Fibonacci ratios, gives entry, stop loss and three targets, and shows how often each pattern actually worked on each symbol: PRZ hold rate, TP1 and TP2 hit rate and average result in R , measured with exactly the sam
Currency Strength Matrix measures the strength of the 8 major currencies from all 28 pairs , plus gold and any indices you add, and shows it three ways on one chart: a multi-timeframe heatmap (M5 to D1), strength lines in a sub-window, and an automatic strongest-vs-weakest pair picker . Click any cell or pair and the chart switches to it. Closed bars never repaint, and the indicator shows you how its own picks behaved on the history you have loaded. How strength is measured Each currency is comp
Bitcoin Trend Rider EA Bitcoin Trend Rider EA is a trend-following and volatility-breakout Expert Advisor for BTCUSD , ETHUSD and other crypto CFDs. It stays out of sideways and dead markets, enters only when a trend is confirmed, puts a hard ATR stop on every order and lets winning trends run with a chandelier trailing stop. No grid, no martingale, no averaging down, no hedging tricks. Everything is visible: every input is in the Inputs window, the ready-made setups are listed below, and the lo
Gold Edge Portfolio EA trades XAUUSD with six independent, simple strategies at the same time . Each engine has its own on/off switch, its own magic number and its own risk per trade, and every trade is placed with a hard stop loss . There is no grid, no martingale, no averaging and no hedging — one position per engine at most. What makes it different is transparency : a dashboard on the chart shows the live state and the real statistics of every engine — trades, win rate, profit factor, net pro
Session Breakout Portfolio EA A session-range breakout portfolio for gold, the Nikkei and the yen, traded from one chart. Every market has a quiet session and an active open. The EA builds the range in the quiet session (Asian range, pre-open or opening range), in the exchange's own time zone with automatic daylight saving, and trades the breakout at the active session open with OCO stop orders. One stop-protected trade per market per day. No grid, no martingale, no averaging. Default portfolio
Trend Signal Navigator – trend, signals, targets and honest statistics in one indicator Trend Signal Navigator is an all-in-one trend signal system for MetaTrader 5. It shows the trend direction and regime, gives confirmed non-repainting BUY/SELL signals with an adaptive stop loss and three take-profit targets , marks reversal zones and key levels, and measures how its own signals performed on your chart in a live statistics panel. No hidden rules: every number in the panel can be re-counted fro
Evening Cross MeanReversion EA — Institutional Multi-Pair FX Cross Mean-Reversion Portfolio Evening Cross MeanReversion EA is a professional, non-grid, non-martingale multi-currency mean-reversion Expert Advisor engineered for the post-London evening session and the calm Asian liquidity window. By attaching the EA to a single M15 chart (for example, EURNZD M15 ), it simultaneously monitors and trades up to 8 liquid FX cross pairs ( EURNZD, GBPCAD, GBPJPY, AUDNZD, GBPCHF, EURCHF, GBPAUD, EURCAD )
EA Performance Ledger shows what every Expert Advisor on your account really earns. MetaTrader shows one balance for the whole account; when several EAs, manual trades and copied signals share it, you cannot see which one carries the account and which one drains it. The Ledger reads the account history, rebuilds every closed position and splits the results by EA, symbol, strategy tag, direction and manual vs automated trading, in one clear dashboard. Read-only. The Ledger never places, modifies
Local Trade Copier Pro copies trades between MetaTrader 5 terminals running on the same Windows PC or VPS . One EA, two modes: run it as Master on the account that trades and as Receiver on every account that should follow. Positions, pending orders, SL/TP changes, partial closes and closes are copied within a few hundred milliseconds including the broker's execution (median 333 ms in our live test), through the terminals' shared Common Files folder: no DLL, no internet connection, no extra soft
Currency Strength Matrix EA — Strength Exhaustion on all 28 FX pairs Currency Strength Matrix EA measures the strength of the 8 major currencies ( EUR, GBP, AUD, NZD, USD, CAD, CHF, JPY , optionally plus gold) from all 28 currency pairs on three timeframes, and trades the moment when the strongest and the weakest currency are stretched too far. It is the automated companion of our Currency Strength Matrix Pro indicator and uses the same strength engine. Attach it to one chart (any symbol, any ti
Turn your MT5 account into a signal channel. TradeCast posts every trade action of your account to up to three Telegram channels, groups or private chats: new trades, pending orders, stop-loss and take-profit changes, breakeven, partial and full closes with the result in money, pips and R , a chart screenshot, and daily, weekly and monthly performance summaries. Trades opened by hand, by any Expert Advisor or from the MT5 mobile app are all detected, because TradeCast watches the account itself.
Custom Charts Pro builds seconds charts (S1 … S3600, any value), Renko , Range bars and Tick charts as real MetaTrader 5 custom symbols, from your broker's real ticks . It fills the history first, then keeps every chart updated live, for as many symbols and chart types as you like, from one control panel. The generated charts are normal MT5 charts: your indicators, templates, drawings and Expert Advisors work on them, and so does the Strategy Tester . Chart types Seconds : bars of N seconds (S1,
EA Robustness Lab tells you whether an Expert Advisor's results are robust or overfitted. A good backtest is not proof: it can come from a lucky order of trades, a few outsized wins, costs that were too optimistic, parameters fitted to the past, or a market regime that is gone. The Lab takes the closed trades of a strategy, puts them through Monte Carlo, walk-forward, stability, regime and optimisation tests, compares live trading with the backtest, and sums it all up in one robustness score fro
Filter:
No reviews
Reply to review