
VWAP Suite Pro
- Indicators
-
Ahmed Hamed Hamed Eadwan
 Hello, I'm Ahmed — a trader and MQL5 developer based in the
United Arab Emirates, and the founder of R protocols.
I've been writing code since 1984 and trading the markets since 2006.
For many years, I developed trading tools for my own use, refining them
through real market experience. - Version: 1.1
- Updated: 28 July 2026
- Activations: 5
Most VWAP indicators give you a single line that resets at midnight. That works well enough on simple setups, but falls apart the moment you want to compare how price is behaving relative to the London open versus the New York open, or when you want to anchor a VWAP to a specific swing high from three weeks ago and keep it on screen while also watching the daily and weekly levels at the same time.
I kept adding separate indicators to solve each of these needs until I had five VWAP tools on the same chart, all fighting for space in the inputs panel and running their own calculation loops. Performance degraded. The chart became cluttered. Toggle buttons did not exist so every visibility change meant opening the indicator properties.
VWAP Multi-Session Pro was written to replace all of that with a single indicator that handles every VWAP type I actually use in trading, built around a calculation engine designed for correctness first and performance second.
What VWAP actually measures and why multiple timeframes matter
VWAP is the average price paid weighted by volume over a given period. When price trades above the daily VWAP, the average participant who bought since the open is in profit. When it trades below, the average buyer is underwater. This makes the VWAP a natural reference point for mean reversion setups and for gauging who controls price at any given moment.
The limitation of a single daily VWAP is that it captures only one timeframe of market activity. A trader looking at an intraday chart also needs to know where the weekly fair value sits, whether the current session has established its own mean yet, and where the institutional anchor from a recent key event is. These are different questions, and they require different VWAP calculations running simultaneously.
The eight VWAP types included
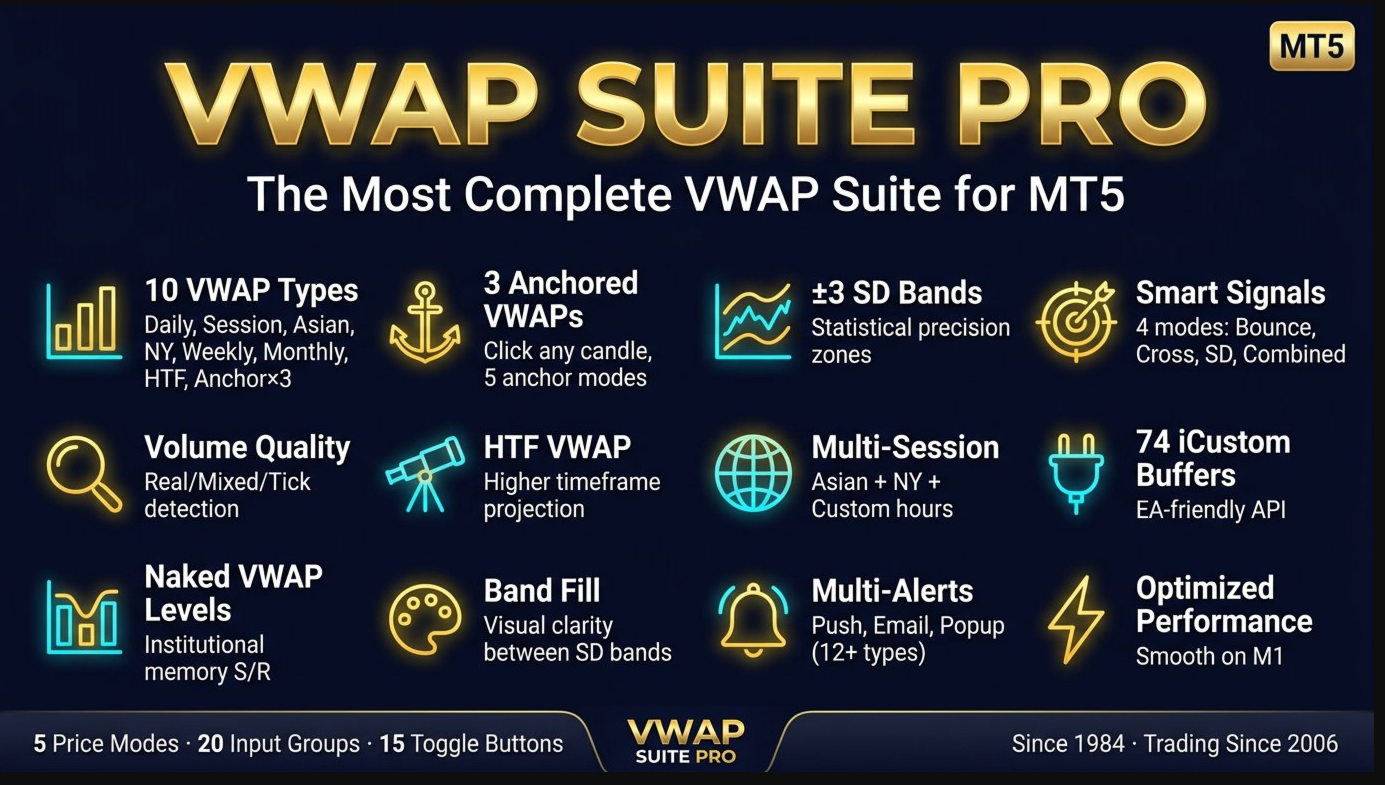
Daily VWAP. Resets at the hour you specify, not just at broker midnight. If your broker runs on GMT+3 and you want your daily reset to match the UTC midnight of the underlying market, you set DailyResetHour = 21 and the calculation adjusts accordingly. The auto GMT detection reads the broker server time on load so you do not need to manually adjust for DST changes.
Session VWAP. Runs only during the trading hours you define. Set your session start and end in broker time hours and minutes. The indicator filters out bars outside this window and calculates VWAP only for the active session period. This gives you a clean session-specific fair value rather than mixing overnight activity into the calculation. Hidden automatically on D1 and higher timeframes where hour-based filtering is meaningless.
Asian Session VWAP. Pre-configured for the typical Asian trading hours but fully adjustable. Useful for identifying the Asian range midpoint and tracking whether London or New York respects or breaks through Asian fair value. Hidden on D1 and higher.
New York Session VWAP. Same approach, pre-configured for New York hours. Particularly useful for equity traders who follow the cash session and for forex traders tracking the New York lunch and close dynamics. Hidden on D1 and higher.
Weekly VWAP. Resets every Monday and accumulates volume-weighted price for the full week. This gives you the current week's fair value, which acts as a significant reference point for swing traders and for understanding where institutional positioning has averaged out over the week. Works on all timeframes.
Monthly VWAP. Resets on the first bar of each new month. The monthly VWAP is used by many institutional desks as a benchmark reference. When monthly VWAP and daily VWAP converge, the area carries more weight. Works on all timeframes.
HTF VWAP. Calculates VWAP from a higher timeframe of your choice using CopyRates() to pull the required history. On an H1 chart you can run a D1-based VWAP, or on a D1 chart you can run a W1 or MN-based VWAP. The indicator validates that the HTF period is strictly above the current chart period and warns you with a recommendation if it is not. A retry mechanism handles the case where the terminal has not yet loaded the HTF history on first attach.
Anchored VWAP, three independent points. The first anchor can be placed manually by clicking on the chart, set to a specific datetime, or detected automatically using swing point detection across a configurable lookback period and optional MTF search. The indicator includes an explicit slot selection system using labeled buttons (SET A1, SET A2, SET A3) so you always know which anchor point your next click will set. Each of the three anchors has its own color, its own SD bands, and its own visibility toggle. Anchor times persist across chart switches and terminal restarts via GlobalVariables.
Standard Deviation bands
Each VWAP type includes three pairs of standard deviation bands calculated using the volume-weighted variance formula. The SD is not a simple price standard deviation -- it is derived from the same volume-weighted accumulator used for the VWAP itself, which gives a statistically consistent measure of price dispersion around the weighted mean.
You can show or hide each SD level independently. The multipliers for SD1, SD2 and SD3 are configurable. The indicator validates that SD1 < SD2 < SD3 and rejects the configuration if they are inverted, preventing overlapping bands that would be visually meaningless.
In practice, the SD1 band covers the area where price spends most of its time during a normal session. SD2 marks the edge of statistically normal range. SD3 extensions are relatively rare and often mark exhaustion or news-driven spikes. The combination of VWAP and its SD bands gives you a dynamic channel that respects actual volume distribution rather than assuming equal probability across the range.
Color system
Each VWAP type has a single base color input. The SD bands are derived automatically from that base color using an adaptive brightness calculation based on the ITU-R BT.601 luminance formula. For dark and medium-saturation base colors, the SD bands step progressively lighter. For light base colors, they step progressively darker. The step size is controlled by a single SDBrightnessStep input.
The result is that if you change your Daily VWAP base color from blue to orange, all seven lines in the daily group (VWAP plus three SD pairs) update coherently. You never have to manually adjust six additional color inputs every time you want to try a different palette.
Signal arrows
The signal system operates on fully closed bars only. The live bar is never evaluated for signals, which eliminates repainting by design.
Four signal modes are available.
VWAP Bounce. Looks for price to approach the VWAP line within the configured tolerance, with momentum confirming a reversal. Buy signals fire when price bounces up from below the VWAP. Sell signals fire when price bounces down from above.
SD Bounce. Same logic applied to the SD bands instead of the VWAP line. Useful for mean reversion trades from statistical extremes rather than from the mean itself.
VWAP Cross. Fires when price closes on one side of the VWAP having been on the other side for at least one bar. This catches trend-following entries on VWAP reclaims rather than bounces.
Combined. Requires both VWAP proximity and a momentum confirmation pattern, filtering for the highest-confidence setups only.
For all modes you choose the VWAP source (Daily or Session) and which levels participate in signal generation (VWAP line, SD1, SD2, SD3). Arrow size and offset from price are configurable. Arrow colors have separate inputs for buy and sell.
Price mode for VWAP calculation
Five price modes are available: Typical price (High+Low+Close)/3, Close only, Median (High+Low)/2, Weighted close (High+Low+Close+Close)/4, and OHLC4 (Open+High+Low+Close)/4. The default is Typical, which is the standard for VWAP calculation in institutional practice. You can switch to Close-based calculation if you prefer a more reactive input.
Volume can use tick volume (the default, available on all brokers) or real volume if your broker provides it. The indicator checks for real volume availability on initialization and warns you if it is requested but not available.
Naked VWAP levels
When the Daily VWAP is enabled and ShowPrevVWAPLevels is active, the indicator draws horizontal lines at the closing VWAP values of the previous N days (configurable, 1 to 30 days back). These represent price levels that acted as volume-weighted fair value in prior sessions.
With OnlyNakedLevels enabled, a level is automatically removed once price touches it in the current session. The remaining visible lines are the ones that have not yet been revisited, sometimes called naked VWAPs in the sense that they have been left behind without a subsequent test. These untested levels often attract price in future sessions as the market seeks to revisit prior fair value.
The line style, color and width for naked levels are separately configurable from the main VWAP lines.
Band fill
An optional filled area can be drawn between any two SD bands for any of the five main VWAP types (Daily, Session, Weekly, Monthly, HTF). You select the source VWAP and the SD level that forms the outer boundary of the fill. The fill color is a separate input. This is implemented as a DRAW_FILLING plot, which in MT5 requires a dedicated pair of buffers -- this is handled internally without affecting the buffer index mapping of any other plot.
Alert system
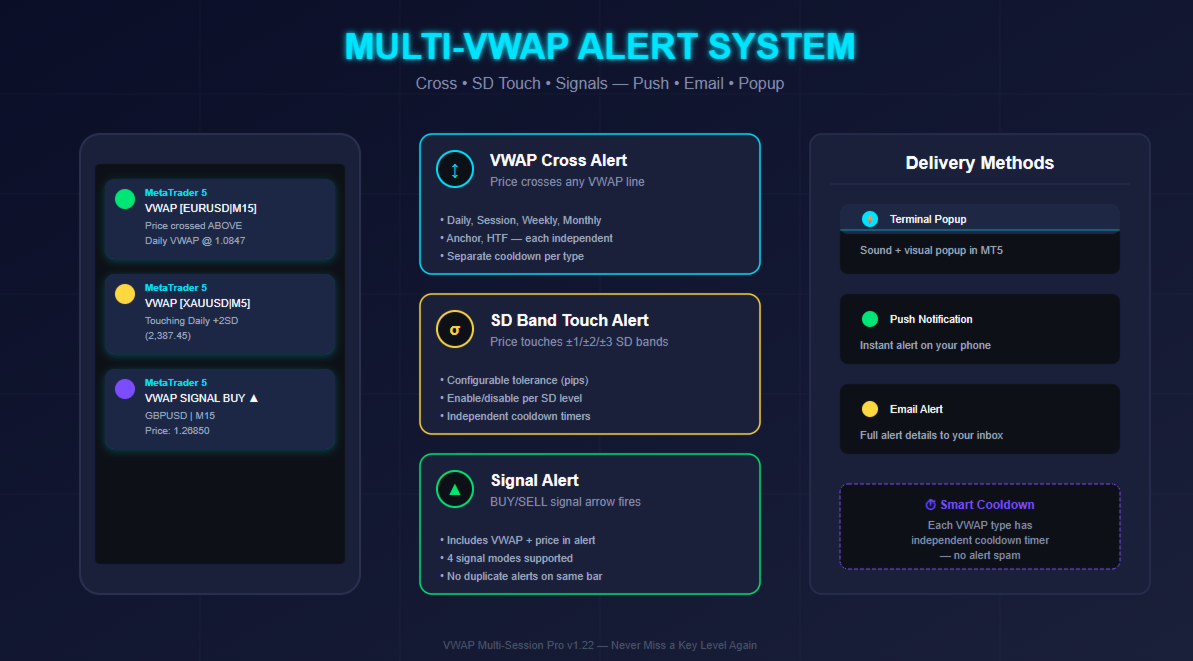
Alerts fire for: VWAP cross (price closes on the opposite side of the VWAP line), SD touch (price closes within the configured tolerance of any SD band), and signal arrows. Each alert type has an independent cooldown timer to prevent repeated alerts in fast-moving conditions. Alerts support the MT5 popup alert, push notification to the MetaQuotes mobile app, and email. All alert categories are individually enabled or disabled.
Starting from version 1.21, VWAP cross alerts cover all active VWAP types independently (Daily, Session, Weekly, Monthly, Anchored, HTF) with separate last-alert timestamps per type, eliminating the false suppression that occurred when two different VWAP types crossed within the same cooldown window.
On-chart interface
Nine toggle buttons appear at the top of the chart for Daily, Session, Anchor, Asian, NY, Weekly, Monthly, HTF and Signals. Each button reflects the current visibility state with distinct active and inactive colors. Toggle states are saved to GlobalVariables so they survive chart switches and terminal restarts. If you hide the Weekly VWAP, it stays hidden when you switch symbols and come back.
In Manual anchor mode, an additional row of buttons appears for SET A1, SET A2 and SET A3. Clicking one of these buttons activates that slot, the button highlights to confirm the selection, and your next click on the chart places the anchor at the clicked bar. Each anchor also has a separate visibility toggle button so you can show or hide individual anchors without removing their time references.
An information panel displays the current numeric value of each active VWAP, positioned at configurable chart coordinates. The panel background, border, text color and font size are all inputs. Panel position defaults to the upper left area but can be moved anywhere.
Performance and multi-chart use
Calculation runs in a single forward pass from the oldest available bar to the current bar. The MaxHistoryBars input caps the number of bars processed, which is useful on symbols with very long history where you only need VWAP context for a limited lookback. The default is 50,000 bars.
All chart objects and GlobalVariables are prefixed with the chart ID, so multiple instances of the indicator on different charts in the same terminal do not interfere with each other. This also means you can run it on EURUSD H1 and EURUSD H4 simultaneously without the toggle states or anchor times from one chart overwriting the other.
For EA developers -- buffer index reference
All 74 buffers are INDICATOR_DATA type. Buffer visibility toggling is handled exclusively through PLOT_DRAW_TYPE = DRAW_NONE, not by switching buffer types. This means the plot-to-buffer mapping is fixed and predictable regardless of which VWAP types are enabled. You can safely access any buffer via iCustom() with the buffer index below and the value will be EMPTY_VALUE when the corresponding VWAP is inactive, never garbage.
The indicator accepts no mandatory iCustom parameters beyond the indicator path. All configuration is read from the indicator inputs which you pass in the standard iCustom() parameter list in the order they appear in the inputs panel.
| Buffer | Name | Buffer | Name |
|---|---|---|---|
| 0 | Daily VWAP | 1 | Daily +1SD |
| 2 | Daily -1SD | 3 | Daily +2SD |
| 4 | Daily -2SD | 5 | Daily +3SD |
| 6 | Daily -3SD | 7 | Session VWAP |
| 8 | Session +1SD | 9 | Session -1SD |
| 10 | Session +2SD | 11 | Session -2SD |
| 12 | Session +3SD | 13 | Session -3SD |
| 14 | Anchor 1 VWAP | 15 | Anchor 1 +1SD |
| 16 | Anchor 1 -1SD | 17 | Anchor 1 +2SD |
| 18 | Anchor 1 -2SD | 19 | Anchor 1 +3SD |
| 20 | Anchor 1 -3SD | 21 | Asian VWAP |
| 22 | Asian +1SD | 23 | Asian -1SD |
| 24 | Asian +2SD | 25 | Asian -2SD |
| 26 | Asian +3SD | 27 | Asian -3SD |
| 28 | NY VWAP | 29 | NY +1SD |
| 30 | NY -1SD | 31 | NY +2SD |
| 32 | NY -2SD | 33 | NY +3SD |
| 34 | NY -3SD | 35 | Weekly VWAP |
| 36 | Weekly +1SD | 37 | Weekly -1SD |
| 38 | Weekly +2SD | 39 | Weekly -2SD |
| 40 | Weekly +3SD | 41 | Weekly -3SD |
| 42 | Monthly VWAP | 43 | Monthly +1SD |
| 44 | Monthly -1SD | 45 | Monthly +2SD |
| 46 | Monthly -2SD | 47 | Monthly +3SD |
| 48 | Monthly -3SD | 49 | HTF VWAP |
| 50 | HTF +1SD | 51 | HTF -1SD |
| 52 | HTF +2SD | 53 | HTF -2SD |
| 54 | HTF +3SD | 55 | HTF -3SD |
| 56 | Buy Signal arrow | 57 | Sell Signal arrow |
| 58 | Band Fill upper | 59 | Band Fill lower |
| 60 | Anchor 2 VWAP | 61 | Anchor 2 +1SD |
| 62 | Anchor 2 -1SD | 63 | Anchor 2 +2SD |
| 64 | Anchor 2 -2SD | 65 | Anchor 2 +3SD |
| 66 | Anchor 2 -3SD | 67 | Anchor 3 VWAP |
| 68 | Anchor 3 +1SD | 69 | Anchor 3 -1SD |
| 70 | Anchor 3 +2SD | 71 | Anchor 3 -2SD |
| 72 | Anchor 3 +3SD | 73 | Anchor 3 -3SD |
Common questions
Does the indicator repaint? No. Signal arrows are placed on fully closed bars and are never moved or removed after the bar closes. The VWAP lines do not repaint -- they extend forward as new bars form, which is the correct behavior for a cumulative calculation. The current bar's VWAP value updates on each tick as expected.
Which timeframes work? Daily, Weekly and Monthly VWAP work on all timeframes from M1 to MN. Session, Asian and NY VWAP are designed for intraday timeframes and are automatically hidden on D1 and higher, where an hourly session filter is meaningless because each bar spans a full day or more. The Anchored VWAPs work on all timeframes. HTF VWAP requires the HTF period to be above the current chart period and the indicator validates this at load time.
Does it work on crypto, indices and stocks? Yes. The indicator uses tick volume by default, which is available on all instruments in MT5. If your broker provides real volume for a specific instrument, you can enable UseRealVolume in the inputs. The pip value calculation handles 5-digit forex pairs, 2-digit pairs, indices and metals correctly.
Can I use it on multiple charts at the same time? Yes. All chart objects, GlobalVariables and button names are prefixed with the chart ID, so instances on different charts are fully independent. You can run it on EURUSD H1 and EURUSD H4 simultaneously with different settings and different anchor points on each chart.
How do I set an anchor point manually? Enable UseAnchoredVWAP and set AnchorMode to ANCHOR_MANUAL. The SET A1 button will appear below the main toggle buttons. Click SET A1 to activate the slot (the button will highlight). Then click anywhere on the chart at the bar you want to anchor to. The VWAP will immediately calculate from that point forward. For additional anchor points, enable UseAnchor2 or UseAnchor3, then use the SET A2 and SET A3 buttons.
What is the HTFLookbackDays input? When using HTF VWAP, the indicator calls CopyRates() to pull history from the higher timeframe. HTFLookbackDays sets how many calendar days of HTF bars to request. The default is 365. For a D1 HTF on a symbol with 5 years of history, 365 days is usually enough context. Increase this if you want the HTF VWAP to accumulate over a longer period.
Does it work on prop firm accounts? The indicator is read-only and does not place, modify or close any orders. It uses no DLLs and makes no external connections. It should pass any standard prop firm indicator policy review, but always verify the specific rules of your firm.
Will it slow down my terminal? The calculation runs in a single forward pass. On a standard PC with 50,000 bars of history and all eight VWAP types enabled, the initial full recalculation takes under two seconds. Subsequent tick updates process only the current bar and are essentially instant. The MaxHistoryBars input lets you limit history processing if needed.
Input reference summary
VWAP Settings: enable/disable each VWAP type, price mode, real volume toggle.
Standard Deviation: show/hide each SD level, multipliers for SD1 / SD2 / SD3.
Signal Arrows: enable signals, signal mode, VWAP source, which levels fire signals, lookback bars, tolerance buffer, require close, arrow colors and size.
Session Settings: session start and end in hours and minutes (broker time), daily reset hour.
Broker Time Zone: auto GMT detection toggle, manual GMT offset for when auto is disabled.
Multi-Session: Asian and NY enable toggles, start and end hours.
Weekly / Monthly VWAP: enable toggles.
HTF VWAP: enable toggle, timeframe selection, lookback days.
Anchored VWAP: anchor mode (Auto / Manual / DateTime / Weekly / Monthly), anchor timeframe for auto search, lookback bars, lock anchor toggle, manual datetime input, MTF cooldown.
Multi-Anchor: enable Anchor 2 and Anchor 3, their datetime inputs, their base colors.
Previous VWAP Levels: enable toggle, days back (1-30), only naked levels toggle, line color, style and width.
Band Fill: enable toggle, source VWAP, SD level for outer boundary, fill color.
Alerts: enable toggle, alert on VWAP cross, SD1 touch, SD2 touch, SD3 touch, signal arrow. Push notification toggle, email toggle, cooldown seconds, SD touch tolerance in points.
Toggle Buttons: show/hide the on-chart button row, vertical position in pixels from chart top.
Colors: one base color per VWAP type (eight inputs total).
Line Widths: main VWAP line width, SD band line width.
SD Color Derivation: brightness step between SD levels, range 10 to 60.
Display Settings: info panel enable, panel X and Y position, background color, border color, text color, font size.
Performance: MaxHistoryBars.
Debug: EnableDebugLog to print diagnostic messages to the Experts tab.
Using the indicator from an EA
The indicator exposes 74 INDICATOR_DATA buffers with fixed indices regardless of which VWAP types are enabled. Buffer 0 is Daily VWAP, buffer 7 is Session VWAP, buffer 35 is Weekly, buffer 42 is Monthly, buffer 49 is HTF, buffer 56 is the Buy arrow, buffer 57 is the Sell arrow. A value equal to EMPTY_VALUE means the corresponding VWAP is disabled or the bar falls outside the session window. A ready-to-use iCustom() example with the full parameter list and buffer index table is posted in the Comments section below.
For questions or issues, use the Comments section below. I check it regularly and respond to all technical questions.






























This is a superb product that stands at the pinnacle of VWAP-related indicators, offering both flexible customization and a beautiful layout. It features a comprehensive design that even makes buffer indices available for custom EA development. Personally, I use the VWAP—anchored to the "New York True Open"—along with three standard deviation bands for XAUUSD trading; by combining this with Ravi Gurung’s "Power of Three AMD Protocol," I feel I have a sufficient grasp of market structure for actual trading, though the tool offers endless possibilities for application tailored to each trader's specific needs. Highly recommended.