Footprint Flow Studio

Footprint Flow Studio turns a MetaTrader 5 chart into a full footprint chart. Every bar is split into price rows, and each row shows how much was traded on the bid and on the ask. You see where buyers and sellers were aggressive, where they were absorbed, and where an auction ran out, bar by bar.

The panel always shows which data is used. Forex and CFD symbols in MT5 only have tick volume: every quote change counts as 1, and the buy/sell side is estimated from the direction of the price change. This shows where the activity was and which way price was pushed, but it is not exchange order flow, and the numbers will differ from a futures data feed. Symbols with exchange trades (futures, stocks and some crypto feeds) use real volume, and the side then comes from the broker's trade data. The panel badge reads REAL VOLUME or TICK VOLUME and lists the classification method used.

Footprint cells

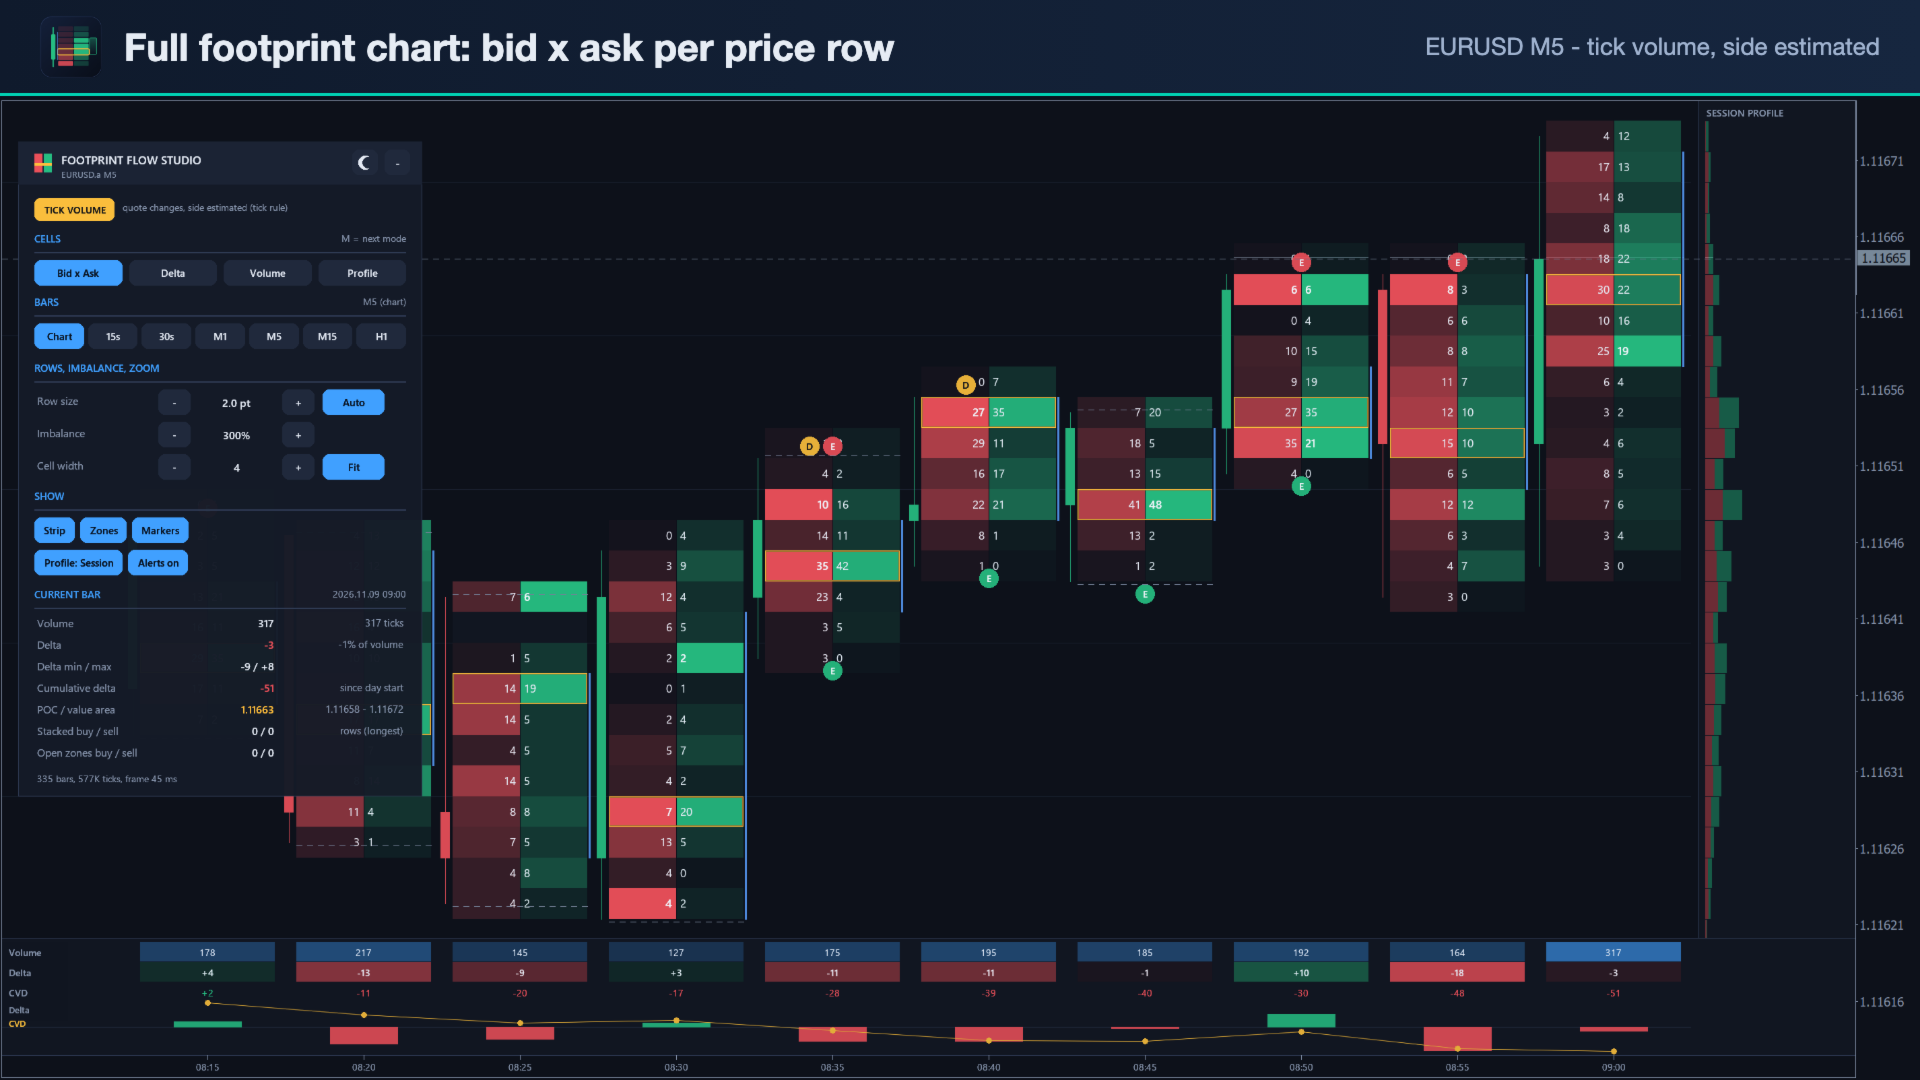
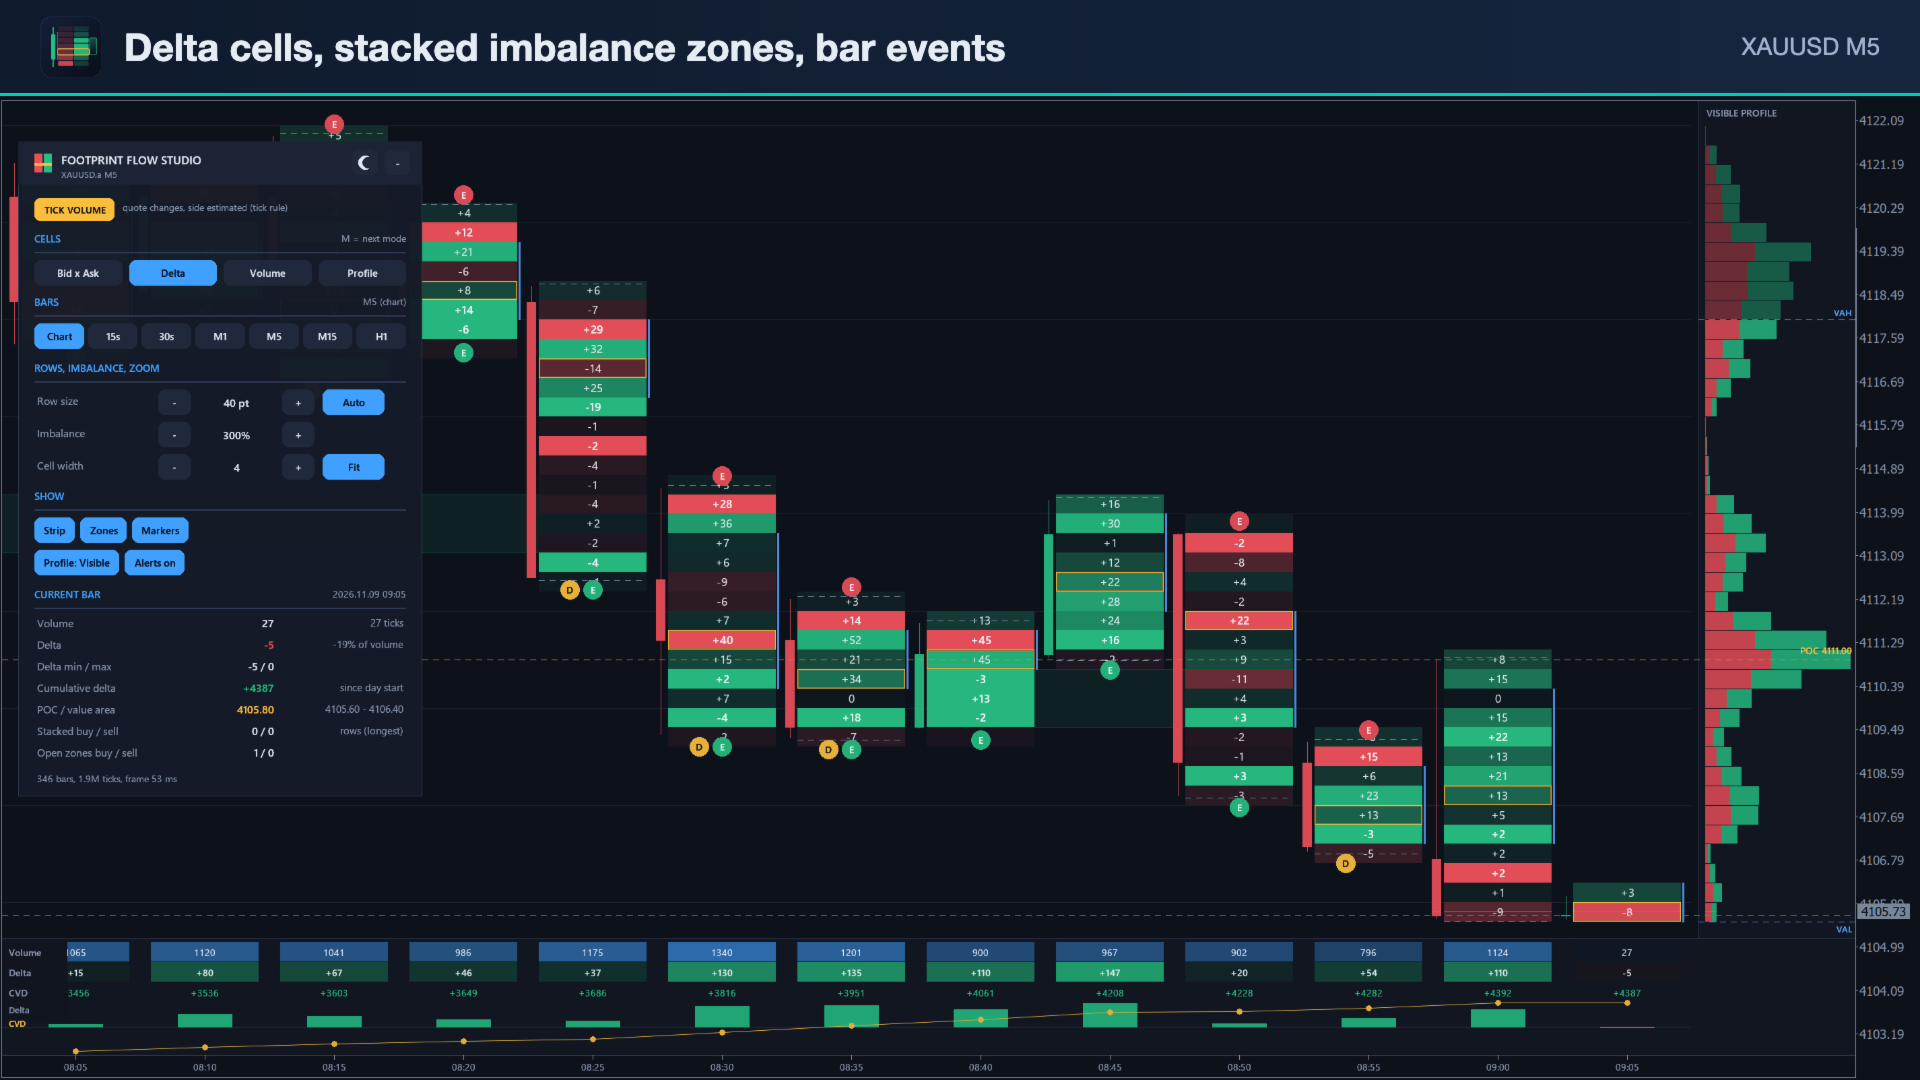
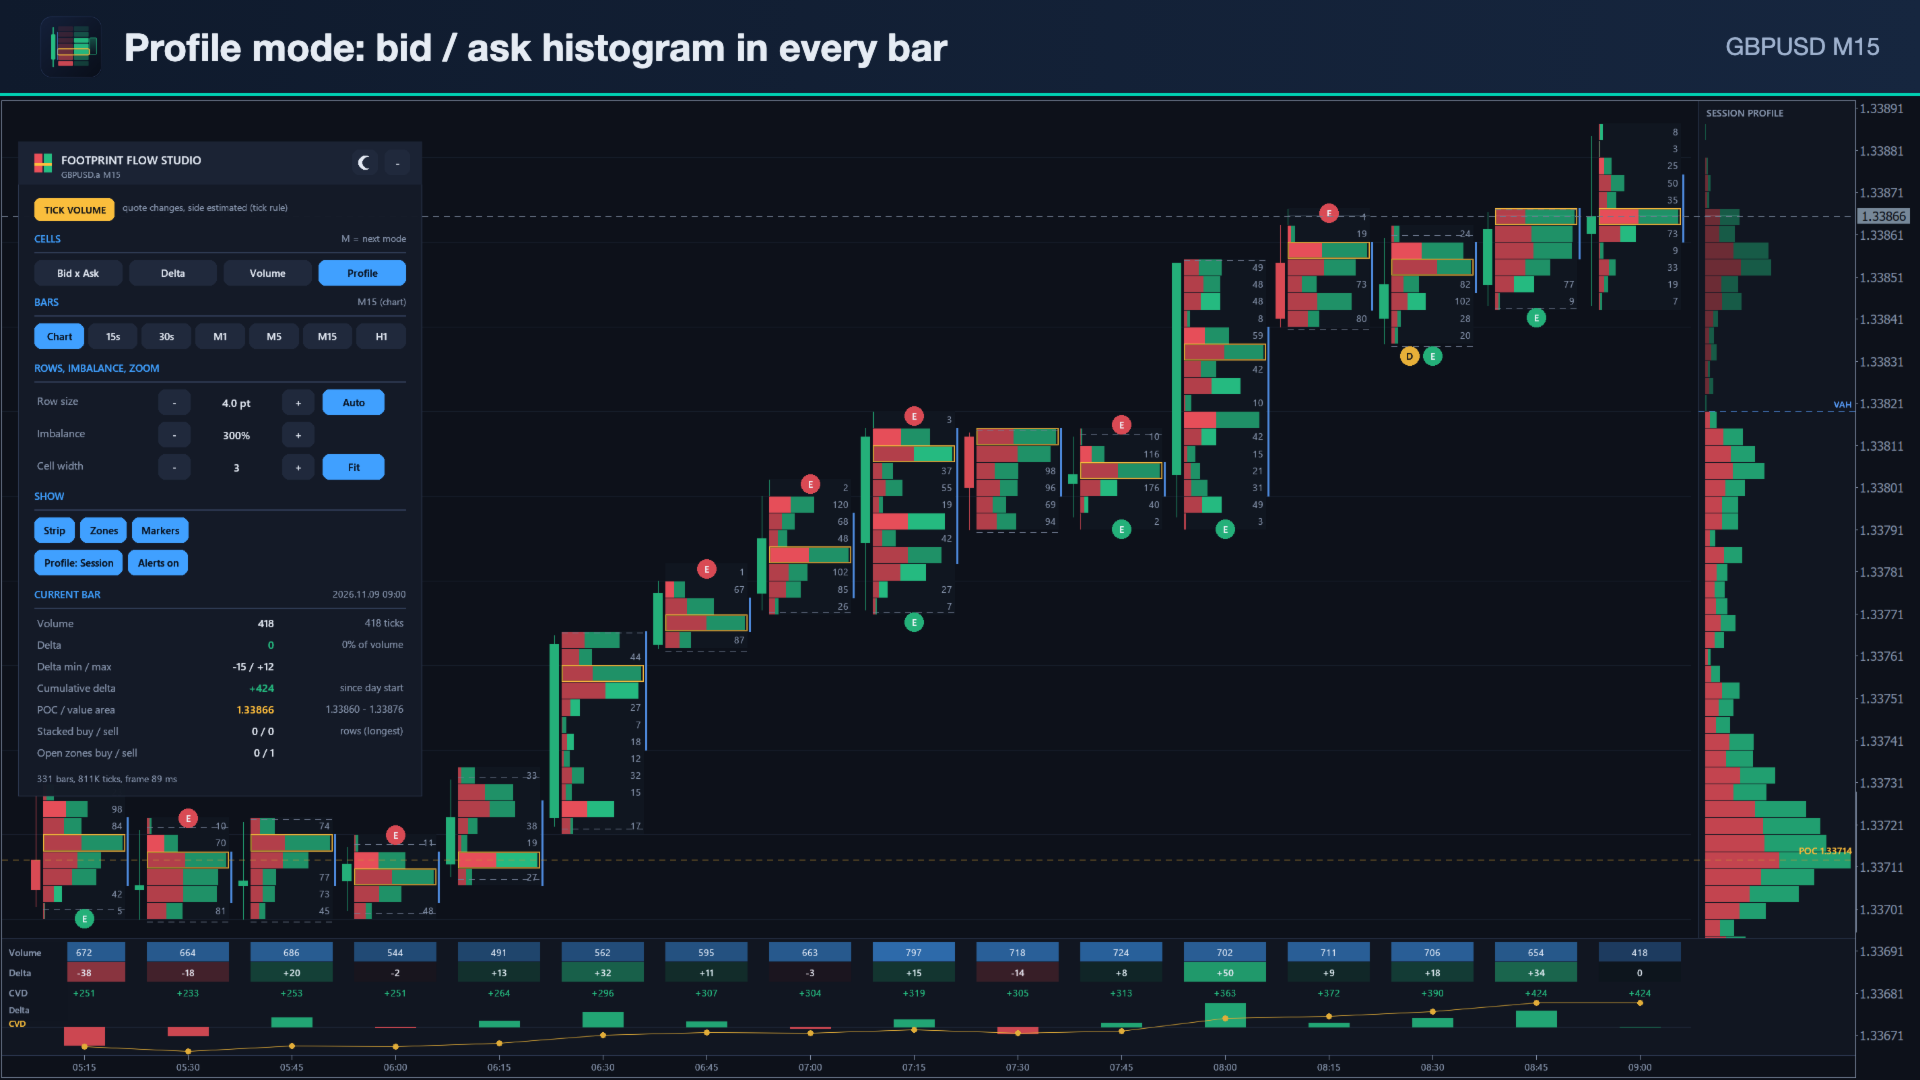
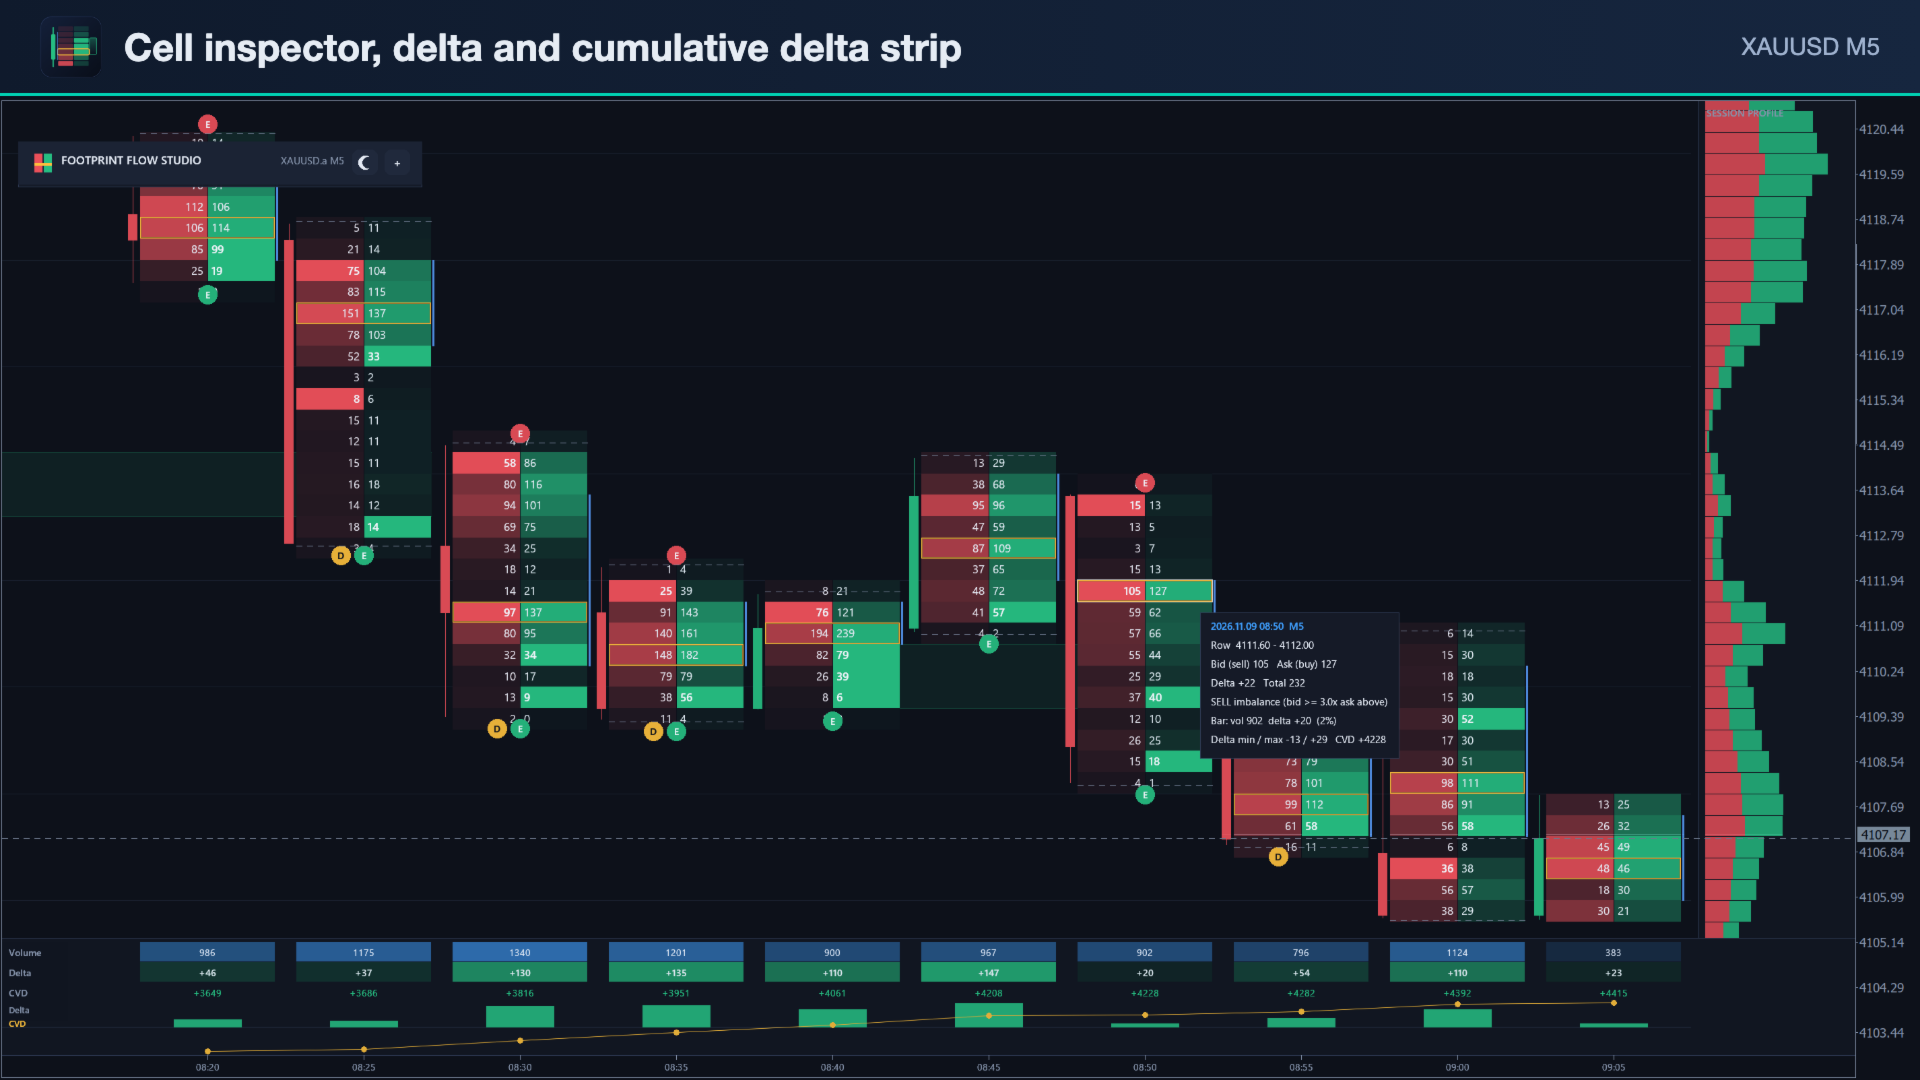
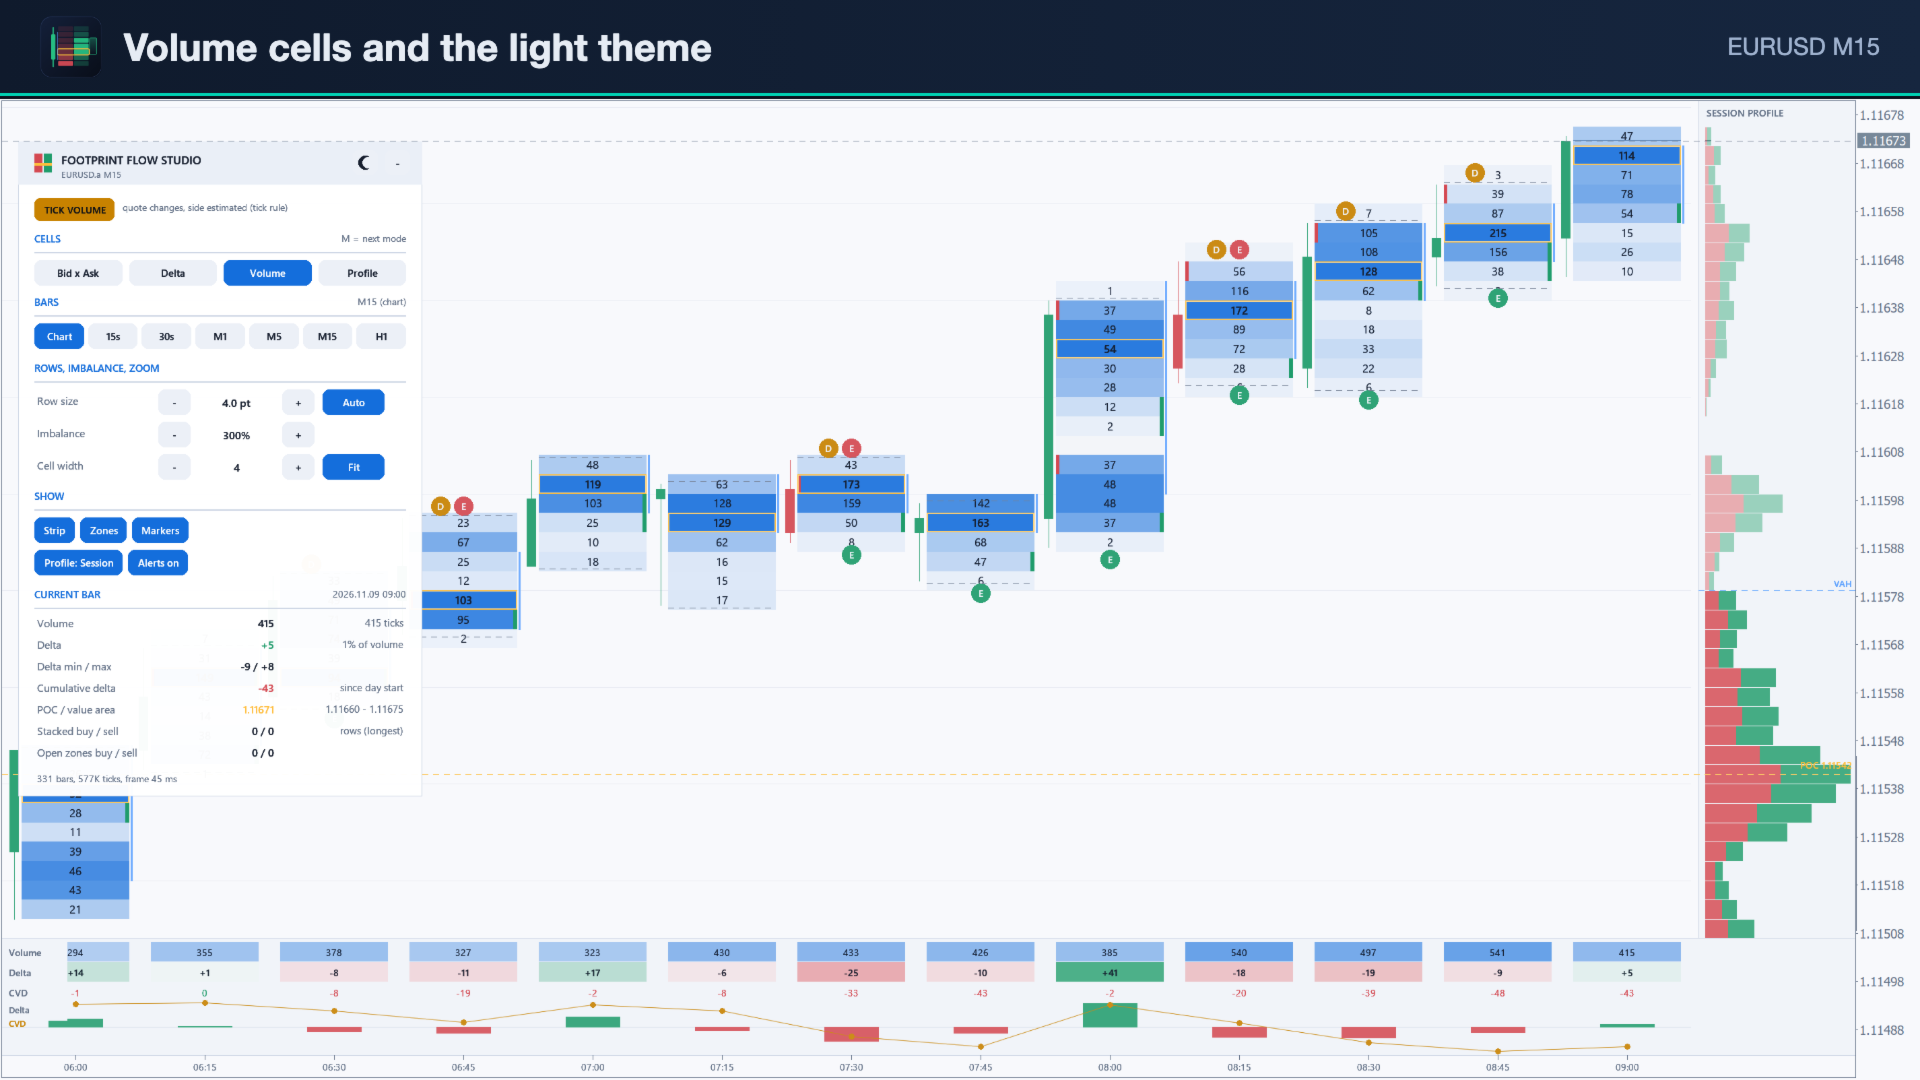
  • Four cell modes, one click each (or key M): Bid x Ask (sell volume left, buy volume right), Delta per row, Volume per row, and Profile (a horizontal bid/ask histogram inside every bar).
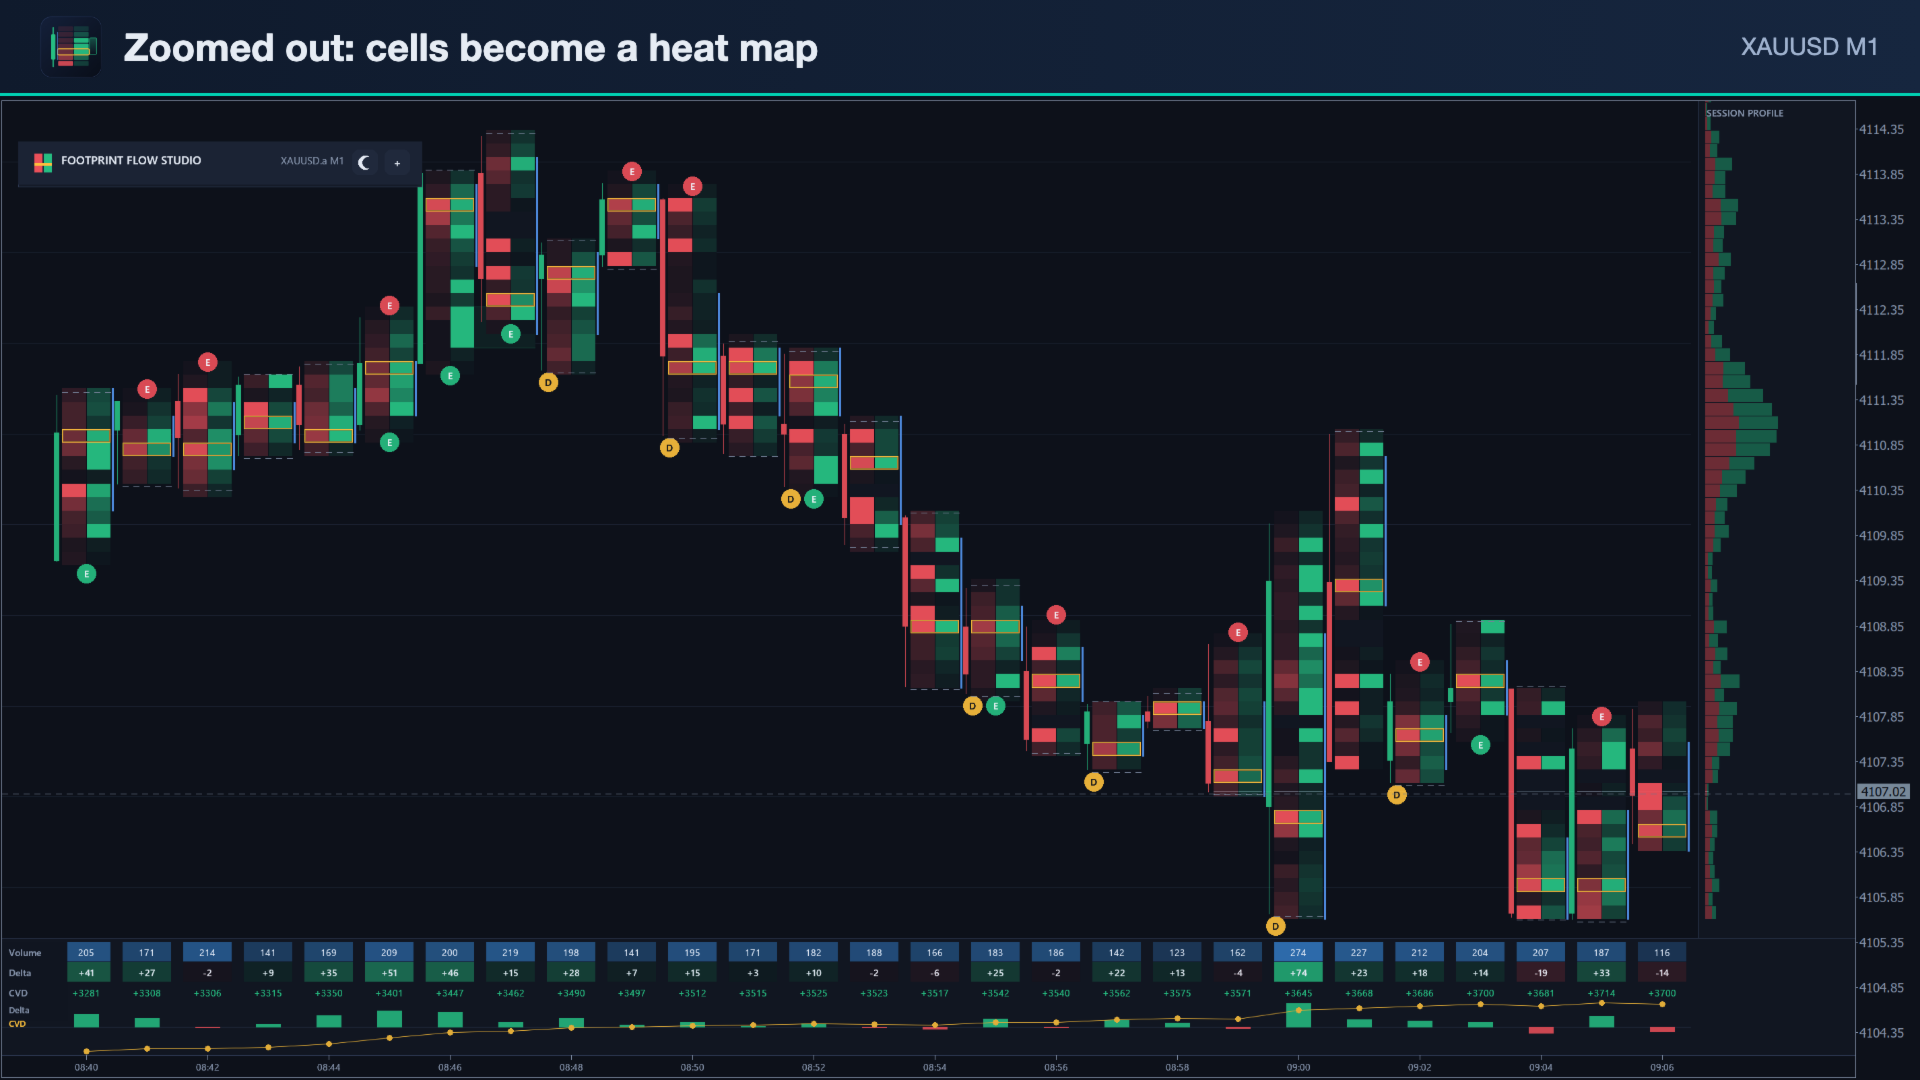
  • Cells are shaded by size, so the heavy rows stand out even when you zoom far out and the numbers are hidden.
  • A slim candle next to every footprint column shows open, high, low and close.
  • POC (the row with the most volume) is outlined in every bar. A bracket marks the bar's value area (70 % by default).
  • Cell inspector: move the mouse over any cell to see the exact bid, ask, delta and total. It also shows any imbalance, and the bar's volume, delta, delta min/max and cumulative delta.

Imbalances and zones

  • Diagonal imbalances: the ask of a row is compared with the bid one row lower, and the bid with the ask one row higher. The ratio can be set (300 % by default) and changed live on the panel.
  • Stacked imbalances (3 or more rows in a row by default) become zones. A zone is extended to the right until price trades back into it. Open zones and tested zones look different.
  • A minimum cell volume keeps thin rows from giving false imbalances.

Bar events

  • A: absorption. Heavy selling at the low with a close in the upper half, or heavy buying at the high with a close in the lower half.
  • E: exhaustion, where the extreme row traded far less than the bar's average row.
  • D: delta divergence. A higher high with negative delta, or a lower low with positive delta.
  • Unfinished auction: both sides traded at the bar's extreme. It is shown as a dotted line.

Delta strip, profile and time axis

  • Statistics strip under the bars: volume, delta and cumulative delta per bar, with a delta histogram and a cumulative delta line. Cumulative delta resets each trading day or runs continuously.
  • Right-side profile of the current session or of the visible bars, with POC, VAH and VAL lines across the chart.
  • Own time axis with date changes, because footprint bars can differ from the chart bars.

Bars from ticks: seconds to H4

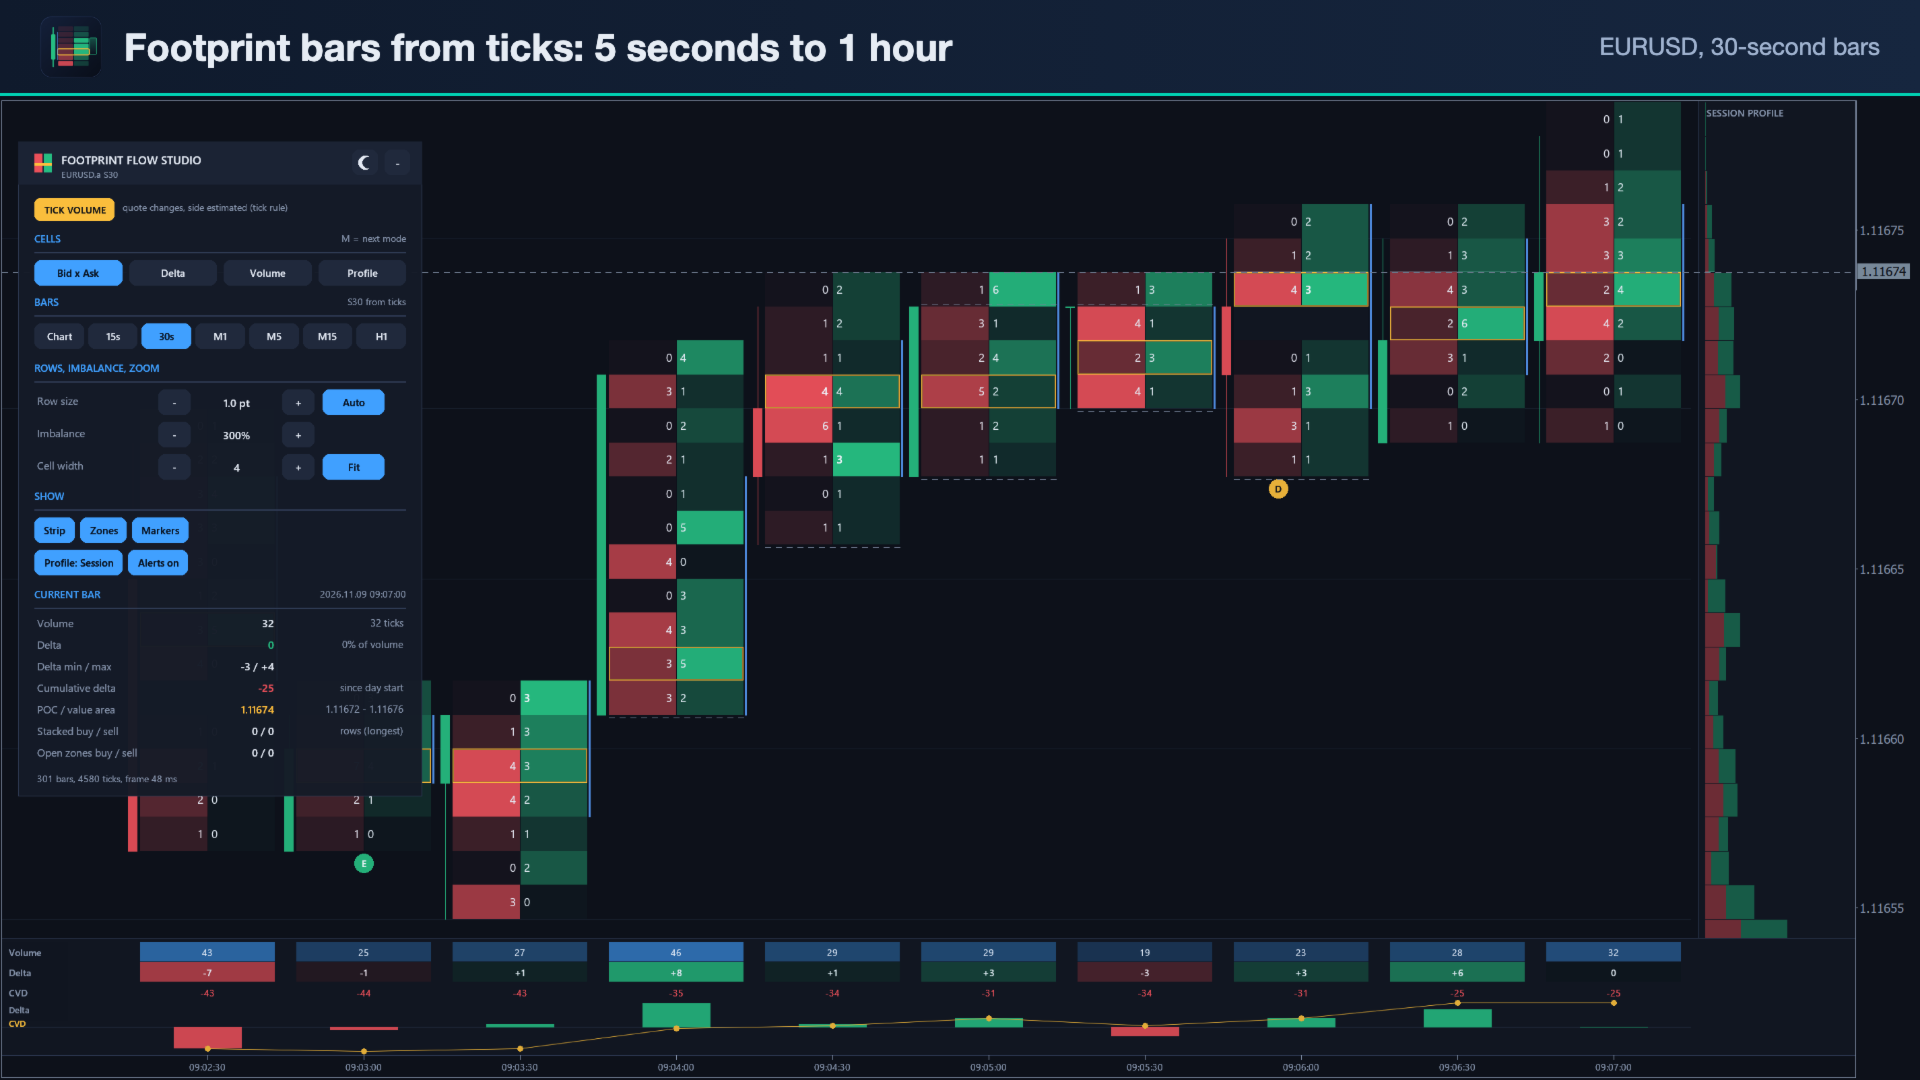
  • Footprint bars can follow the chart timeframe (M1 to H4), or be built from ticks at 5, 10, 15 or 30 seconds, or at 1, 2, 3, 5, 10, 15, 30 minutes or 1 hour, on any chart.
  • Row size is set automatically from the average bar range, so forex, gold, indices and crypto work without tuning. It can also be set in points. Rows are grouped further when you zoom out, so the numbers stay readable. You can also choose the number of rows per cell with the panel's +/− buttons.
  • Bar analysis (stacks, zones, events, alerts and buffers) uses fixed analysis rows, so signals do not change when you zoom.

Navigation that feels like a normal chart

  • Scroll the chart as usual (drag, arrow keys, Home/End) and the footprint follows.
  • The normal chart zoom (+/−, mouse wheel) sets the cell width.
  • Auto-fit keeps the price scale fitted to the visible bars (key F or the Fit button). Switch it off to zoom the price scale freely.
  • The indicator hides the normal candles, grid and date scale while it is attached. Your chart settings come back when you remove it.

Fast and light

  • One canvas draws only the visible bars. Ticks are processed once and then updated incrementally. History loads in small steps in the background, so the terminal stays responsive.
  • Footprint cache on disk: when you reopen the chart or switch back to a timeframe, the footprint is read from the cache and only the new ticks are loaded.
  • Old bars release their rows to keep memory low.

Alerts and EA access

  • Alerts on bar close: stacked imbalance, delta divergence and absorption, as a pop-up, push notification or e-mail.
  • 8 indicator buffers for EAs: bar delta, cumulative delta, bar volume, POC, VAH, VAL, stacked imbalance (+rows buy / −rows sell) and bar event (±1 absorption, ±2 delta divergence, ±3 exhaustion). The buffers are filled when the footprint period equals the chart period.

Panel

  • Cell mode, bar period, row size, imbalance ratio, cell width and auto-fit are all on one panel, with switches for strip, zones, markers, profile and alerts.
  • It also shows statistics for the current bar: volume, delta, delta %, delta min/max, cumulative delta, POC and value area, stacks and open zones.
  • The panel is movable and can be minimised. It has dark and light themes and scales with the screen DPI (tested at 100 % and 200 %).

How it differs from our Volume Profile OrderFlow Suite

The Suite is a level tool: periodic, composite and fixed-range profiles, naked POCs, VWAP and anchored VWAP, and level statistics, with a compact footprint of the latest bars. Footprint Flow Studio is the dedicated footprint workspace: every bar on screen is a full footprint, with bars from seconds to H4, imbalance zones, bar events and a statistics strip. It has no VWAP, periodic profiles or level statistics. The two tools complement each other.

Requirements and notes

  • MetaTrader 5, any symbol. Tick history comes from your broker. The default load is 300 bars, at most 10 days.
  • The footprint quality depends on your broker's tick data. On forex and CFDs it shows tick activity with an estimated side, as explained above.
  • Strategy Tester: works in visual mode, so you can try the free demo. Use "Every tick based on real ticks" for footprints like the live chart. In the generated-tick modes, the footprint is built from the tester's ticks.
  • This is an analysis tool. It does not trade and does not predict prices. Trading involves risk.
Altri dall’autore
Trend Signal Navigator EA – free companion EA for the Trend Signal Navigator indicator This EA trades the confirmed, non-repainting signals of the Trend Signal Navigator indicator automatically, with professional risk and trade management. It is free: you don't need to send a private message or wait for a "bonus EA". How it works Live and demo charts : the EA reads the signals, stop loss and targets of the Trend Signal Navigator indicator through iCustom (default path Market\Trend Signal Navigat
FREE
Overview SR Confluence Pro is a professional MetaTrader 5 indicator for support & resistance and chart pattern analysis. It combines dual S&R engines (high-volume box engine + multi-timeframe pivot engine), automatic detection of 16+ classic chart patterns , and a confluence scoring system that rates how closely price structure and S&R levels align. Every zone is back-tested on the chart history — touches, bounces, breaks, false breaks and bounce rate are combined into a 0–100 strength score — a
A chart overlay indicator for traders who want a structured view of Smart Money Concepts, market structure shifts, order block patterns, fair value gaps, equal highs and lows, and key multi-timeframe price levels directly inside MetaTrader 5. BOS and CHoCH · Internal and Swing Structure · Order Block Finder · Input-Controlled FVG Colors · EQH and EQL · Premium and Discount Zones Product Overview SMC Price Action Patterns is designed to convert raw price action into a clear, visual market map. T
FREE
MACD Divergence Radar Pro Multi-Symbol Divergence Scanner & Visual Dashboard for MetaTrader 5 Regular & Hidden Divergence 20+ Pairs Simultaneous Scan Entry / SL / TP Levels History Statistics One-Click Chart Opening Auto Oscillator Sub-Window Overview MACD Divergence Radar Pro is a professional-grade divergence detection indicator that continuously scans multiple currency pairs and timeframes in real time. It identifies both regular and hidden MACD divergences — bullish and bearish — and presen
Professional account protection for prop-firm challenges and funded accounts. It monitors drawdown, open risk, news windows, trading sessions, manual trades, profit targets, and challenge progress in real time, then warns, locks, de-risks, deletes orders, or closes managed exposure according to your rules. Two draggable on-chart panels — Economic Calendar and Performance Stats — keep news planning and account analytics on the chart without leaving MT5. Built for Prop-Firm Traders This EA does no
VoidFlow IFVG Trade Assistant Pro is a manual-first MetaTrader 5 trading panel for Inverse Fair Value Gap (IFVG) setups. It finds fair value gaps, confirms when price closes through them, scores every setup from 0 to 100, draws a complete trade plan and lets you place the order with one click and one confirmation. Automatic entries are available as an option you switch on yourself. Video walk-through: see the video on this page. Free demo: download it and run it in the Strategy Tester (the demo
ICT Market Structure Pro ICT Market Structure Pro is a Smart Money Concepts / ICT trading tool designed to automatically draw the most important structural and liquidity elements directly on the chart. The indicator helps traders read price action through an institutional lens by mapping market structure shifts, liquidity pools, order blocks, imbalances, premium/discount zones, and key ICT session windows in one place. It supports both single-timeframe and multi-timeframe analysis modes, with a
Trade Assistant Risk Calculator is an all-in-one floating trading panel (Expert Advisor) designed for professional manual traders on MetaTrader 5. It combines Visual Chart Trading , Automatic Risk Calculation , and Advanced Position Management into a single, compact interface. Stop calculating lot sizes manually. Stop guessing your Risk:Reward ratio. Simply drag lines on the chart, and the EA calculates the exact lot size to match your risk percentage, equity, or money target. Important Notes Th
Trade Assistant Risk Calculator is an all-in-one floating trading panel Expert Advisor for MetaTrader 5, built for professional manual traders. It combines visual chart trading , automatic risk calculation , and advanced position management in one compact interface. Stop calculating lot sizes manually. Stop guessing your Risk:Reward ratio. Drag the planning lines on the chart and the EA calculates the exact lot size for your selected risk percentage, equity, fixed-money risk, or fixed-lot workfl
MT5 Indicator · All Markets · Non-Repainting Signals · Entry / SL / TP1-TP3 · MTF + Scanner Momentum Pulse colors every candle by the real momentum behind it, not by price alone. Each bar is scored on five dimensions and placed in one of nine strength states . On top of that you get buy/sell signals with Entry, Stop Loss and three Take Profit levels , a multi-timeframe bias dashboard , a multi-symbol scanner , a forward test of every past signal with win rate and profit factor, and a risk-based
Supertrend core · 11 click-to-toggle confirmation filters · Multi-timeframe trend dashboard · Entry / SL / TP1-TP3 levels · Higher-timeframe filter · Trend cloud · 5,000-bar performance simulation with profit factor & drawdown TrendGuard Pro is a professional-grade MT5 scalping indicator that fortifies every entry signal with up to 11 independent confirmation filters . False breakouts are systematically eliminated before an arrow ever appears on the chart, letting you trade only the highest-pro
ICT Market Structure EA ICT Market Structure EA trades fair value gaps in the direction of market structure, only inside the ICT Silver Bullet hours, and only when the H4 and D1 structure agree. One EA on one chart trades a whole portfolio — by default EURUSD, XAUUSD, USTEC and US500 . Its higher-timeframe context uses the same detection code as the indicator ICT Market Structure Pro (swings, BOS / CHoCH, order blocks, FVGs, premium / discount). The default portfolio and settings were checked wi
Price Action 10 Setups EA Price Action 10 Setups EA automates ten classic bar-by-bar price-action setups — the patterns that discretionary price-action traders consider the most reliable: major trend reversals, final flags, breakouts, High 2 / Low 2 pullbacks, wedges, channels, measured moves, trading-range reversals, opening reversals and magnet (breakout) tests. Every setup is a fully coded rule set with a precise entry, stop and target, so the EA trades the patterns the same way every time. O
MACD Divergence Radar EA MACD Divergence Radar EA trades MACD divergences automatically. It uses the same signal engine as the indicator MACD Divergence Radar Pro — price pivots compared with the MACD histogram (OsMA) or the MACD main line, regular and hidden divergences, bullish and bearish — and turns every freshly confirmed divergence into a trade with a stop beyond the divergence pivot and a fixed reward-to-risk target. One EA on one chart can trade a whole portfolio; by default EURUSD, GBPU
TrendGuard Pro Auto EA is a fully automated trend-following Expert Advisor built on the TrendGuard Pro signal engine. It enters when the Supertrend flips and the confirmation filters agree, protects every trade with an ATR stop loss, can bank profits in steps at TP1 / TP2 / TP3, lets winners run with an ATR trailing stop, and exits on the opposite signal. It trades the chart symbol, or a whole portfolio of symbols from one chart, and is controlled from an interactive on-chart dashboard. Signal e
Price Action 10 Setups Indicator Price Action 10 Setups Indicator finds ten classic bar-by-bar price-action setups on your chart and turns every one of them into a complete trade plan: entry, stop loss and target , drawn on the chart, tracked bar by bar and summarised in a modern dashboard with per-setup statistics, a multi-symbol scanner and alerts. The detection is the same code as in Price Action 10 Setups EA (the automated version on the MQL5 Market): the indicator shows a signal exactly whe
Momentum Pulse EA trades the signals of the Momentum Pulse indicator automatically. The complete Momentum Pulse signal engine is built into the EA: every closed bar is coloured in one of nine momentum states, and a change of state becomes a buy or sell signal with its own Entry, Stop Loss and three take-profit levels. The EA takes those trades with risk-based position sizing, banks profit in steps at TP1 / TP2 / TP3 and manages the rest with breakeven and an ATR trailing stop. One chart can trad
Harmonic patterns with an honest track record. The indicator finds Gartley, Bat, Alt Bat, Butterfly, Crab, Deep Crab, Shark, Cypher, 5-0 and AB=CD patterns on your chart and on dozens of symbols and timeframes at once, draws the XABCD shape with its Potential Reversal Zone (PRZ) and Fibonacci ratios, gives entry, stop loss and three targets, and shows how often each pattern actually worked on each symbol: PRZ hold rate, TP1 and TP2 hit rate and average result in R , measured with exactly the sam
Currency Strength Matrix measures the strength of the 8 major currencies from all 28 pairs , plus gold and any indices you add, and shows it three ways on one chart: a multi-timeframe heatmap (M5 to D1), strength lines in a sub-window, and an automatic strongest-vs-weakest pair picker . Click any cell or pair and the chart switches to it. Closed bars never repaint, and the indicator shows you how its own picks behaved on the history you have loaded. How strength is measured Each currency is comp
Bitcoin Trend Rider EA Bitcoin Trend Rider EA is a trend-following and volatility-breakout Expert Advisor for BTCUSD , ETHUSD and other crypto CFDs. It stays out of sideways and dead markets, enters only when a trend is confirmed, puts a hard ATR stop on every order and lets winning trends run with a chandelier trailing stop. No grid, no martingale, no averaging down, no hedging tricks. Everything is visible: every input is in the Inputs window, the ready-made setups are listed below, and the lo
Gold Edge Portfolio EA trades XAUUSD with six independent, simple strategies at the same time . Each engine has its own on/off switch, its own magic number and its own risk per trade, and every trade is placed with a hard stop loss . There is no grid, no martingale, no averaging and no hedging — one position per engine at most. What makes it different is transparency : a dashboard on the chart shows the live state and the real statistics of every engine — trades, win rate, profit factor, net pro
Session Breakout Portfolio EA A session-range breakout portfolio for gold, the Nikkei and the yen, traded from one chart. Every market has a quiet session and an active open. The EA builds the range in the quiet session (Asian range, pre-open or opening range), in the exchange's own time zone with automatic daylight saving, and trades the breakout at the active session open with OCO stop orders. One stop-protected trade per market per day. No grid, no martingale, no averaging. Default portfolio
Trend Signal Navigator – trend, signals, targets and honest statistics in one indicator Trend Signal Navigator is an all-in-one trend signal system for MetaTrader 5. It shows the trend direction and regime, gives confirmed non-repainting BUY/SELL signals with an adaptive stop loss and three take-profit targets , marks reversal zones and key levels, and measures how its own signals performed on your chart in a live statistics panel. No hidden rules: every number in the panel can be re-counted fro
Evening Cross MeanReversion EA — Institutional Multi-Pair FX Cross Mean-Reversion Portfolio Evening Cross MeanReversion EA is a professional, non-grid, non-martingale multi-currency mean-reversion Expert Advisor engineered for the post-London evening session and the calm Asian liquidity window. By attaching the EA to a single M15 chart (for example, EURNZD M15 ), it simultaneously monitors and trades up to 8 liquid FX cross pairs ( EURNZD, GBPCAD, GBPJPY, AUDNZD, GBPCHF, EURCHF, GBPAUD, EURCAD )
EA Performance Ledger shows what every Expert Advisor on your account really earns. MetaTrader shows one balance for the whole account; when several EAs, manual trades and copied signals share it, you cannot see which one carries the account and which one drains it. The Ledger reads the account history, rebuilds every closed position and splits the results by EA, symbol, strategy tag, direction and manual vs automated trading, in one clear dashboard. Read-only. The Ledger never places, modifies
Local Trade Copier Pro copies trades between MetaTrader 5 terminals running on the same Windows PC or VPS . One EA, two modes: run it as Master on the account that trades and as Receiver on every account that should follow. Positions, pending orders, SL/TP changes, partial closes and closes are copied within a few hundred milliseconds including the broker's execution (median 333 ms in our live test), through the terminals' shared Common Files folder: no DLL, no internet connection, no extra soft
Currency Strength Matrix EA — Strength Exhaustion on all 28 FX pairs Currency Strength Matrix EA measures the strength of the 8 major currencies ( EUR, GBP, AUD, NZD, USD, CAD, CHF, JPY , optionally plus gold) from all 28 currency pairs on three timeframes, and trades the moment when the strongest and the weakest currency are stretched too far. It is the automated companion of our Currency Strength Matrix Pro indicator and uses the same strength engine. Attach it to one chart (any symbol, any ti
Turn your MT5 account into a signal channel. TradeCast posts every trade action of your account to up to three Telegram channels, groups or private chats: new trades, pending orders, stop-loss and take-profit changes, breakeven, partial and full closes with the result in money, pips and R , a chart screenshot, and daily, weekly and monthly performance summaries. Trades opened by hand, by any Expert Advisor or from the MT5 mobile app are all detected, because TradeCast watches the account itself.
Custom Charts Pro builds seconds charts (S1 … S3600, any value), Renko , Range bars and Tick charts as real MetaTrader 5 custom symbols, from your broker's real ticks . It fills the history first, then keeps every chart updated live, for as many symbols and chart types as you like, from one control panel. The generated charts are normal MT5 charts: your indicators, templates, drawings and Expert Advisors work on them, and so does the Strategy Tester . Chart types Seconds : bars of N seconds (S1,
EA Robustness Lab tells you whether an Expert Advisor's results are robust or overfitted. A good backtest is not proof: it can come from a lucky order of trades, a few outsized wins, costs that were too optimistic, parameters fitted to the past, or a market regime that is gone. The Lab takes the closed trades of a strategy, puts them through Monte Carlo, walk-forward, stability, regime and optimisation tests, compares live trading with the backtest, and sums it all up in one robustness score fro
Filtro:
Nessuna recensione
Rispondi alla recensione