Footprint Flow Studio
- Göstergeler
- Sürüm: 1.0
- Etkinleştirmeler: 10

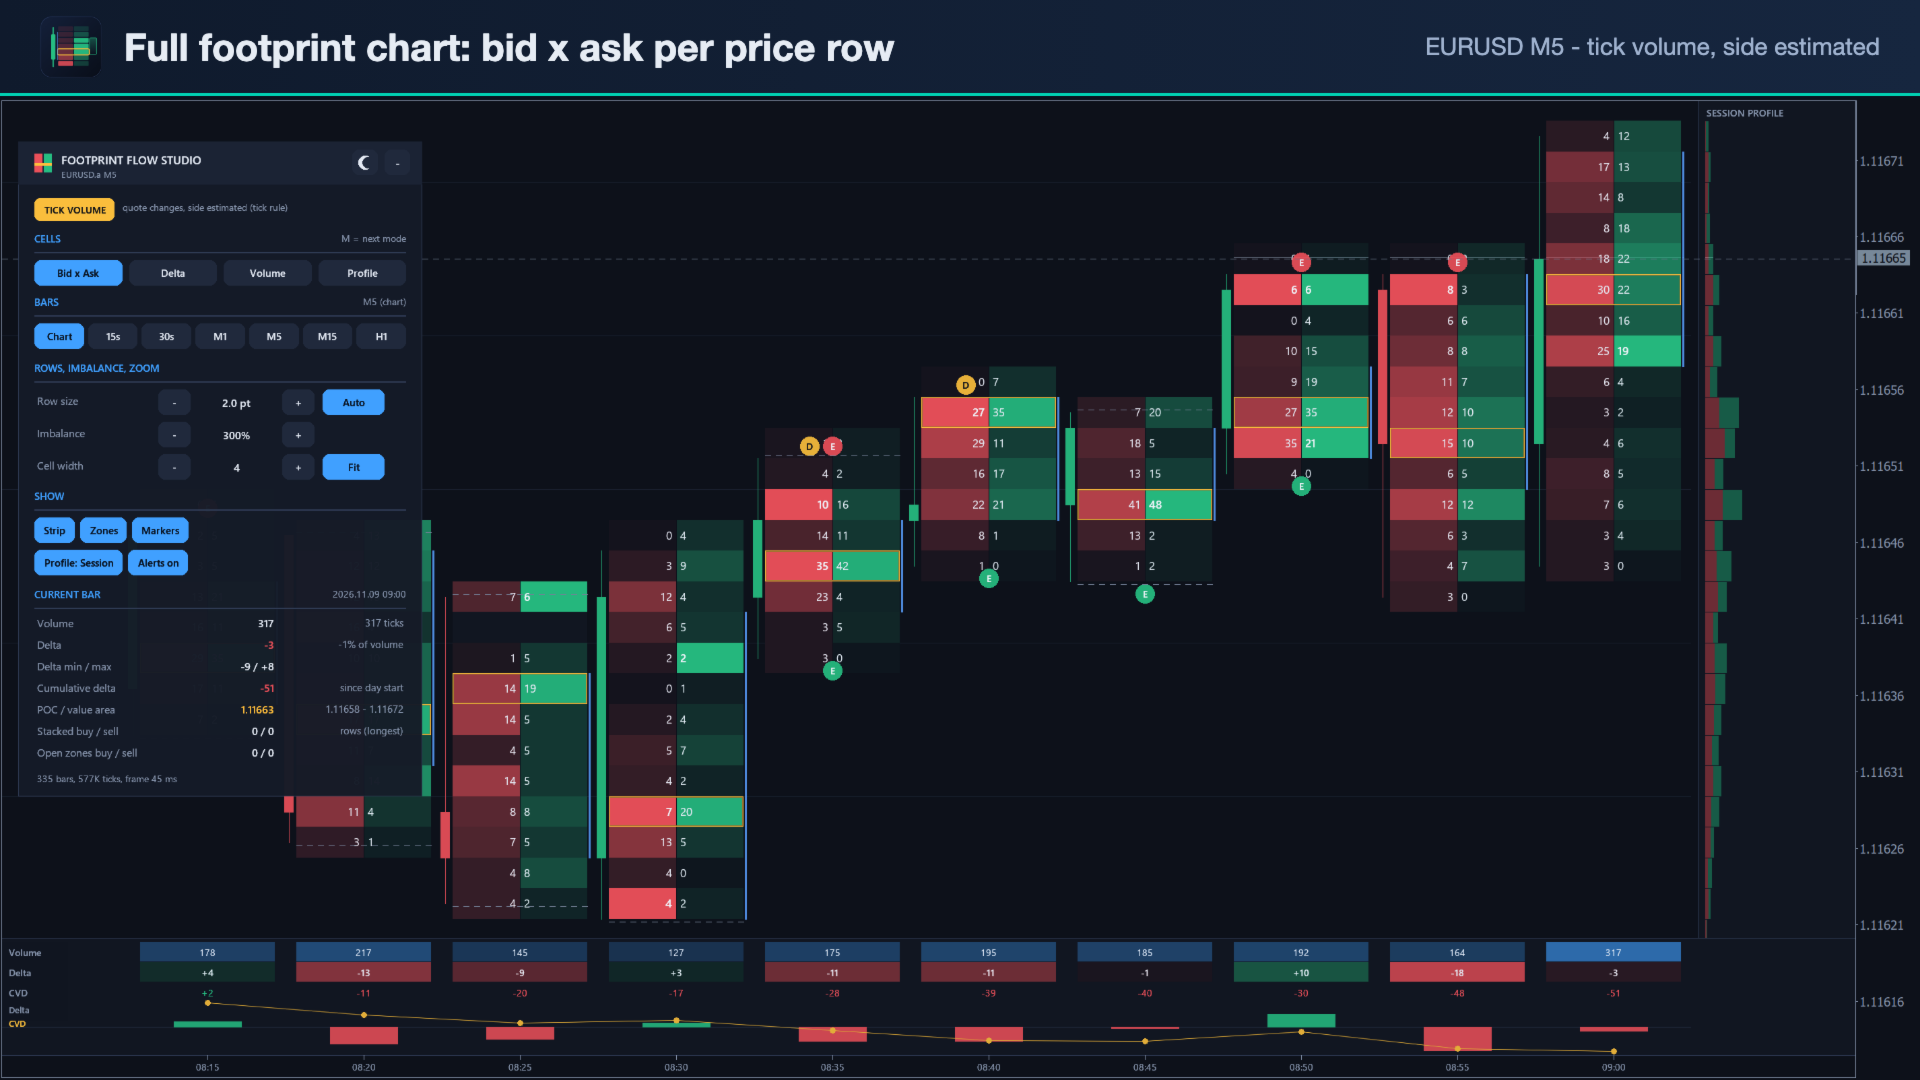
Footprint Flow Studio turns a MetaTrader 5 chart into a full footprint chart. Every bar is split into price rows, and each row shows how much was traded on the bid and on the ask. You see where buyers and sellers were aggressive, where they were absorbed, and where an auction ran out, bar by bar.
The panel always shows which data is used. Forex and CFD symbols in MT5 only have tick volume: every quote change counts as 1, and the buy/sell side is estimated from the direction of the price change. This shows where the activity was and which way price was pushed, but it is not exchange order flow, and the numbers will differ from a futures data feed. Symbols with exchange trades (futures, stocks and some crypto feeds) use real volume, and the side then comes from the broker's trade data. The panel badge reads REAL VOLUME or TICK VOLUME and lists the classification method used.
Footprint cells
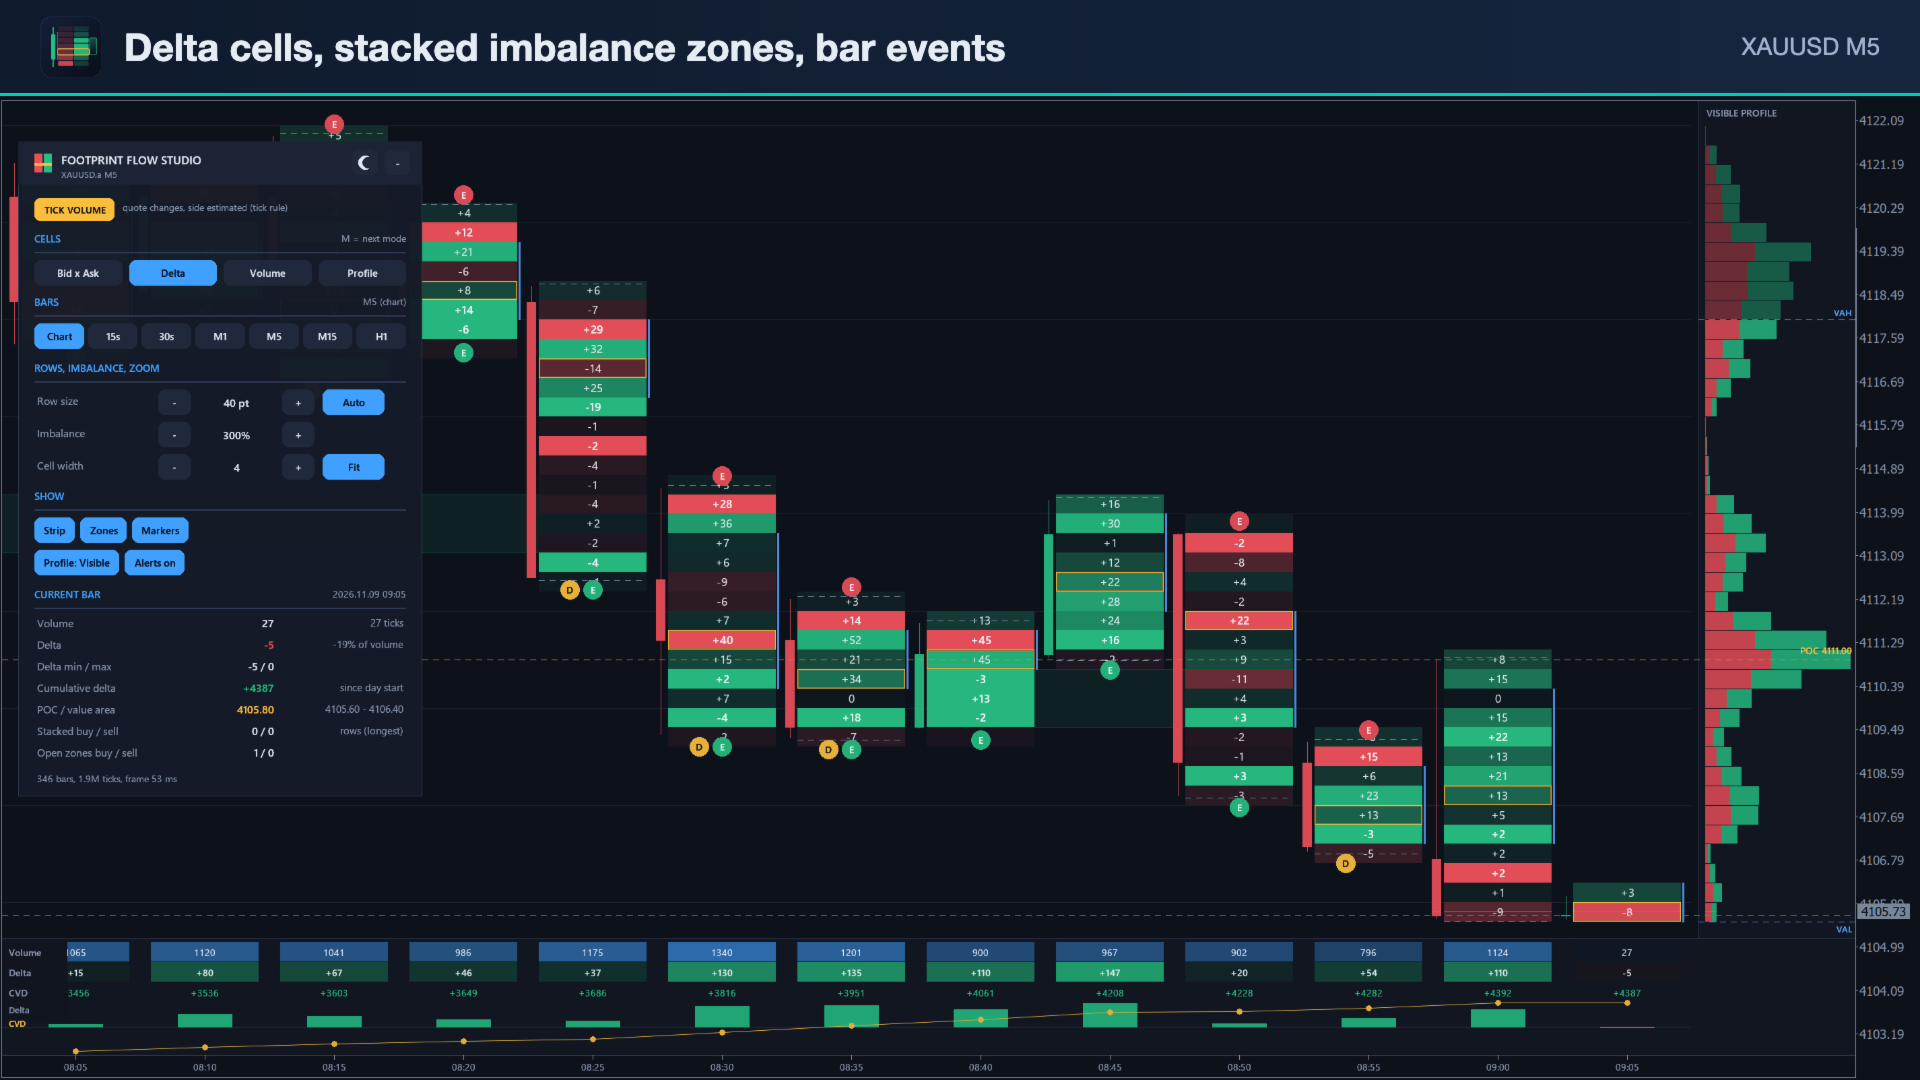
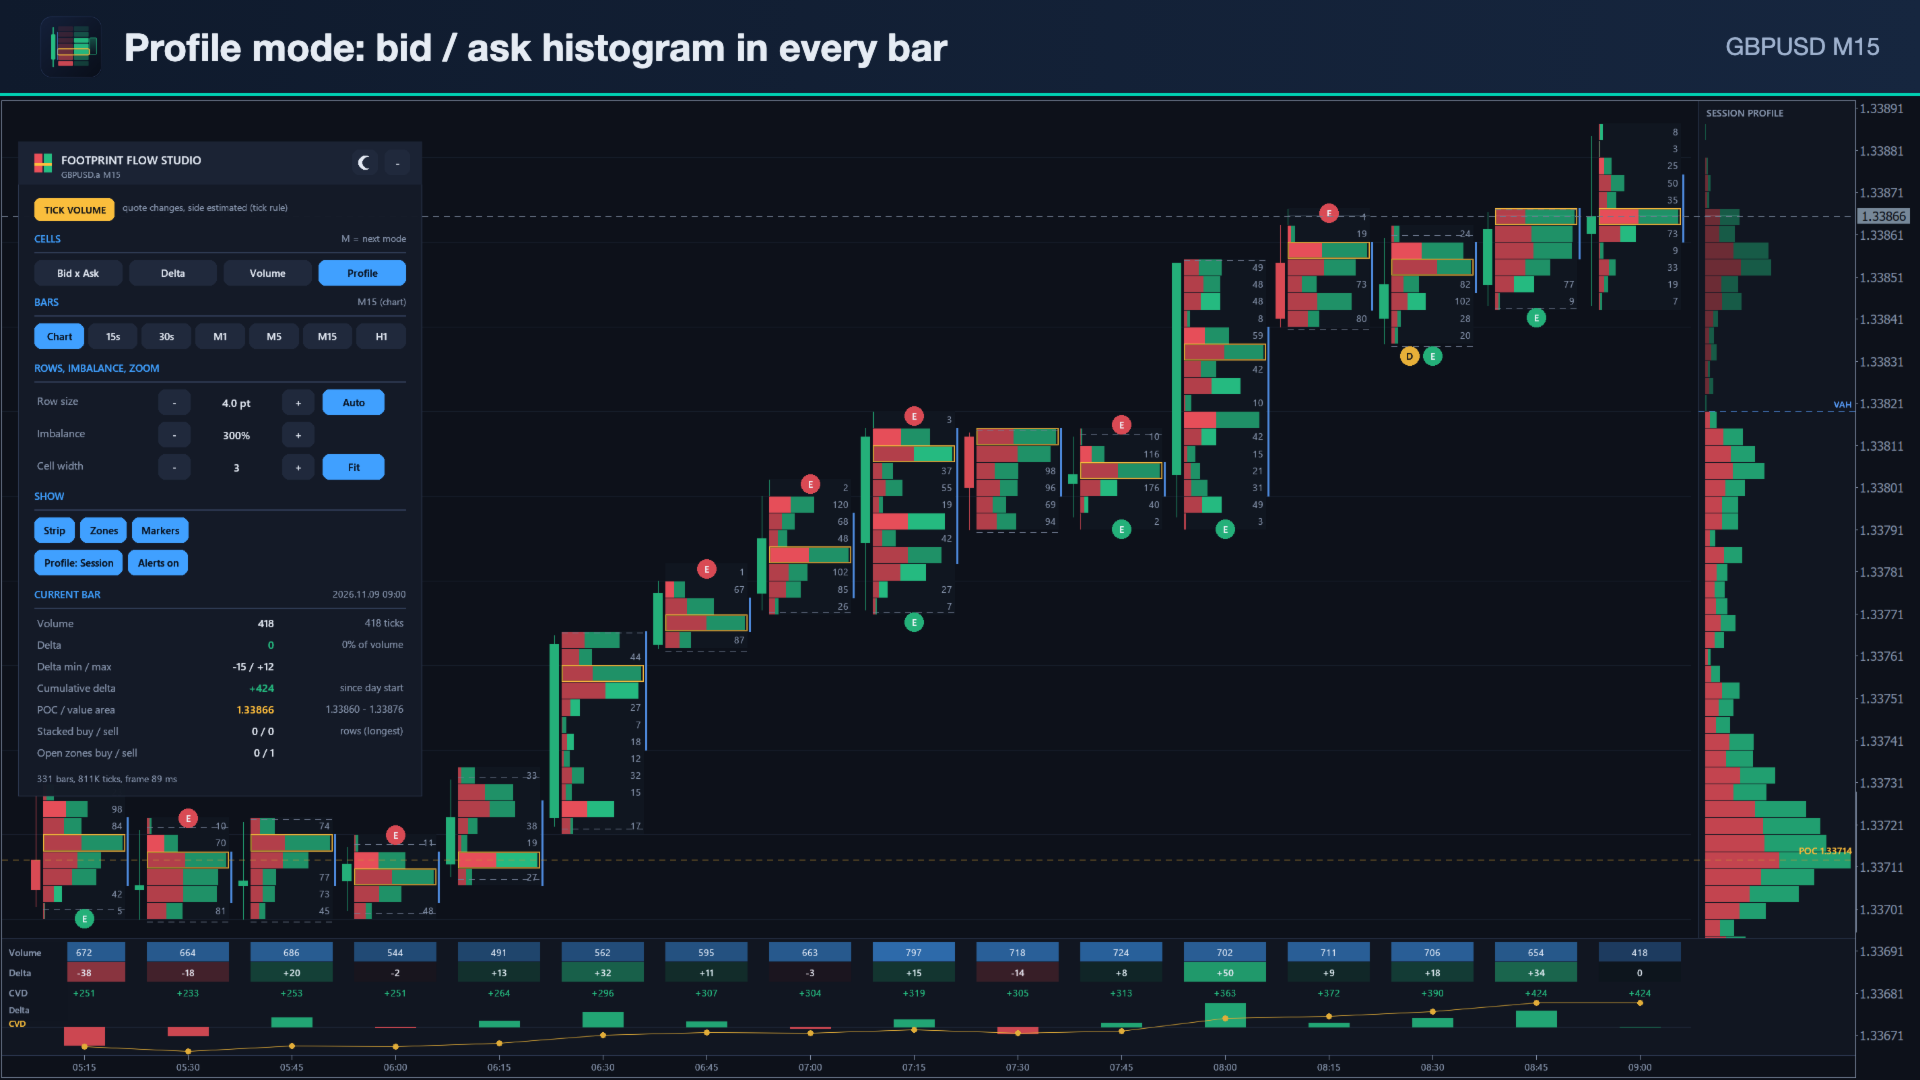
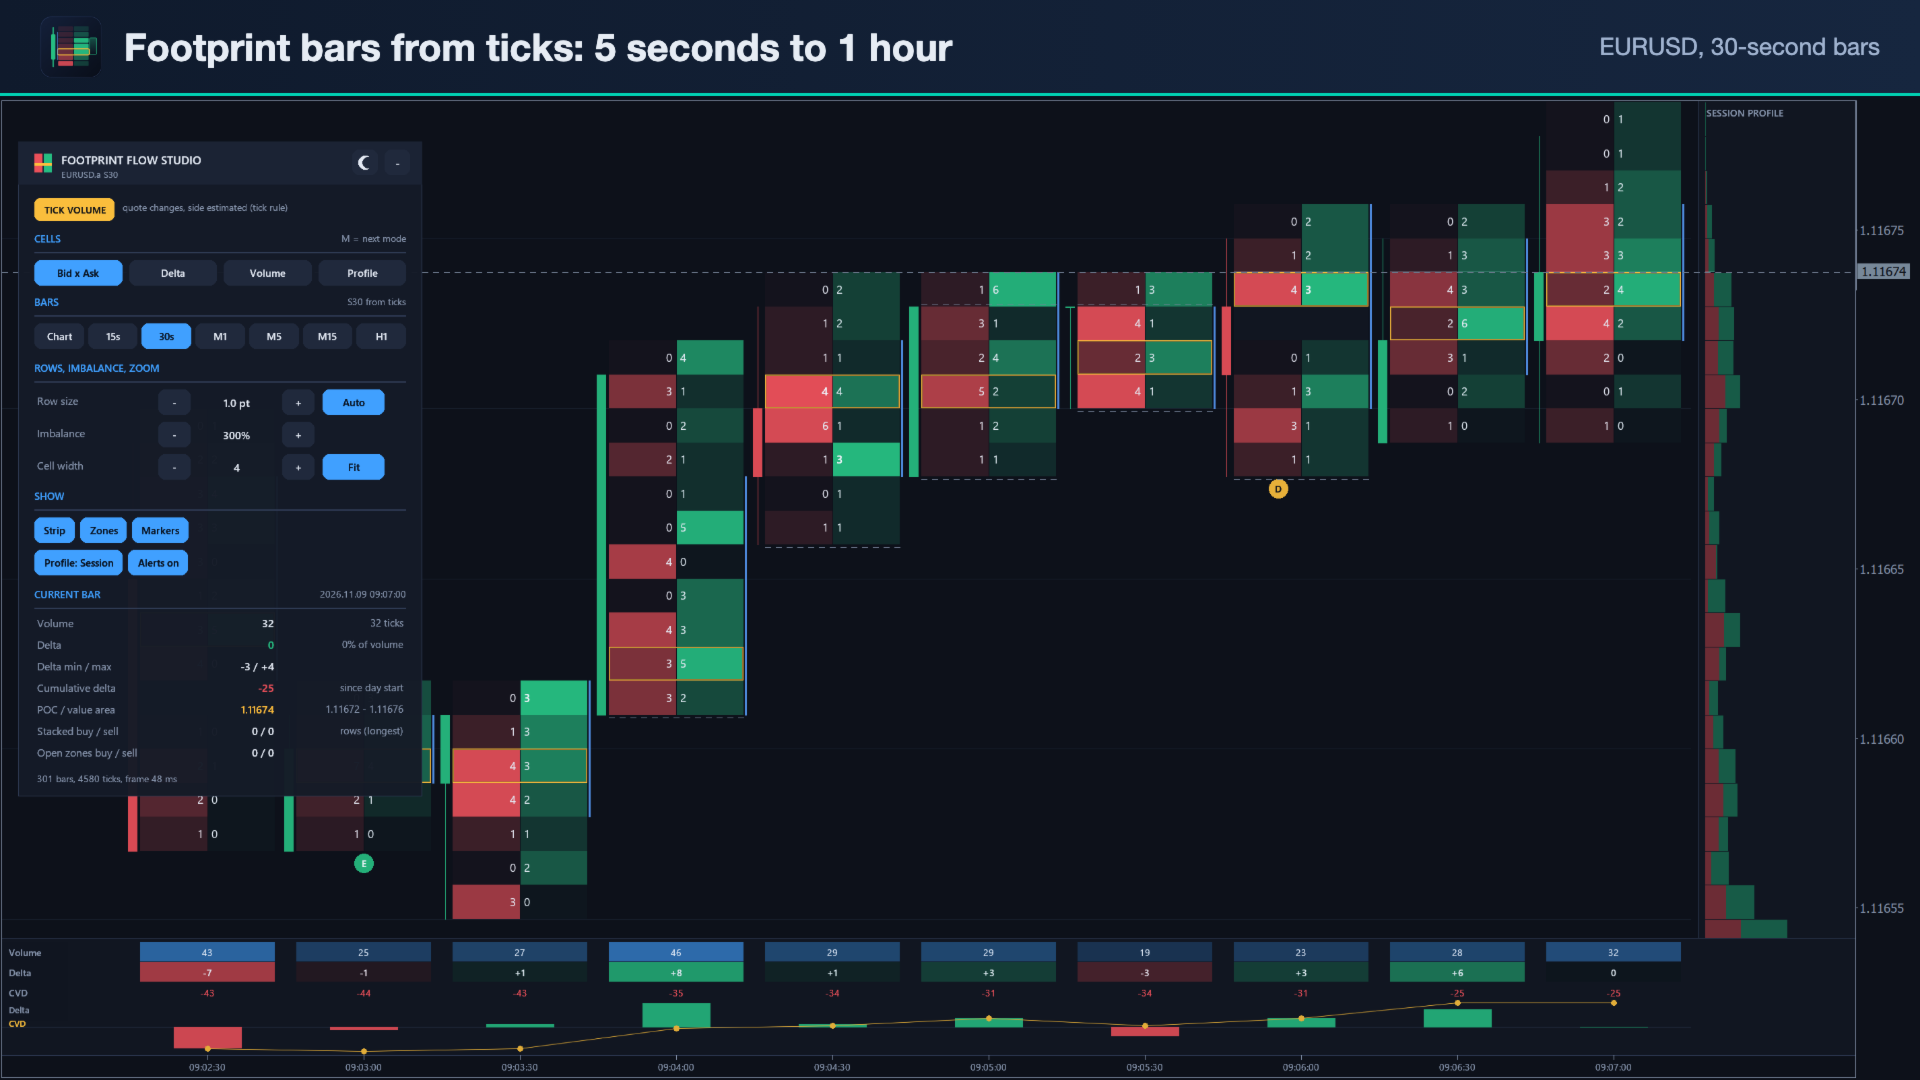
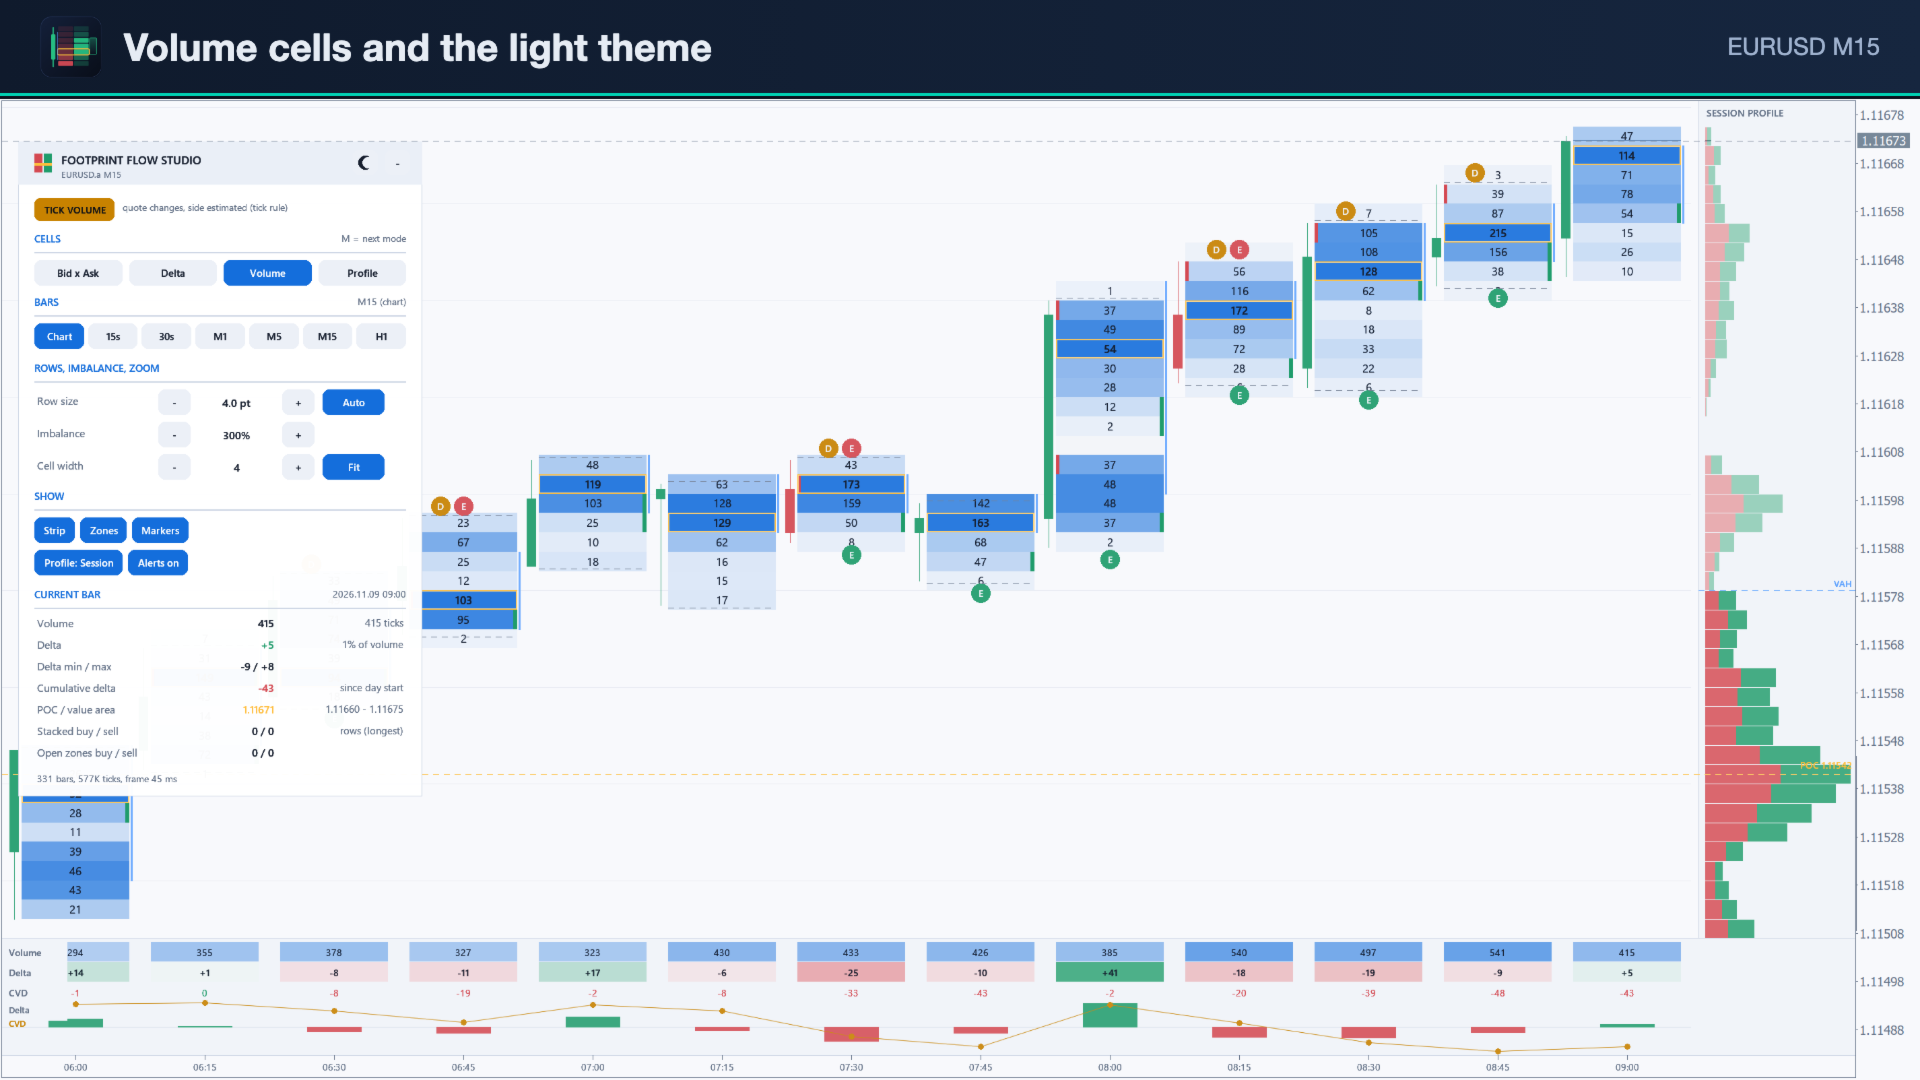
- Four cell modes, one click each (or key M): Bid x Ask (sell volume left, buy volume right), Delta per row, Volume per row, and Profile (a horizontal bid/ask histogram inside every bar).
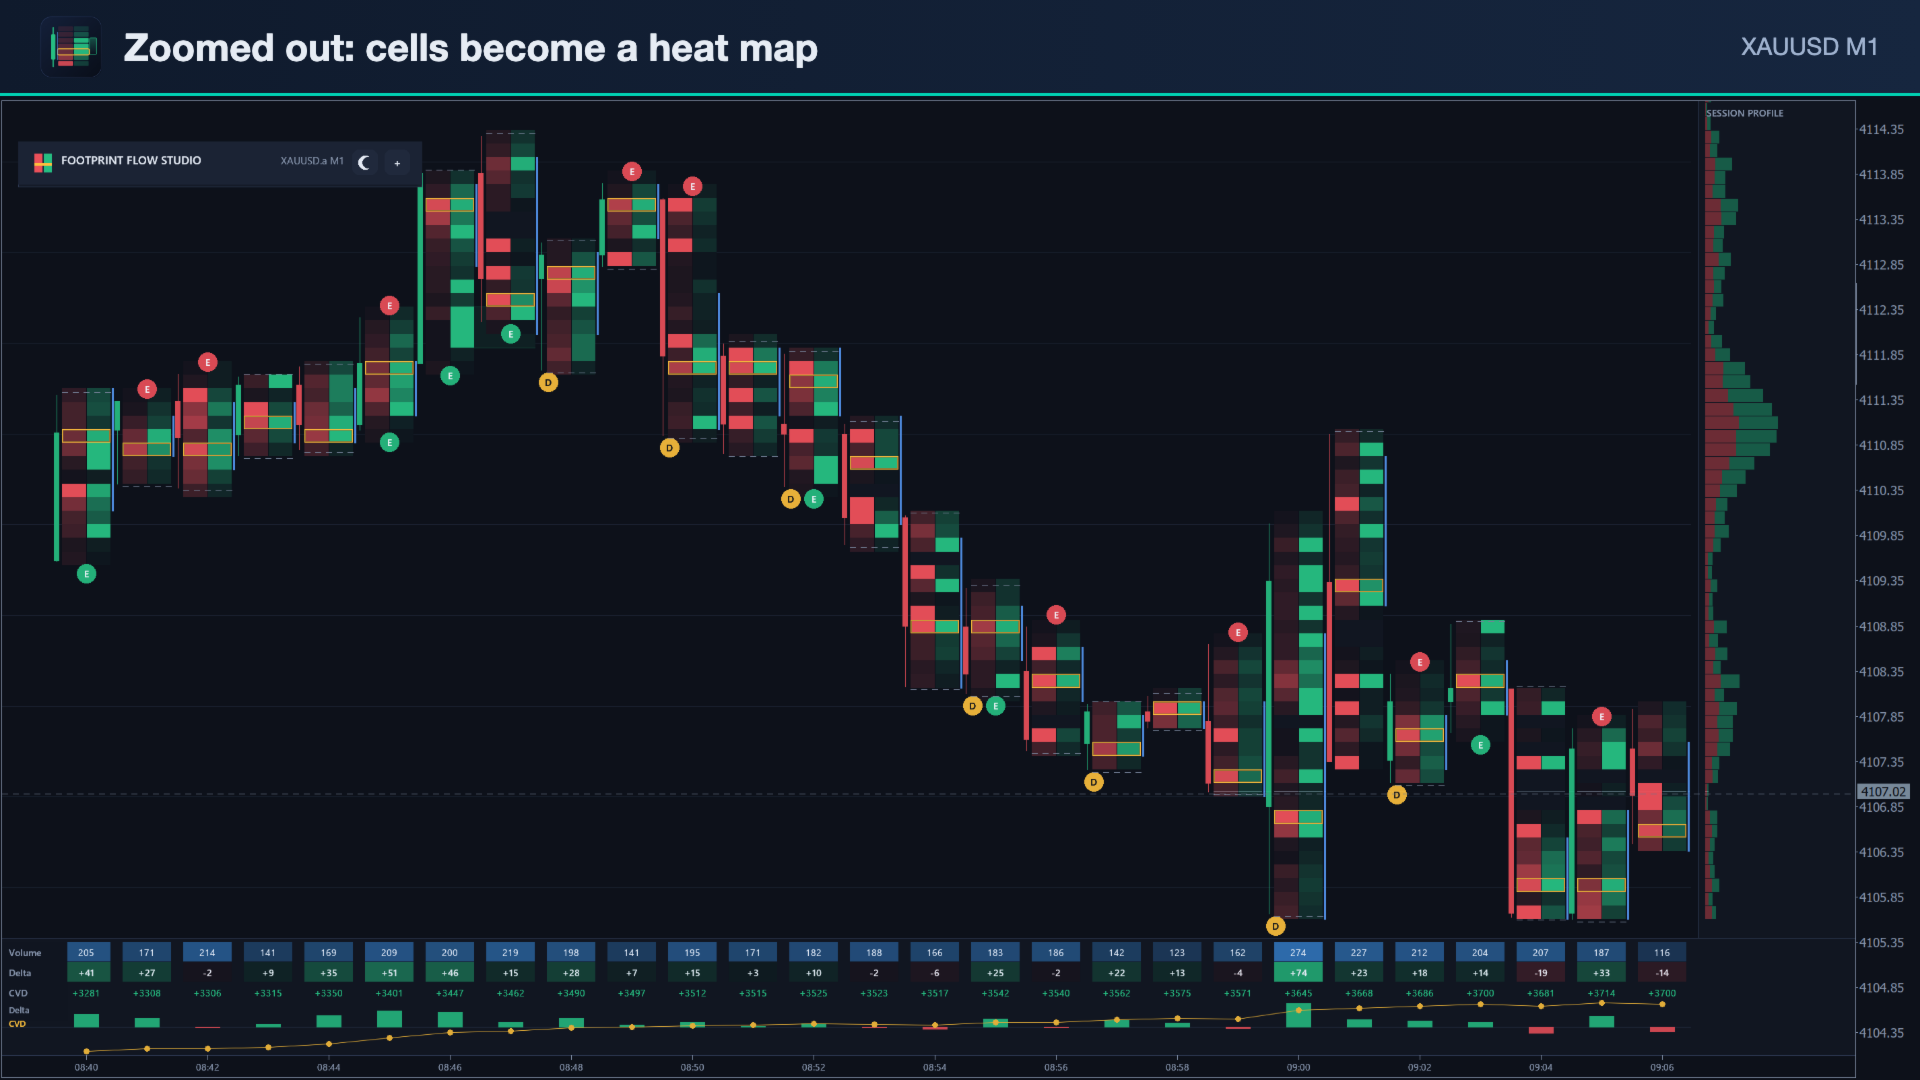
- Cells are shaded by size, so the heavy rows stand out even when you zoom far out and the numbers are hidden.
- A slim candle next to every footprint column shows open, high, low and close.
- POC (the row with the most volume) is outlined in every bar. A bracket marks the bar's value area (70 % by default).
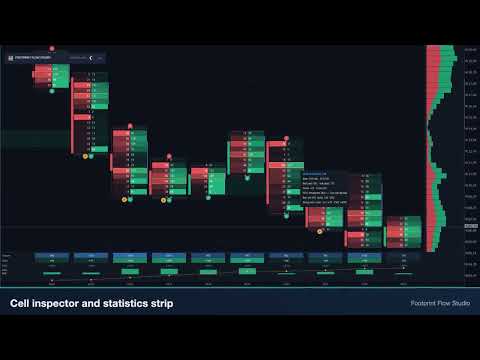
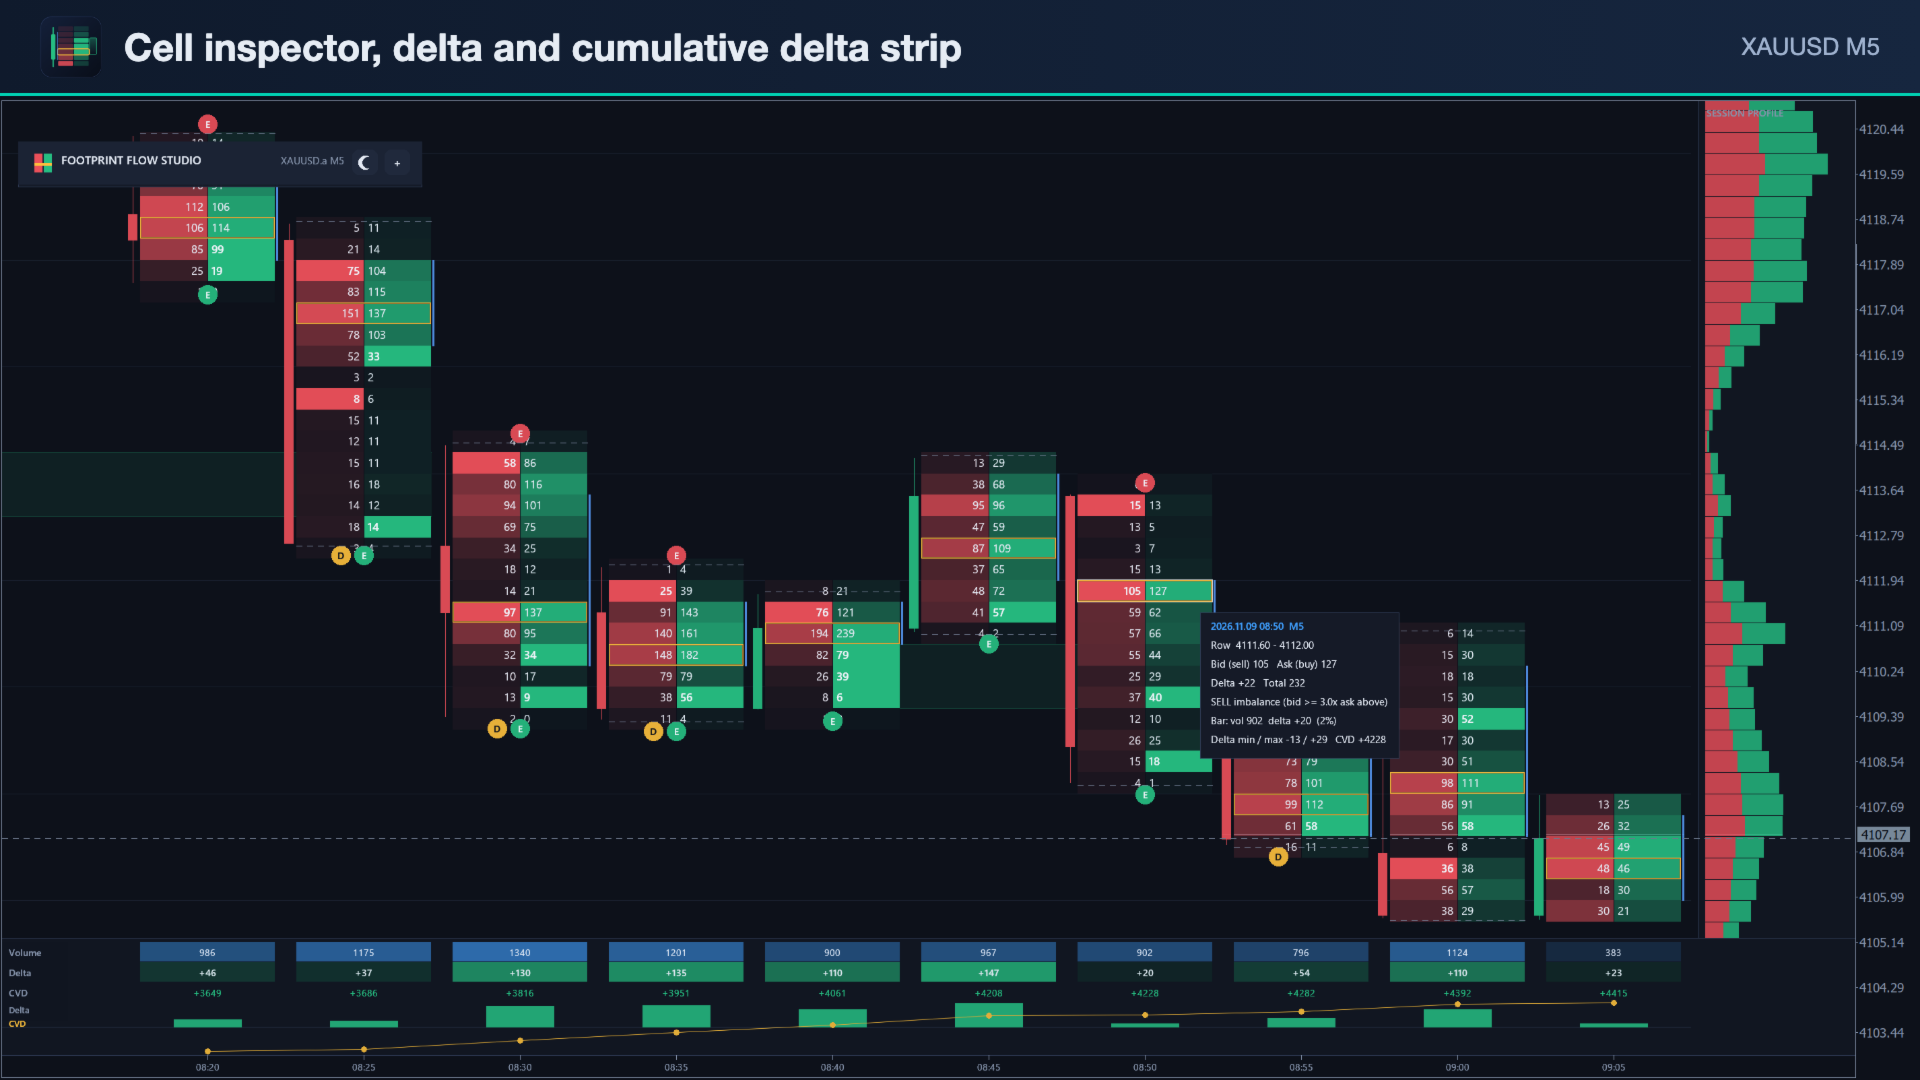
- Cell inspector: move the mouse over any cell to see the exact bid, ask, delta and total. It also shows any imbalance, and the bar's volume, delta, delta min/max and cumulative delta.
Imbalances and zones
- Diagonal imbalances: the ask of a row is compared with the bid one row lower, and the bid with the ask one row higher. The ratio can be set (300 % by default) and changed live on the panel.
- Stacked imbalances (3 or more rows in a row by default) become zones. A zone is extended to the right until price trades back into it. Open zones and tested zones look different.
- A minimum cell volume keeps thin rows from giving false imbalances.
Bar events
- A: absorption. Heavy selling at the low with a close in the upper half, or heavy buying at the high with a close in the lower half.
- E: exhaustion, where the extreme row traded far less than the bar's average row.
- D: delta divergence. A higher high with negative delta, or a lower low with positive delta.
- Unfinished auction: both sides traded at the bar's extreme. It is shown as a dotted line.
Delta strip, profile and time axis
- Statistics strip under the bars: volume, delta and cumulative delta per bar, with a delta histogram and a cumulative delta line. Cumulative delta resets each trading day or runs continuously.
- Right-side profile of the current session or of the visible bars, with POC, VAH and VAL lines across the chart.
- Own time axis with date changes, because footprint bars can differ from the chart bars.
Bars from ticks: seconds to H4
- Footprint bars can follow the chart timeframe (M1 to H4), or be built from ticks at 5, 10, 15 or 30 seconds, or at 1, 2, 3, 5, 10, 15, 30 minutes or 1 hour, on any chart.
- Row size is set automatically from the average bar range, so forex, gold, indices and crypto work without tuning. It can also be set in points. Rows are grouped further when you zoom out, so the numbers stay readable. You can also choose the number of rows per cell with the panel's +/− buttons.
- Bar analysis (stacks, zones, events, alerts and buffers) uses fixed analysis rows, so signals do not change when you zoom.
Navigation that feels like a normal chart
- Scroll the chart as usual (drag, arrow keys, Home/End) and the footprint follows.
- The normal chart zoom (+/−, mouse wheel) sets the cell width.
- Auto-fit keeps the price scale fitted to the visible bars (key F or the Fit button). Switch it off to zoom the price scale freely.
- The indicator hides the normal candles, grid and date scale while it is attached. Your chart settings come back when you remove it.
Fast and light
- One canvas draws only the visible bars. Ticks are processed once and then updated incrementally. History loads in small steps in the background, so the terminal stays responsive.
- Footprint cache on disk: when you reopen the chart or switch back to a timeframe, the footprint is read from the cache and only the new ticks are loaded.
- Old bars release their rows to keep memory low.
Alerts and EA access
- Alerts on bar close: stacked imbalance, delta divergence and absorption, as a pop-up, push notification or e-mail.
- 8 indicator buffers for EAs: bar delta, cumulative delta, bar volume, POC, VAH, VAL, stacked imbalance (+rows buy / −rows sell) and bar event (±1 absorption, ±2 delta divergence, ±3 exhaustion). The buffers are filled when the footprint period equals the chart period.
Panel
- Cell mode, bar period, row size, imbalance ratio, cell width and auto-fit are all on one panel, with switches for strip, zones, markers, profile and alerts.
- It also shows statistics for the current bar: volume, delta, delta %, delta min/max, cumulative delta, POC and value area, stacks and open zones.
- The panel is movable and can be minimised. It has dark and light themes and scales with the screen DPI (tested at 100 % and 200 %).
How it differs from our Volume Profile OrderFlow Suite
The Suite is a level tool: periodic, composite and fixed-range profiles, naked POCs, VWAP and anchored VWAP, and level statistics, with a compact footprint of the latest bars. Footprint Flow Studio is the dedicated footprint workspace: every bar on screen is a full footprint, with bars from seconds to H4, imbalance zones, bar events and a statistics strip. It has no VWAP, periodic profiles or level statistics. The two tools complement each other.
Requirements and notes
- MetaTrader 5, any symbol. Tick history comes from your broker. The default load is 300 bars, at most 10 days.
- The footprint quality depends on your broker's tick data. On forex and CFDs it shows tick activity with an estimated side, as explained above.
- Strategy Tester: works in visual mode, so you can try the free demo. Use "Every tick based on real ticks" for footprints like the live chart. In the generated-tick modes, the footprint is built from the tester's ticks.
- This is an analysis tool. It does not trade and does not predict prices. Trading involves risk.