Position Risk Panel
- Indicators
-
Evgenii Petrov
 FX & Macro Trader with 13+ years of experience in financial analysis and trading.
My primary focus is discretionary EUR/USD trading, with an emphasis on macroeconomic analysis, market structure, risk management and disciplined exposure management. - Version: 11.0
I use this indicator in my own live trading.
I believe in showing not only trading results but also the tools I use in my day-to-day work with the market.
You can explore my trading history, view open and closed trades, and evaluate the statistics of my live account on MQL5 Signals.
📊 My live trading account:https://www.mql5.com/ru/signals/2385035?source=Site+Signals+My
What is this indicator for?
When managing multiple positions on the same instrument, it is important to understand the overall position structure: total Buy and Sell volumes, net exposure, average prices, and potential price movement under a specified loss limit.
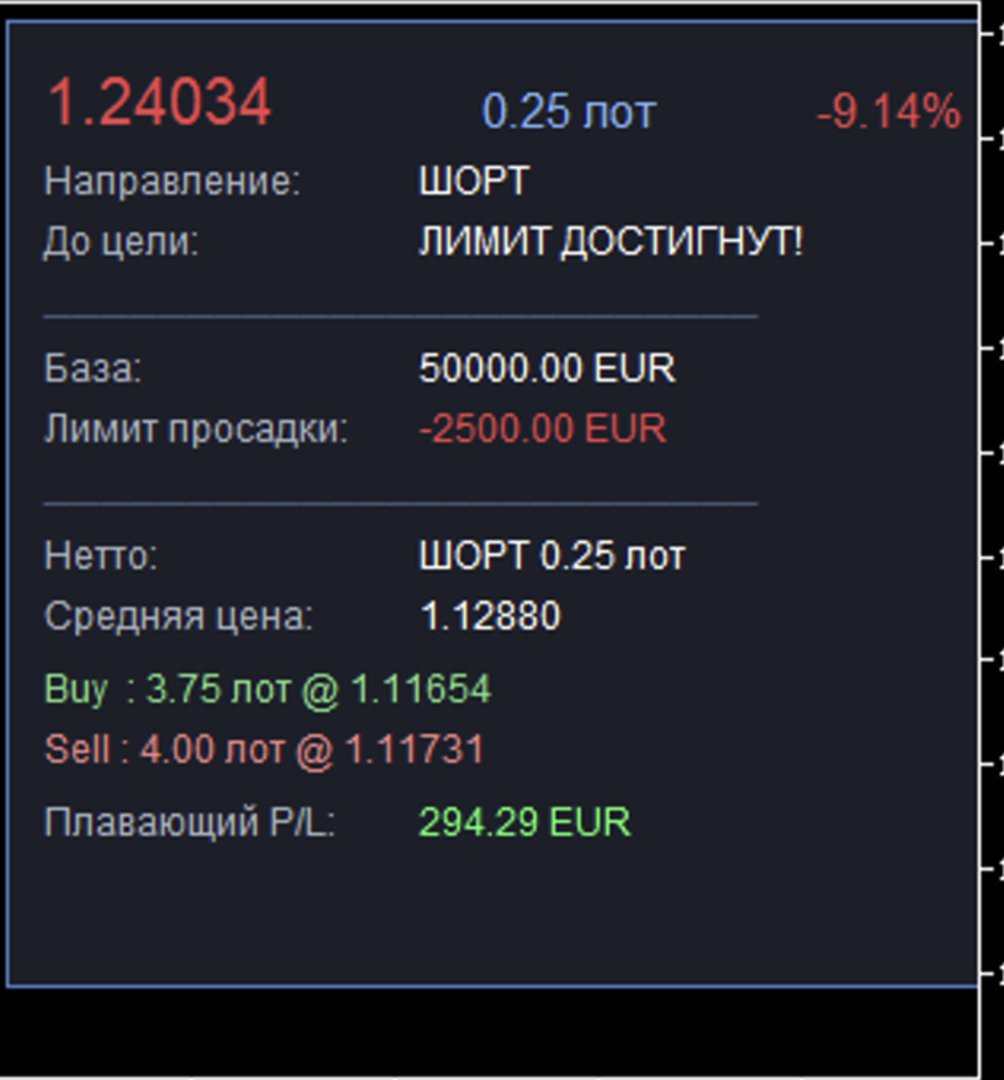
This indicator combines these parameters in a single information panel. It allows you to monitor the current position structure and compare the calculated price level with the current market price and changes in Equity.
Main features
1. Calculated drawdown price level
The indicator calculates a price level based on the selected reference amount, specified drawdown percentage, net position volume, and calculated average price.
The level does not depend on the current Equity value and changes when the composition of open positions changes.
2. Hedge volume calculation
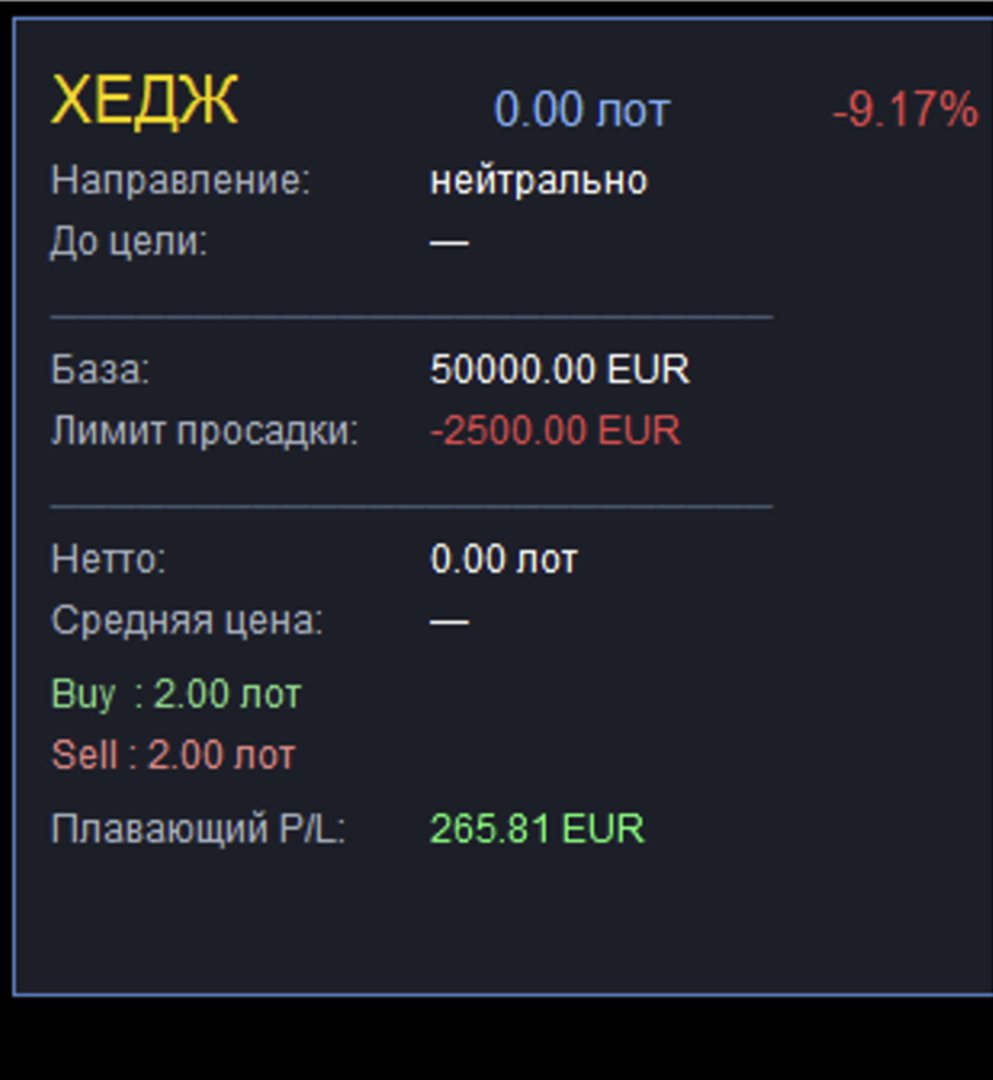
Displays the absolute difference between total Buy and Sell volumes. This helps assess net directional exposure and the volume of an opposing position required to neutralize it.
3. Equity change monitoring
Displays the percentage change in Equity relative to the selected reference amount. The value updates during trading, allowing you to monitor the current financial result of the account relative to the reference amount.
4. Distance to the calculated level
Displays the distance between the current market price and the calculated level in points and pips.
If the Equity change reaches the specified negative threshold, the panel displays a notification indicating that the limit has been reached.
5. Direction and net exposure
Displays the direction of the net position — LONG or SHORT — and its volume. When exposure is neutral, the panel displays the hedged state.
6. Average position prices
Displays the volume-weighted average Buy and Sell prices, as well as the calculated average price of the net position.
7. Buy and Sell volumes
Displays the total volume of open Buy and Sell positions for the current instrument, together with the average prices of the respective position groups.
8. Floating financial result
Displays the total floating P/L of open positions on the current instrument, including swaps.
9. Visual indicators
The calculated price level changes color as the current price approaches it. Separate color indicators show positive or negative Equity changes and floating results.
Indicator settings
You can select one of two reference amount modes:
- Current trading account balance.
- Manually specified amount.
Additional settings include the reference currency, permitted drawdown percentage, font size, and information panel position.
How it works
The indicator analyzes open positions only for the trading instrument displayed on the current chart.
This is an informational tool: it does not open, modify, or close trades.
The calculated price level is an estimate based on the model used by the indicator, not a guarantee that the actual account drawdown will remain within the specified limit. Equity reflects the financial result of the entire account, whereas the calculated price level is determined using positions on the current instrument.
Interface language: Russian. All headings in the information panel are displayed in Russian.